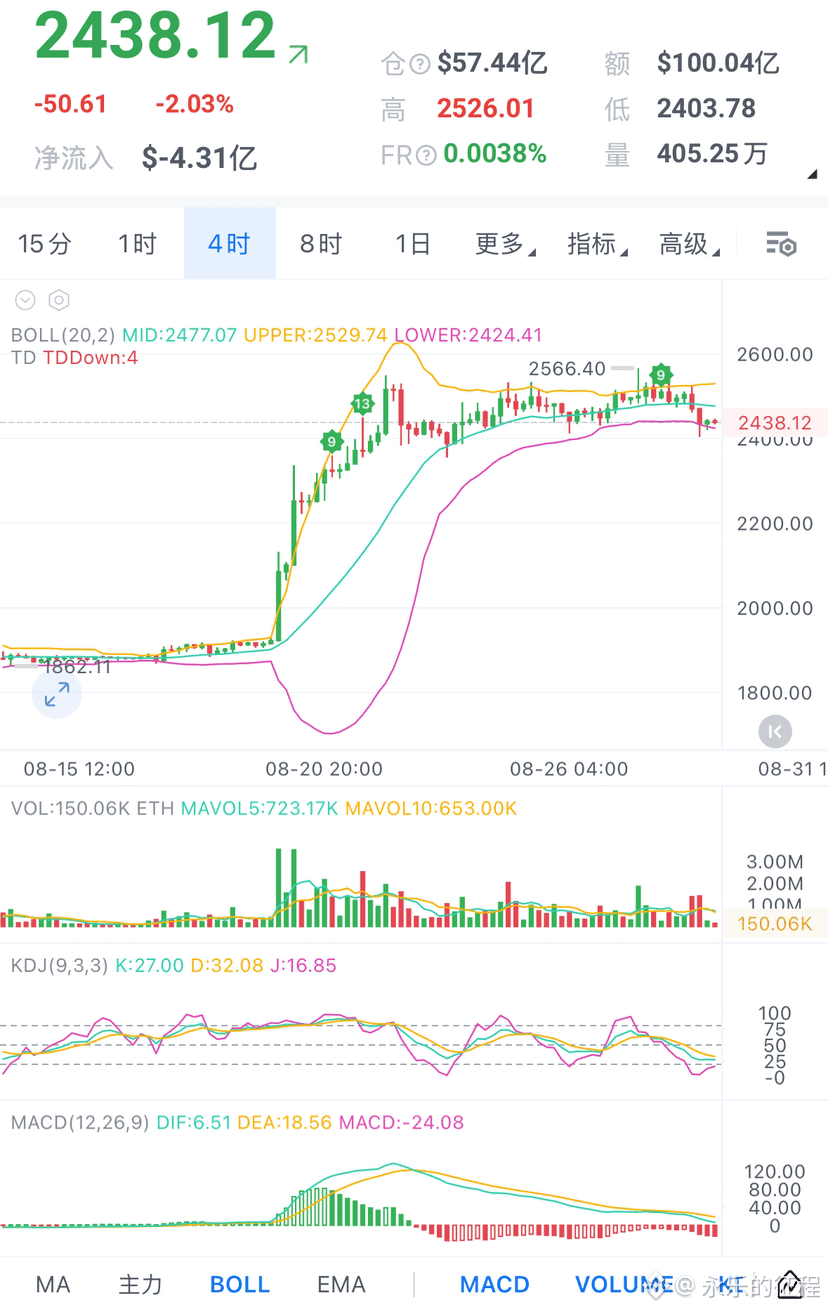
After ETH topped at 2566 in the high zone, it began a pullback. When the 4-hour chart broke below the Bollinger middle band at 2477, it signaled that this leg of the uptrend had ended on a phase basis. When the 1-hour chart simultaneously broke below 2460, the larger and smaller timeframes converged in weakness and the bearish trend officially began. The pullback cycle has not finished yet. On the 4-hour indicators, the MACD lines both turn downward and the green histogram bars continue to expand, showing that bearish momentum is still being released.
Even if a rebound appears later, it will only be a weak pullback. Unless the 2460–2477 resistance zone can successfully reclaim and hold above it, it will be difficult for the rebound to develop into a true reversal. During the weekend, expect range-bound movement. The first near-term support to watch is around 2424 on the smaller timeframe. If that support breaks, price is likely to keep falling and test the 2400 psychological level. Overhead resistance lies at 2477. Only if price can stand back above this level will the short-term downward momentum be disrupted. But based on current volume/energy, there isn’t enough to break through that area.
Ethereum reference: 2438 short, short-term target 2398#btc #ETH
Even if a rebound appears later, it will only be a weak pullback. Unless the 2460–2477 resistance zone can successfully reclaim and hold above it, it will be difficult for the rebound to develop into a true reversal. During the weekend, expect range-bound movement. The first near-term support to watch is around 2424 on the smaller timeframe. If that support breaks, price is likely to keep falling and test the 2400 psychological level. Overhead resistance lies at 2477. Only if price can stand back above this level will the short-term downward momentum be disrupted. But based on current volume/energy, there isn’t enough to break through that area.
Ethereum reference: 2438 short, short-term target 2398#btc #ETH