
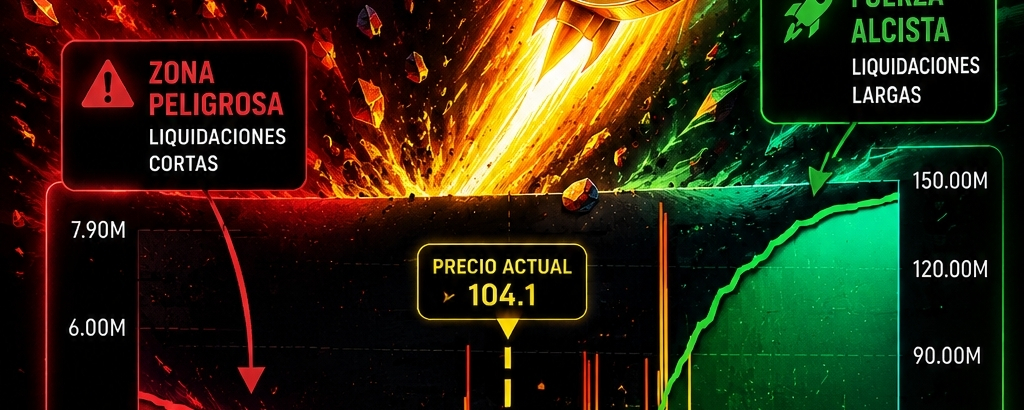

The current price appears close to 104
The most striking thing about the map is the enormous concentration of liquidations above the current price
The area between 105 and 110 shows a significant accumulation of liquidity, and the short liquidation curve increases very strongly
This means that if SOL manages to move strongly into those zones, a chain reaction of short position liquidations could be triggered, increasing buy-side pressure and accelerating the move
Below the current price, the accumulated liquidity appears much lower compared to above
Careful—this doesn’t mean that SOL necessarily will go up
It means the market has a considerable amount of liquidity waiting above the current price
And when there’s so much liquidity concentrated, a breakout with volume can generate very fast moves
SOL is right in front of a zone that can become fuel for an explosive move 🚀
The question isn’t only where SOL is going
The question is who gets trapped first
Bulls or bears
DYOR and always manage your risk