Newcomers to the market probably have heard that when RSI is below 30, it’s “oversold,” and that this is a good time to “pick up spot,” right? 👀 But beware of traps! Sometimes, when it looks oversold, people rush into trades, and then—before you know it—they end up “burning their account.”
Let’s make it easy to understand like this: imagine a bicycle rolling downhill without brakes. Even if it reaches the bottom of the slope (for example, RSI is oversold), if that downhill is still long and very slippery (the market is in a strong downtrend), then the bike will keep sliding for a while—there’s no instant rebound just because it hit the “bottom.” 💡 “Oversold” is only a *condition/state*, not an automated *buy signal*.
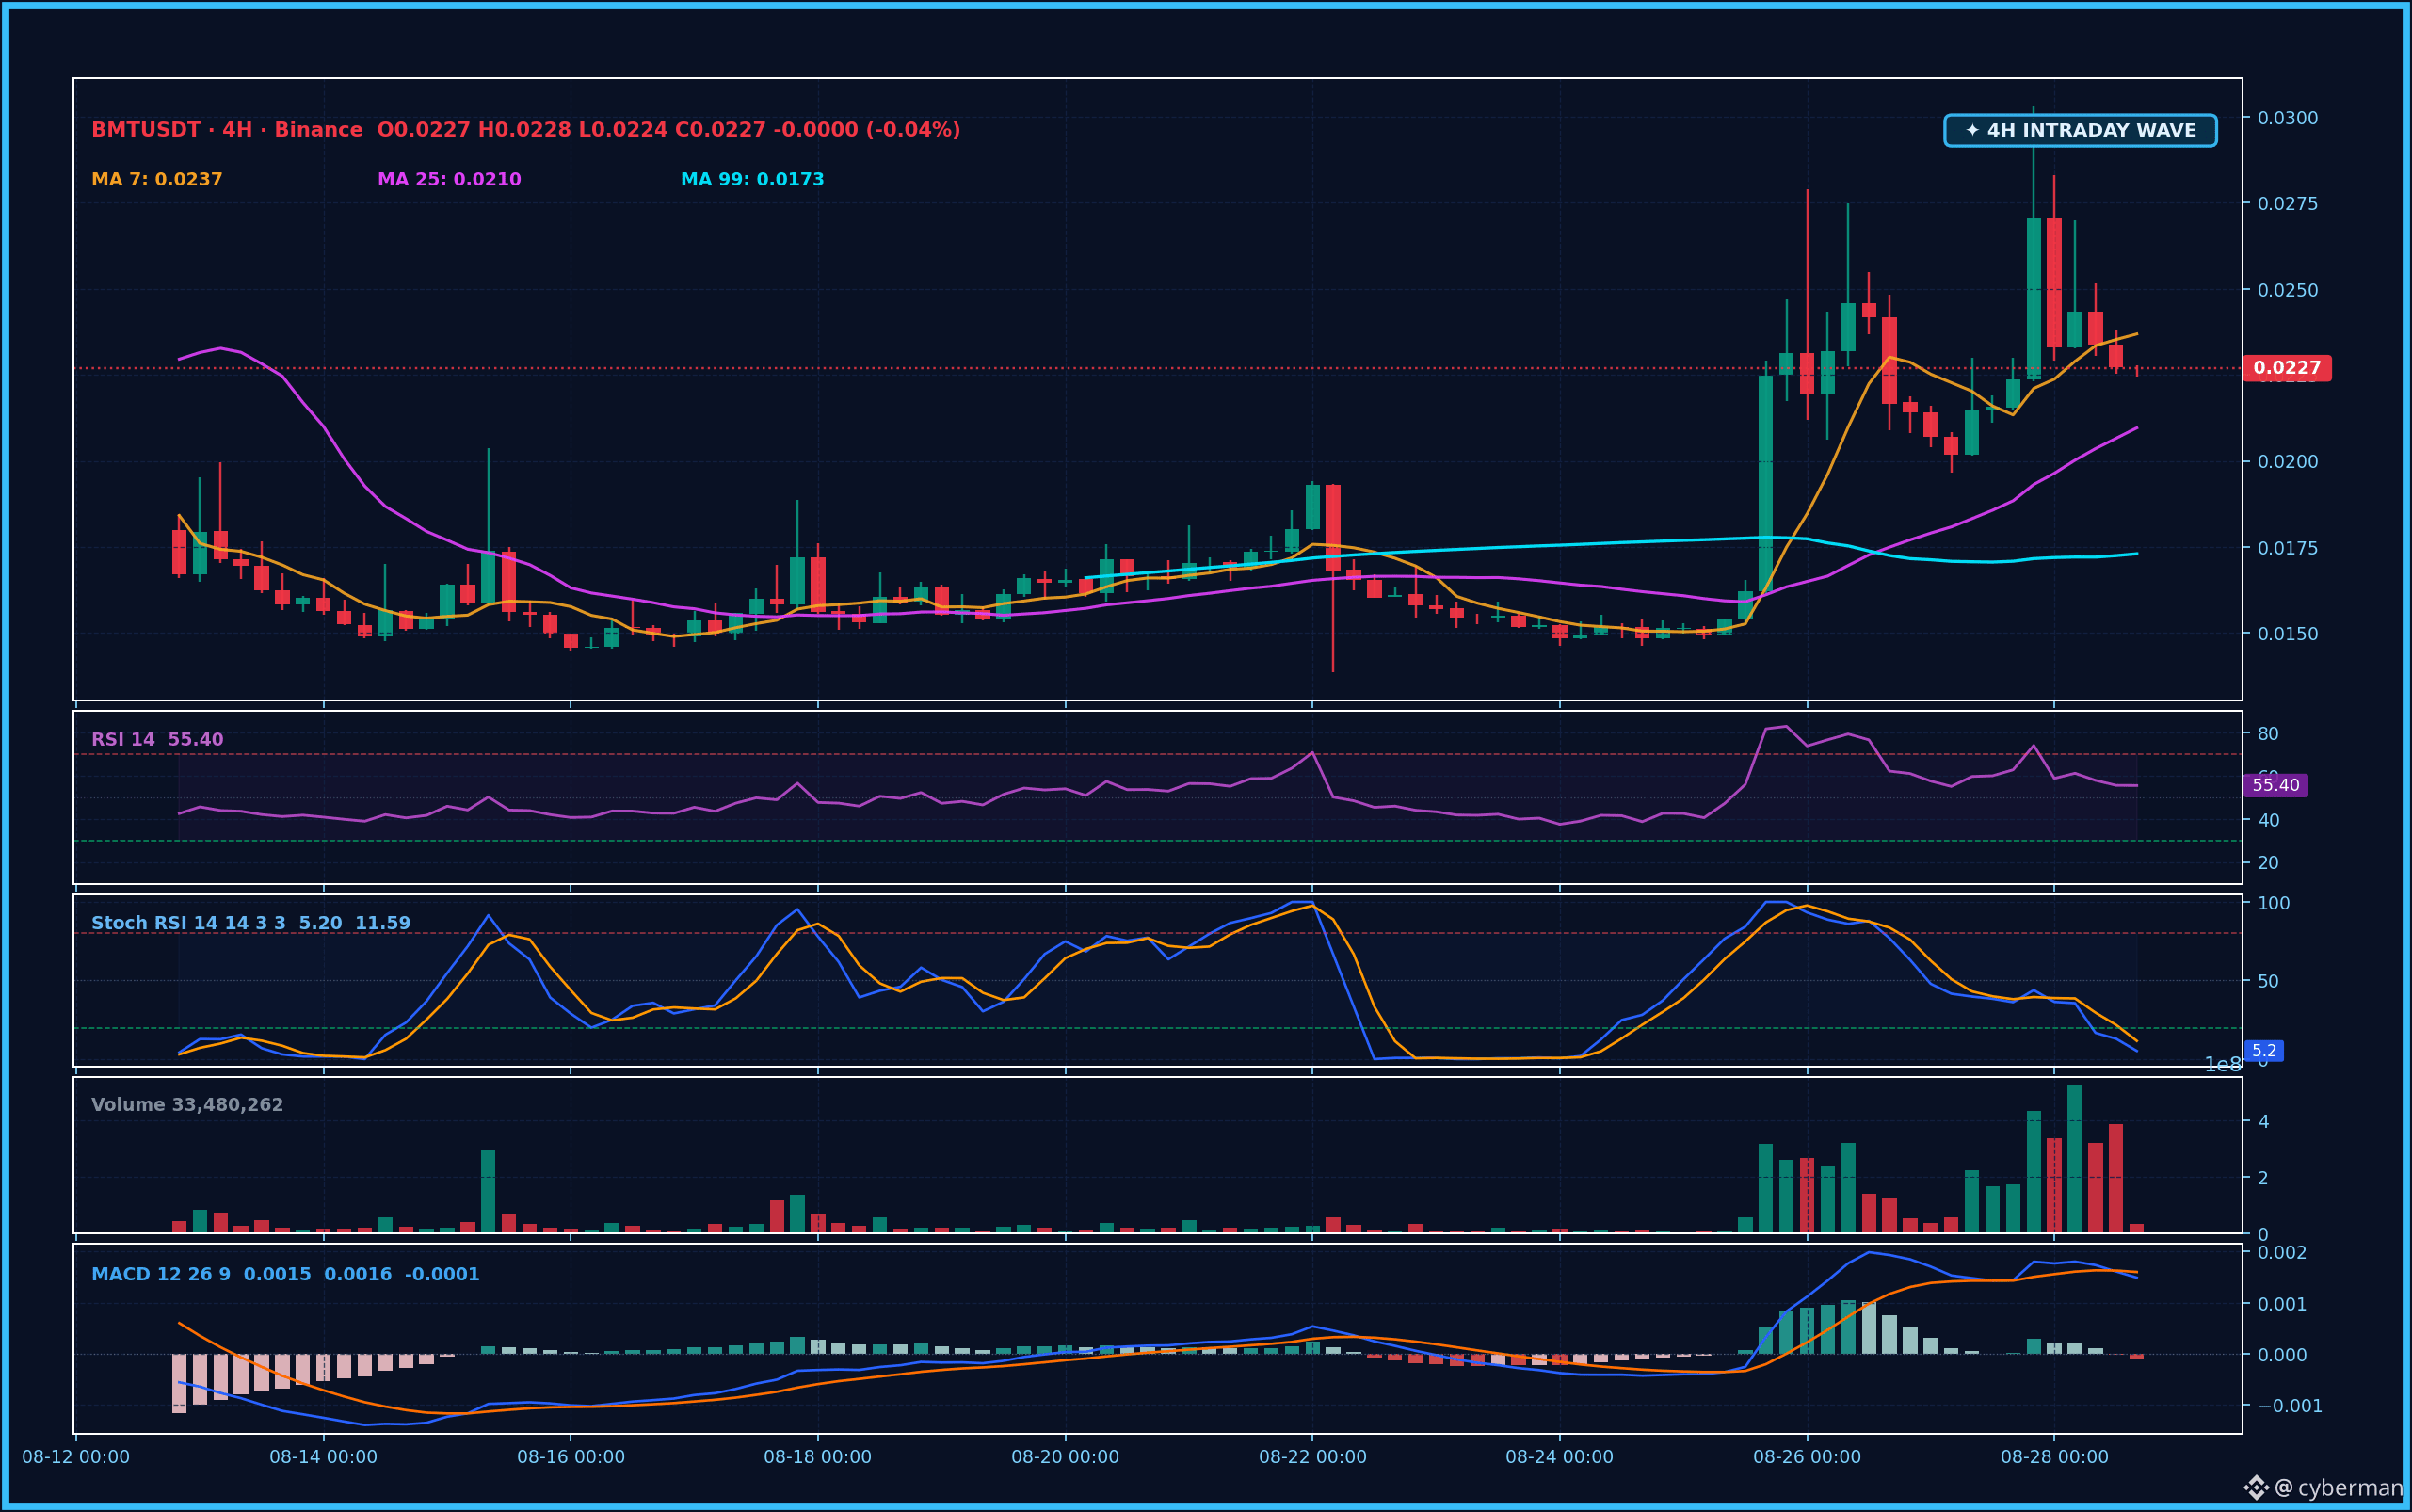
Now take a look at our chart $BMT . The price is at $0.02269, and the RSI (14) is 55.4—so it’s definitely not in any oversold zone. At the moment, $BMT is also holding above the moving averages (MA7 $0.0237, MA25 $0.021, MA99 $0.0173), which is a pretty healthy growth structure.
Let’s make it easy to understand like this: imagine a bicycle rolling downhill without brakes. Even if it reaches the bottom of the slope (for example, RSI is oversold), if that downhill is still long and very slippery (the market is in a strong downtrend), then the bike will keep sliding for a while—there’s no instant rebound just because it hit the “bottom.” 💡 “Oversold” is only a *condition/state*, not an automated *buy signal*.
Now take a look at our chart $BMT . The price is at $0.02269, and the RSI (14) is 55.4—so it’s definitely not in any oversold zone. At the moment, $BMT is also holding above the moving averages (MA7 $0.0237, MA25 $0.021, MA99 $0.0173), which is a pretty healthy growth structure.