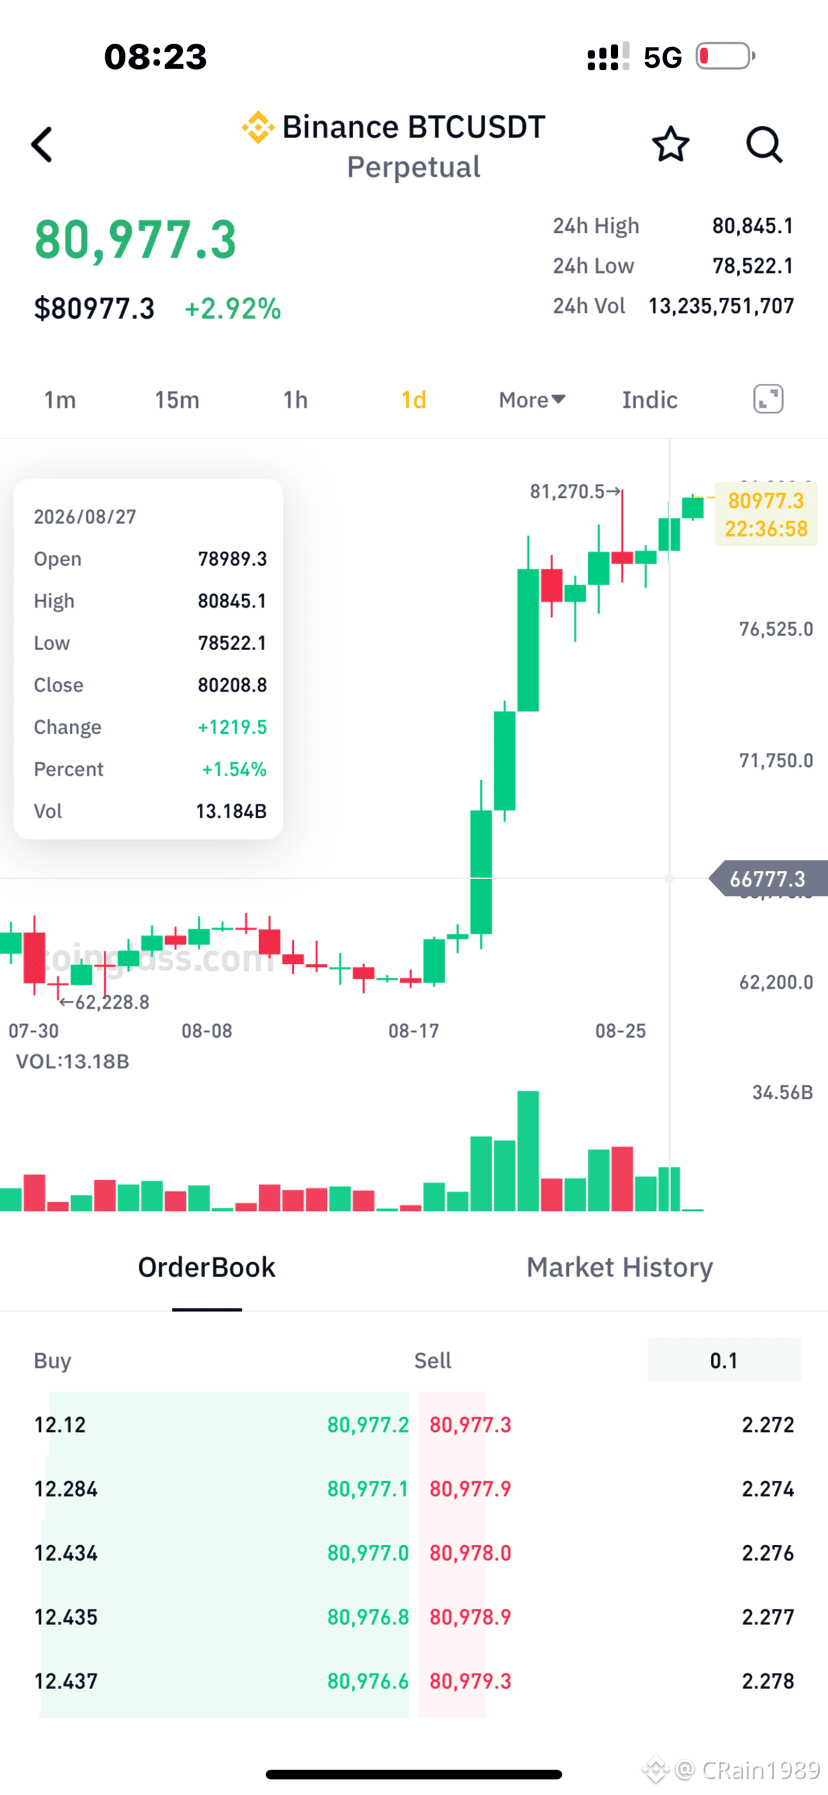
$BTC 28/8 :
- Still, bullish signals continue to appear after the signals decreased when the D-day chart level from 26/8 was broken starting yesterday.
- The chart is showing signs of indicator divergence when the indicators are at very high levels (they need to come down while price keeps rising).
- For those taking Shorts, you should be patient and wait for a drop signal to appear. The likelihood is it will be early next week after BTC forms a new peak.
- As for Long trades, I still think you should do short-term swings, but you must identify the STL zones and clearly understand the candle structure.
- Still, bullish signals continue to appear after the signals decreased when the D-day chart level from 26/8 was broken starting yesterday.
- The chart is showing signs of indicator divergence when the indicators are at very high levels (they need to come down while price keeps rising).
- For those taking Shorts, you should be patient and wait for a drop signal to appear. The likelihood is it will be early next week after BTC forms a new peak.
- As for Long trades, I still think you should do short-term swings, but you must identify the STL zones and clearly understand the candle structure.