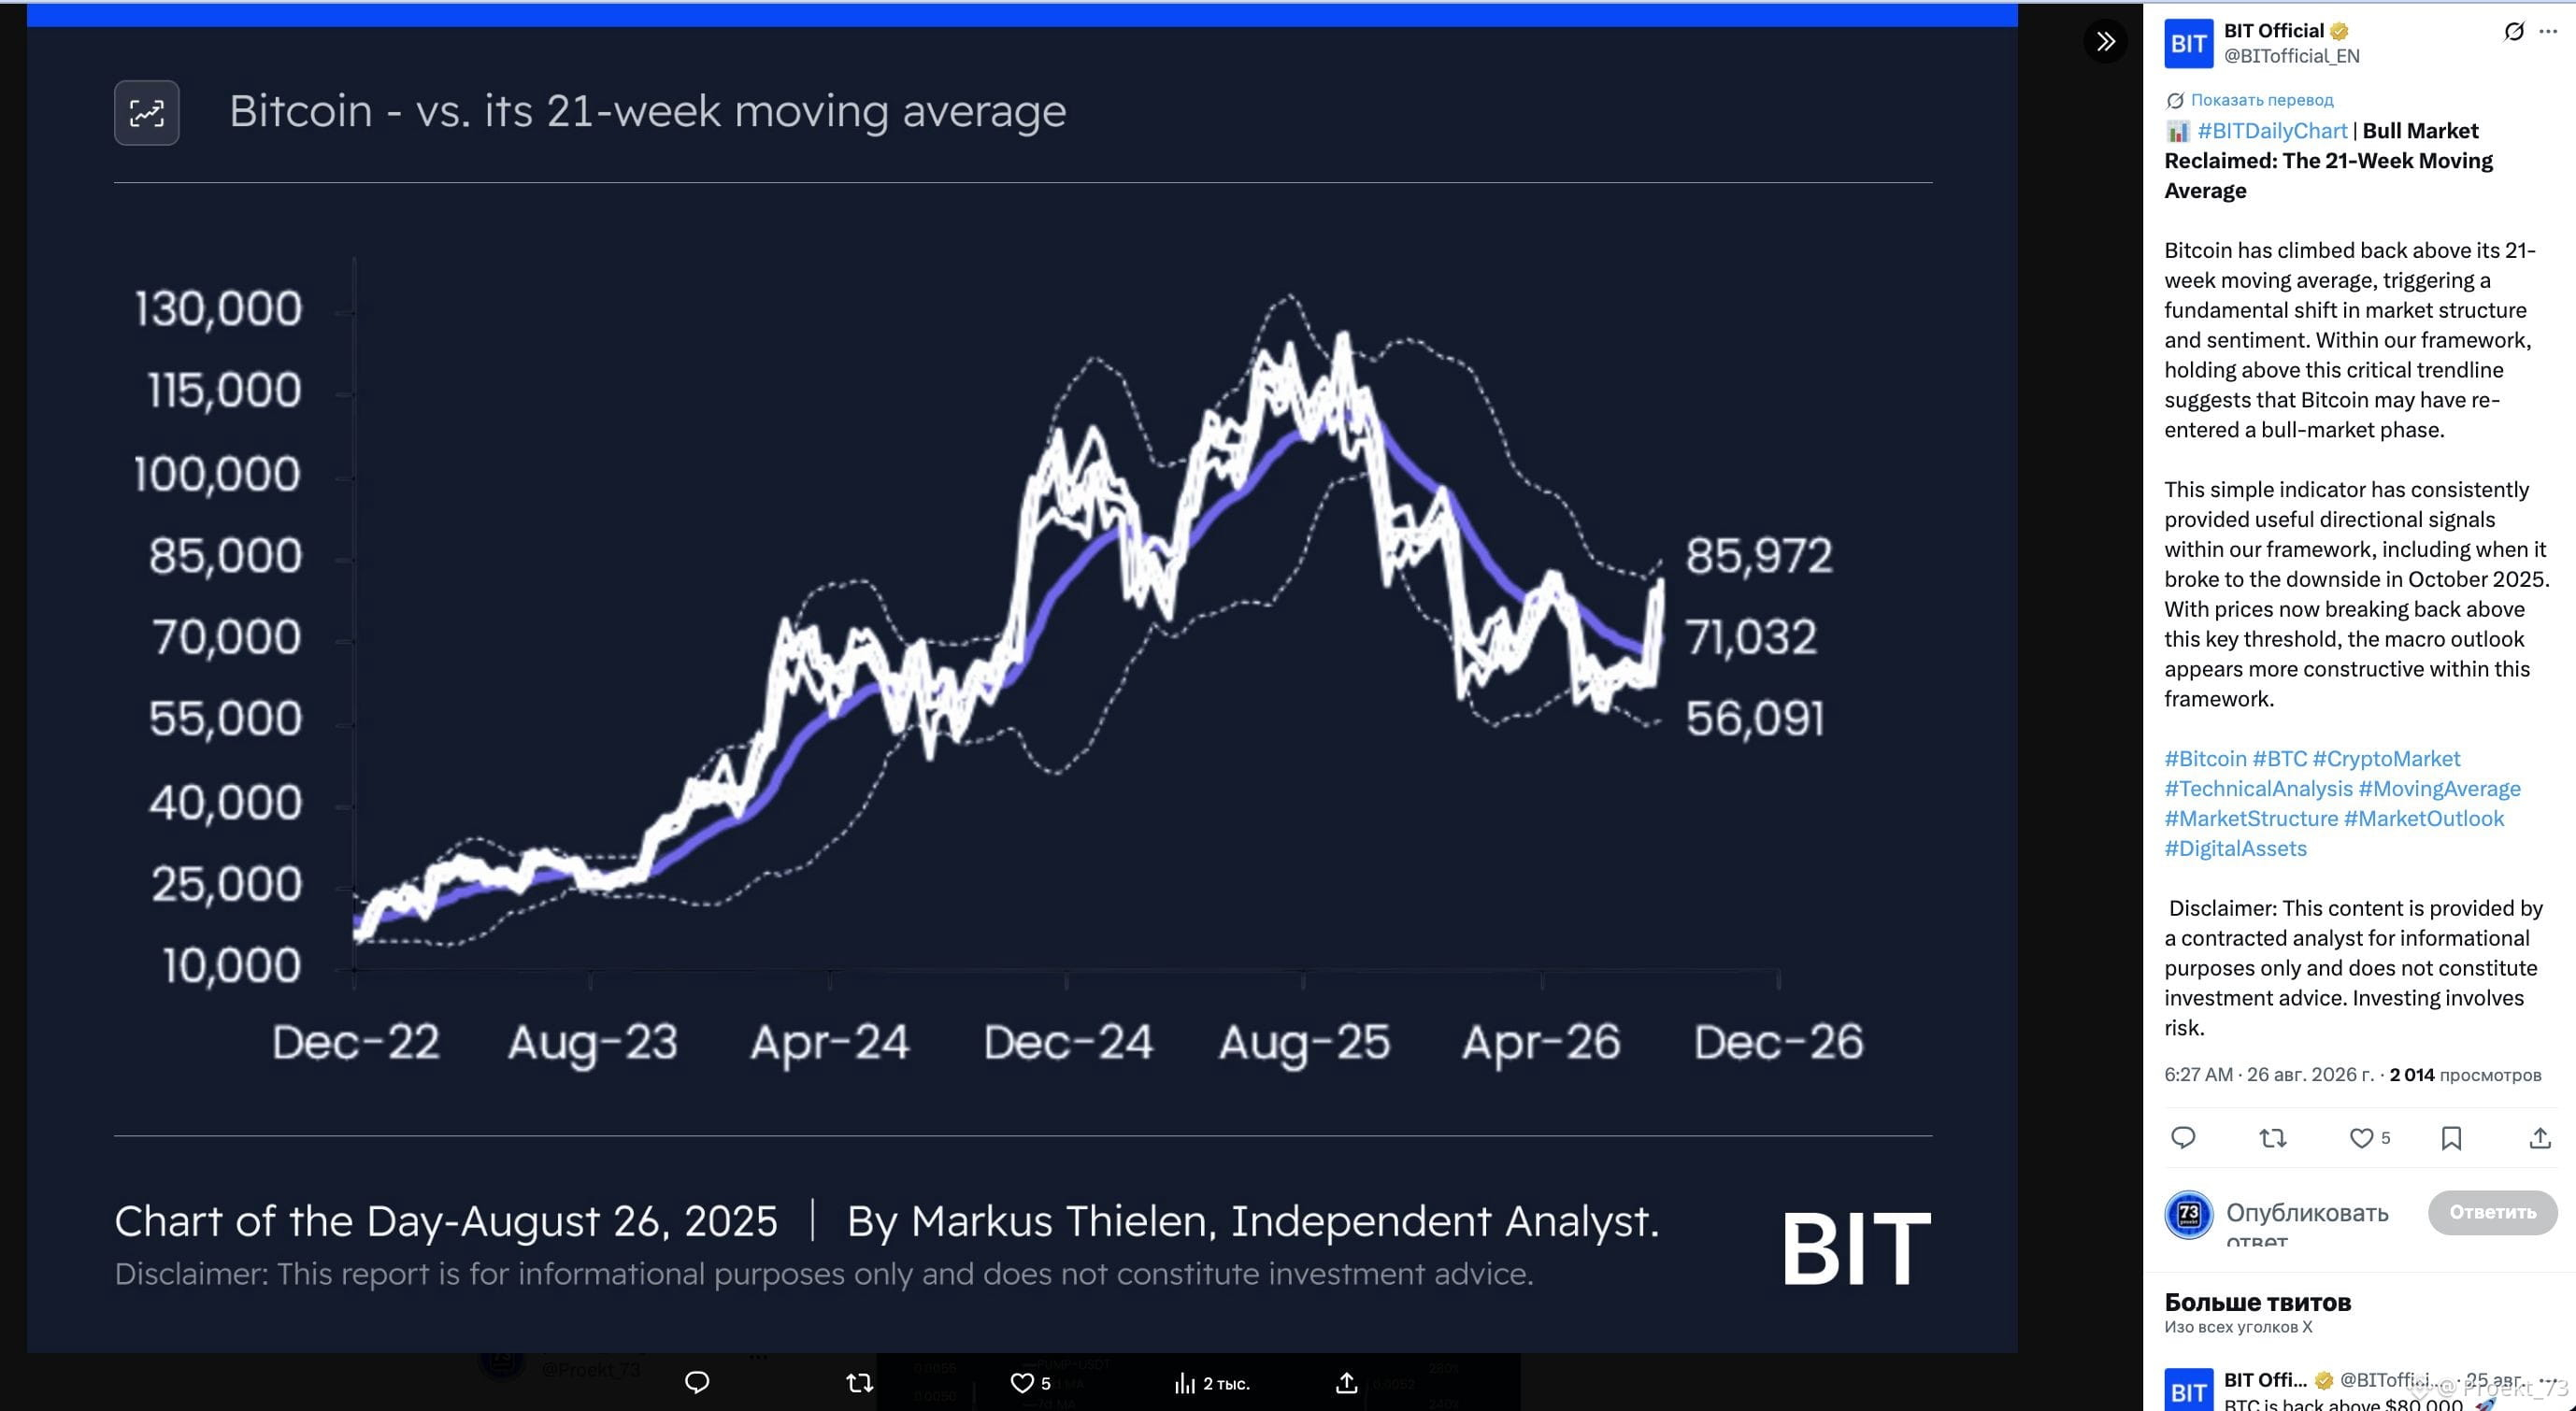
BTC has returned above the 21-week moving average. BIT analysts consider this an important confirmation of a bullish market structure returning.
Right now, the 21-week average is around $71,000, and #BTC has consolidated above it.
For BIT, this level is one of the key cycle benchmarks:
- in October 2025, a break below the 21-week moving average confirmed the transition to a bearish phase;
- now BTC has, for the first time, firmly returned above it.
The chart also marks the current range boundaries:
- the upper level — about $85,970;
- the 21-week moving average — about $71,030;
- the lower level — about $56,090.
In #BIT’s view, as long as BTC remains above $71,000, the market structure looks significantly more constructive and aligns with the scenario of a return to the bullish phase.
The next important zone is in the area of $86,000. A move back below the 21-week moving average will again put this signal into question.
For now, we’re waiting for at least a retest of the moving average break. But the question is whether there will be an update of the pump highs, or not.
Right now, the 21-week average is around $71,000, and #BTC has consolidated above it.
For BIT, this level is one of the key cycle benchmarks:
- in October 2025, a break below the 21-week moving average confirmed the transition to a bearish phase;
- now BTC has, for the first time, firmly returned above it.
The chart also marks the current range boundaries:
- the upper level — about $85,970;
- the 21-week moving average — about $71,030;
- the lower level — about $56,090.
In #BIT’s view, as long as BTC remains above $71,000, the market structure looks significantly more constructive and aligns with the scenario of a return to the bullish phase.
The next important zone is in the area of $86,000. A move back below the 21-week moving average will again put this signal into question.
For now, we’re waiting for at least a retest of the moving average break. But the question is whether there will be an update of the pump highs, or not.