
$BTC current price 79539, 24h +1.08%, trading volume about 12.11 billion USDT (24h quote volume 12,106,134,277)
That long needle from the day before that pierced down to 81270, and yesterday’s pullback that digested to 77808—today the market swallowed it back with a solid-bodied bullish candle. Current price 79539: during the day it was pushed from the low 77600 all the way up to the high 80499.9, then closed back at 79539. Up 1.08%, volume 12.1 billion USDT—slightly less than yesterday’s 12.7 billion, but price has already engulfed yesterday’s bearish candle. Bulls aren’t dead; they just changed tempo from “surge” to “grind the top.”
📊 Technical analysis
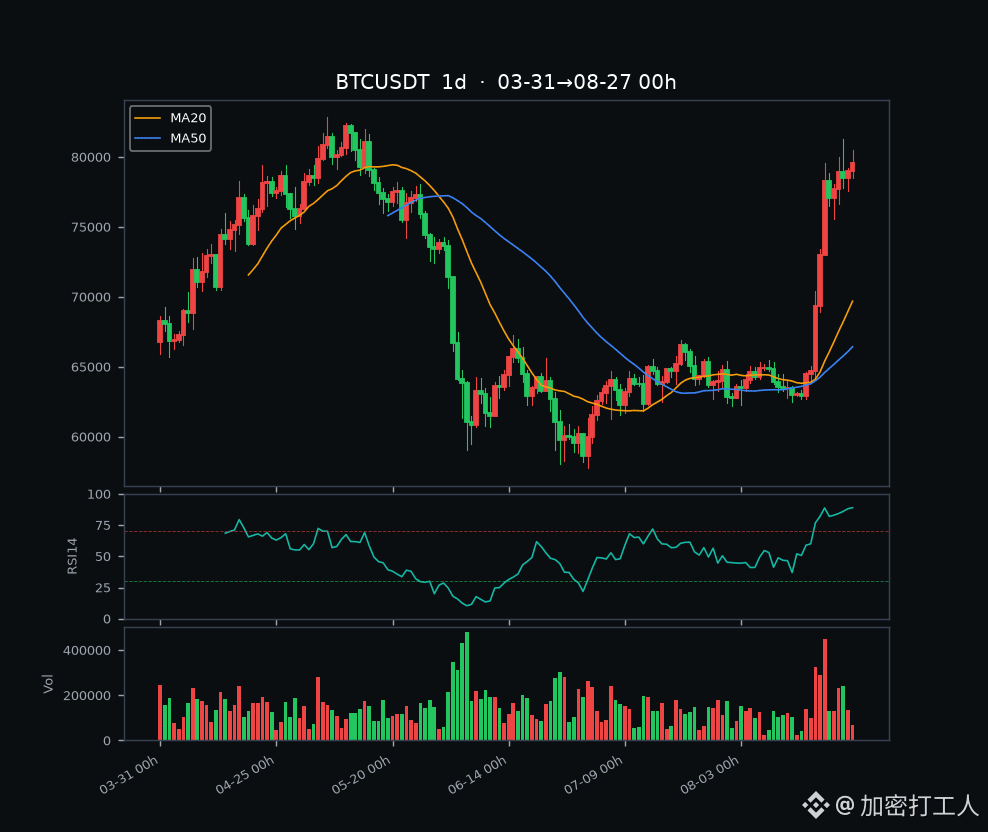
The three timeframes are currently a twisted combination of “daily extreme overbought + 4h hasn’t cooled off yet + 1h repairs ahead of schedule.” The daily close is 79542. MA7 (78443) / MA25 (68607) / MA50 (66431) are all still far below by more than 10,000 dollars. The structure remains bullish, but RSI14 is up to 88.9, hugging the 90-day ceiling from the 08-25 day. When daily RSI is around 89 like this, historically it’s an extreme zone: price can still push higher, but “a single needle can cut through”—it’s not a chase spot; it’s where holders look to take profit. MACD red histogram +1262 is still wide open; the medium-term bulls haven’t collapsed, but overbought itself is the biggest risk.
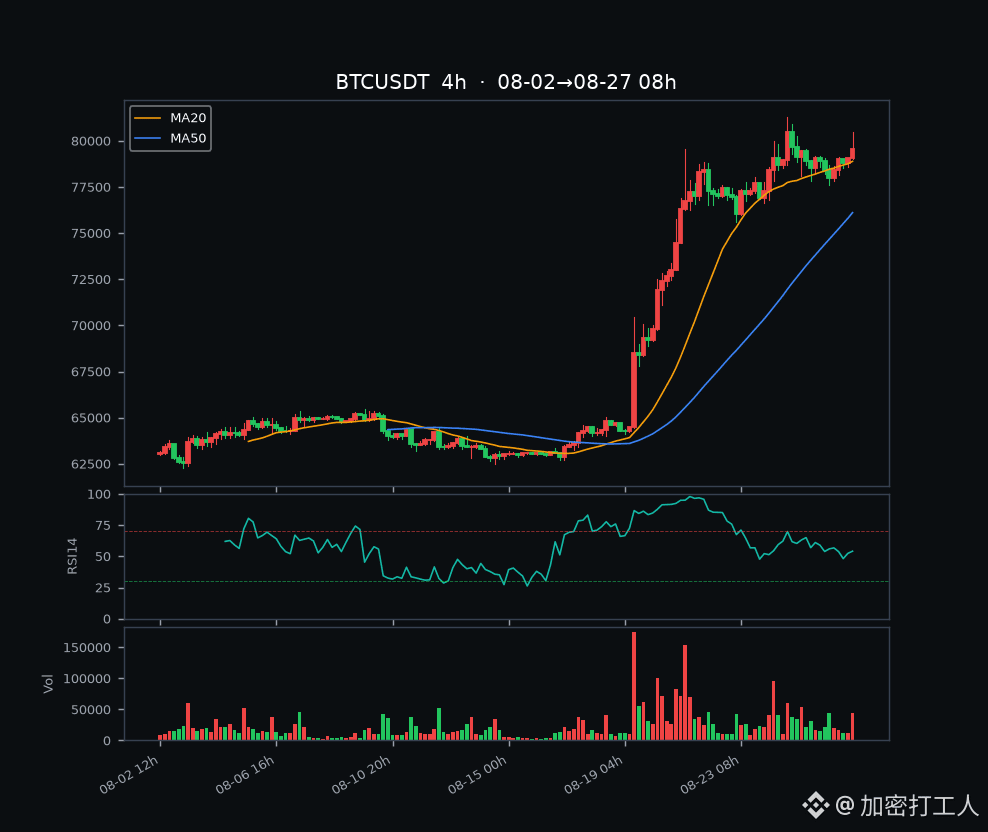
The 4h close is 79551, and RSI14 actually dropped to 42.7, even lower than yesterday’s 61. MACD dif(814) is still below dea(1029), with a green histogram of -215—on the 4h level, it hasn’t recovered from the needle at 81270. Over the past ~20 swings, the range is 76649–81270; that overhead 81270 “iron roof” hasn’t moved.
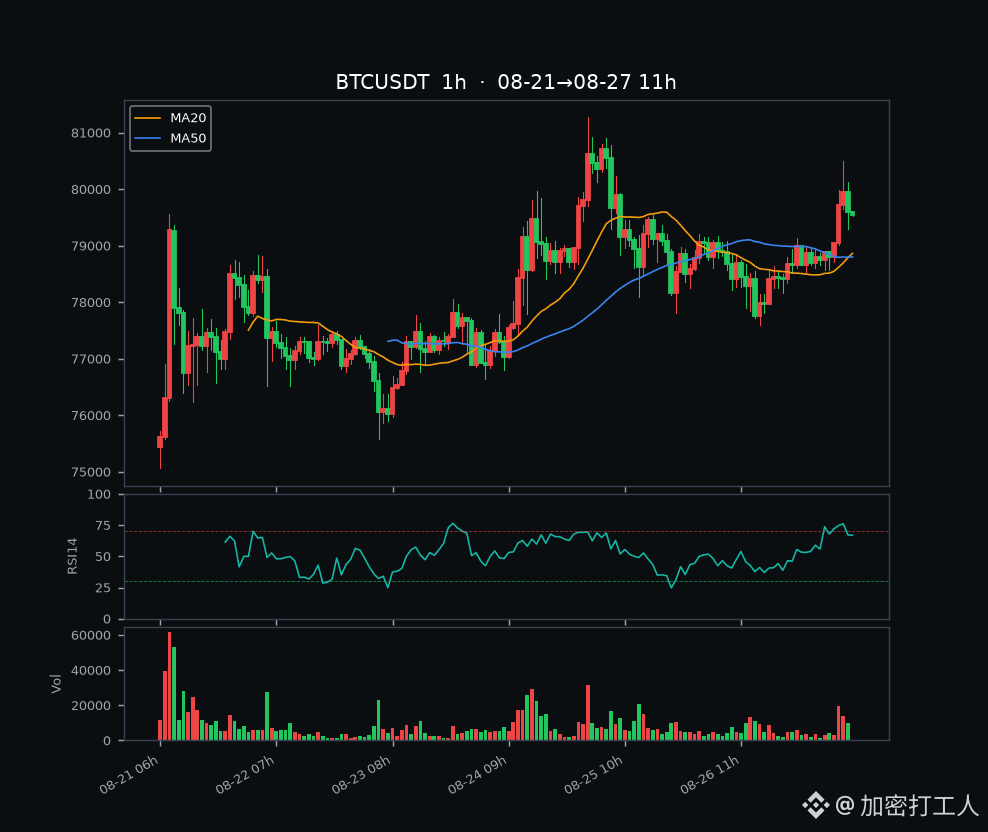
The 1h setup is the strongest: it closed at 79542, and MA7(79366) / MA25(78727) / MA50(78802) are all back above the average lines. RSI14 at 64 is neutral-to-strong. MACD dif(248) has just crossed above dea(127), and the red histogram turns to +120—hourly is a solid bull repair. This rally from the 77812 low was volume-backed. In one sentence: the 1h is running ahead, the 4h is still catching its breath, and the daily is hovering in an extreme zone.
Key levels written in stone: 80499.9 above (today’s 24h high) is the first hurdle—tap it and pull back; only if it truly stands above will we acknowledge 81270.5 (previous high) as the next target. Until this 81270.5 iron roof is reclaimed, this move should first be read as “distribution in a high range,” not a new major upswing.
Below: 79366 (1h MA7) / 78727 (1h MA25) are the first support band for the short term—pullbacks that don’t break can grind. 78443 (daily MA7) is the bulls’ lifeline: if it breaks, short-term weakens. If 77600 (today’s low) breaks again, it heads toward 76649 (the 4h near-20 low). 76108 (4h MA50) is the stronger line of defense.
💧 Derivatives & sentiment
Today’s derivatives data show one clear anomaly: the top trader long/short ratio dropped sharply from yesterday’s 2.18 (longs 68.6%) to 1.1066 (longs 52.5%). After the whales and big players surged into the 81270 area, they cut longs aggressively, moving close to neutral. This matches a completely different posture than the previous two days of “stubborn net-long holding.”
Open positions at 105,420 BTC (about 8.38 billion USDT) are basically the same as yesterday’s 105,356. Price is up while OI doesn’t move—this suggests the rebound isn’t a fresh surge by new longs, but rather short covering plus rolling over old positions. Funding rate is still 0.0001 (8h, daily annualized +0.03%), capped at the top, but with big players cutting net longs by half, the capped funding is more inertia than sheer euphoria.
The taker buy/sell ratio is 1.0052 (positive) — yesterday’s 0.86 was sell-dominant for active orders. Active buying is back. The global long/short ratio is 1.0309 (longs 50.8%), and retail is also close to a 50/50 split. Fear&Greed 71 (Greed), up from yesterday’s 65. This set of signals is very typical and “messy” in exactly this way: smart money (big players) is reducing longs, while the crowd and active orders are taking the other side. Combined with the daily RSI at 89, it fits the classic top-picking divergence script.
📰 News
The real-time news feed channel won’t work tonight (data source rate limits / paid subscription needed, so no direct hard catalyst lines for BTC can be pulled). I won’t invent events. The precise daily net ETF flow value can’t be obtained from an open channel, so I won’t make it up—but the two signals, OI staying flat and big players cutting net longs by half, align with the assessment that “the rebound is driven by turnover, without a flood of incremental capital.” On the macro side, there’s no major high-impact data tonight; sentiment follows the crypto price.
👉 My view
Read the short term as “a second topping attempt after the 77808 pullback was engulfed”: the 1h bull repair is very sharp, but the 4h momentum hasn’t caught up yet, and daily RSI at 89 is a clearly marked mine. Until the 81270.5 iron roof is reclaimed with volume, I won’t treat this as a new major upswing. If you’re holding positions, place stops below 78443 (daily MA7). If it breaks, treat it as short-weak and exit first. If you’re not in a position, don’t chase at 79539—wait for two signals: either pull back to 78727–79366 without breaking and then stabilize with a light entry, or reclaim 80499.9 with volume and with the 4h RSI closing back above 50 to confirm the move toward 81270.
For the medium term, the structure is still somewhat bullish (daily MA bullish, MACD red histogram not collapsed), but every step up above 80000 must guard against needles (sharp wicks). Keep position sizing small—don’t get carried away in the extreme zone at RSI 89.
Resistance: 80499.9 / 81270.5; Support: 79366 / 78727 / 78443 / 77600 / 76649.
For reference only; not investment advice
$BTC $ETH #BTC #行情分析 #合约 #macro
That long needle from the day before that pierced down to 81270, and yesterday’s pullback that digested to 77808—today the market swallowed it back with a solid-bodied bullish candle. Current price 79539: during the day it was pushed from the low 77600 all the way up to the high 80499.9, then closed back at 79539. Up 1.08%, volume 12.1 billion USDT—slightly less than yesterday’s 12.7 billion, but price has already engulfed yesterday’s bearish candle. Bulls aren’t dead; they just changed tempo from “surge” to “grind the top.”
📊 Technical analysis
The three timeframes are currently a twisted combination of “daily extreme overbought + 4h hasn’t cooled off yet + 1h repairs ahead of schedule.” The daily close is 79542. MA7 (78443) / MA25 (68607) / MA50 (66431) are all still far below by more than 10,000 dollars. The structure remains bullish, but RSI14 is up to 88.9, hugging the 90-day ceiling from the 08-25 day. When daily RSI is around 89 like this, historically it’s an extreme zone: price can still push higher, but “a single needle can cut through”—it’s not a chase spot; it’s where holders look to take profit. MACD red histogram +1262 is still wide open; the medium-term bulls haven’t collapsed, but overbought itself is the biggest risk.
The 4h close is 79551, and RSI14 actually dropped to 42.7, even lower than yesterday’s 61. MACD dif(814) is still below dea(1029), with a green histogram of -215—on the 4h level, it hasn’t recovered from the needle at 81270. Over the past ~20 swings, the range is 76649–81270; that overhead 81270 “iron roof” hasn’t moved.
The 1h setup is the strongest: it closed at 79542, and MA7(79366) / MA25(78727) / MA50(78802) are all back above the average lines. RSI14 at 64 is neutral-to-strong. MACD dif(248) has just crossed above dea(127), and the red histogram turns to +120—hourly is a solid bull repair. This rally from the 77812 low was volume-backed. In one sentence: the 1h is running ahead, the 4h is still catching its breath, and the daily is hovering in an extreme zone.
Key levels written in stone: 80499.9 above (today’s 24h high) is the first hurdle—tap it and pull back; only if it truly stands above will we acknowledge 81270.5 (previous high) as the next target. Until this 81270.5 iron roof is reclaimed, this move should first be read as “distribution in a high range,” not a new major upswing.
Below: 79366 (1h MA7) / 78727 (1h MA25) are the first support band for the short term—pullbacks that don’t break can grind. 78443 (daily MA7) is the bulls’ lifeline: if it breaks, short-term weakens. If 77600 (today’s low) breaks again, it heads toward 76649 (the 4h near-20 low). 76108 (4h MA50) is the stronger line of defense.
💧 Derivatives & sentiment
Today’s derivatives data show one clear anomaly: the top trader long/short ratio dropped sharply from yesterday’s 2.18 (longs 68.6%) to 1.1066 (longs 52.5%). After the whales and big players surged into the 81270 area, they cut longs aggressively, moving close to neutral. This matches a completely different posture than the previous two days of “stubborn net-long holding.”
Open positions at 105,420 BTC (about 8.38 billion USDT) are basically the same as yesterday’s 105,356. Price is up while OI doesn’t move—this suggests the rebound isn’t a fresh surge by new longs, but rather short covering plus rolling over old positions. Funding rate is still 0.0001 (8h, daily annualized +0.03%), capped at the top, but with big players cutting net longs by half, the capped funding is more inertia than sheer euphoria.
The taker buy/sell ratio is 1.0052 (positive) — yesterday’s 0.86 was sell-dominant for active orders. Active buying is back. The global long/short ratio is 1.0309 (longs 50.8%), and retail is also close to a 50/50 split. Fear&Greed 71 (Greed), up from yesterday’s 65. This set of signals is very typical and “messy” in exactly this way: smart money (big players) is reducing longs, while the crowd and active orders are taking the other side. Combined with the daily RSI at 89, it fits the classic top-picking divergence script.
📰 News
The real-time news feed channel won’t work tonight (data source rate limits / paid subscription needed, so no direct hard catalyst lines for BTC can be pulled). I won’t invent events. The precise daily net ETF flow value can’t be obtained from an open channel, so I won’t make it up—but the two signals, OI staying flat and big players cutting net longs by half, align with the assessment that “the rebound is driven by turnover, without a flood of incremental capital.” On the macro side, there’s no major high-impact data tonight; sentiment follows the crypto price.
👉 My view
Read the short term as “a second topping attempt after the 77808 pullback was engulfed”: the 1h bull repair is very sharp, but the 4h momentum hasn’t caught up yet, and daily RSI at 89 is a clearly marked mine. Until the 81270.5 iron roof is reclaimed with volume, I won’t treat this as a new major upswing. If you’re holding positions, place stops below 78443 (daily MA7). If it breaks, treat it as short-weak and exit first. If you’re not in a position, don’t chase at 79539—wait for two signals: either pull back to 78727–79366 without breaking and then stabilize with a light entry, or reclaim 80499.9 with volume and with the 4h RSI closing back above 50 to confirm the move toward 81270.
For the medium term, the structure is still somewhat bullish (daily MA bullish, MACD red histogram not collapsed), but every step up above 80000 must guard against needles (sharp wicks). Keep position sizing small—don’t get carried away in the extreme zone at RSI 89.
Resistance: 80499.9 / 81270.5; Support: 79366 / 78727 / 78443 / 77600 / 76649.
For reference only; not investment advice
$BTC $ETH #BTC #行情分析 #合约 #macro