


Bitcoin may be approaching an inflection point, not because price has confirmed a new uptrend, but because two regime indicators are beginning to align beneath the surface.
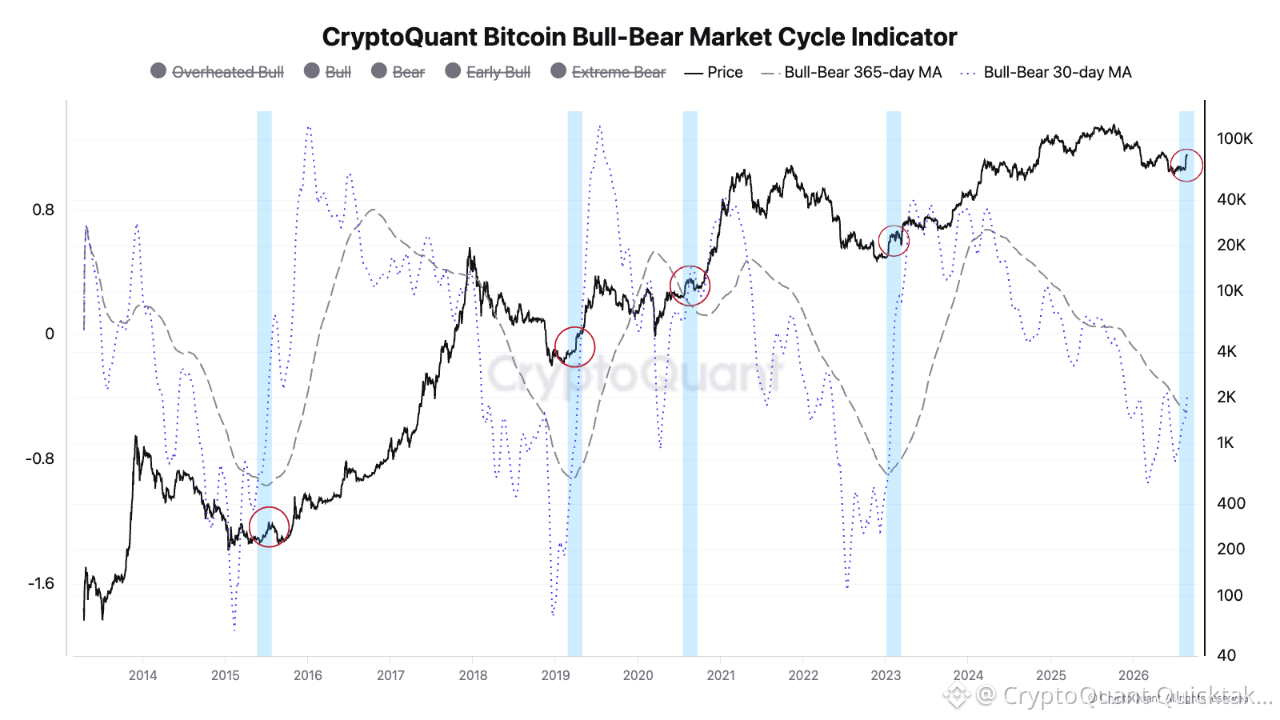
The Bull–Bear Market Cycle Indicator is showing a familiar transition. Its 30-day moving average is turning sharply higher and moving back above the 365-day average.
Comparable crossovers appeared around the 2015, 2019, 2020 and 2023 recovery phases, when bearish momentum had peaked and the market was shifting from capitulation toward repair. The signal is less about calling the exact bottom than identifying a change in investor profitability: losses stop deepening, demand absorbs supply and sentiment begins to recover.
Persistence is essential. The crossover becomes credible only if spot demand, liquidity and bullish sentiment remain supportive.
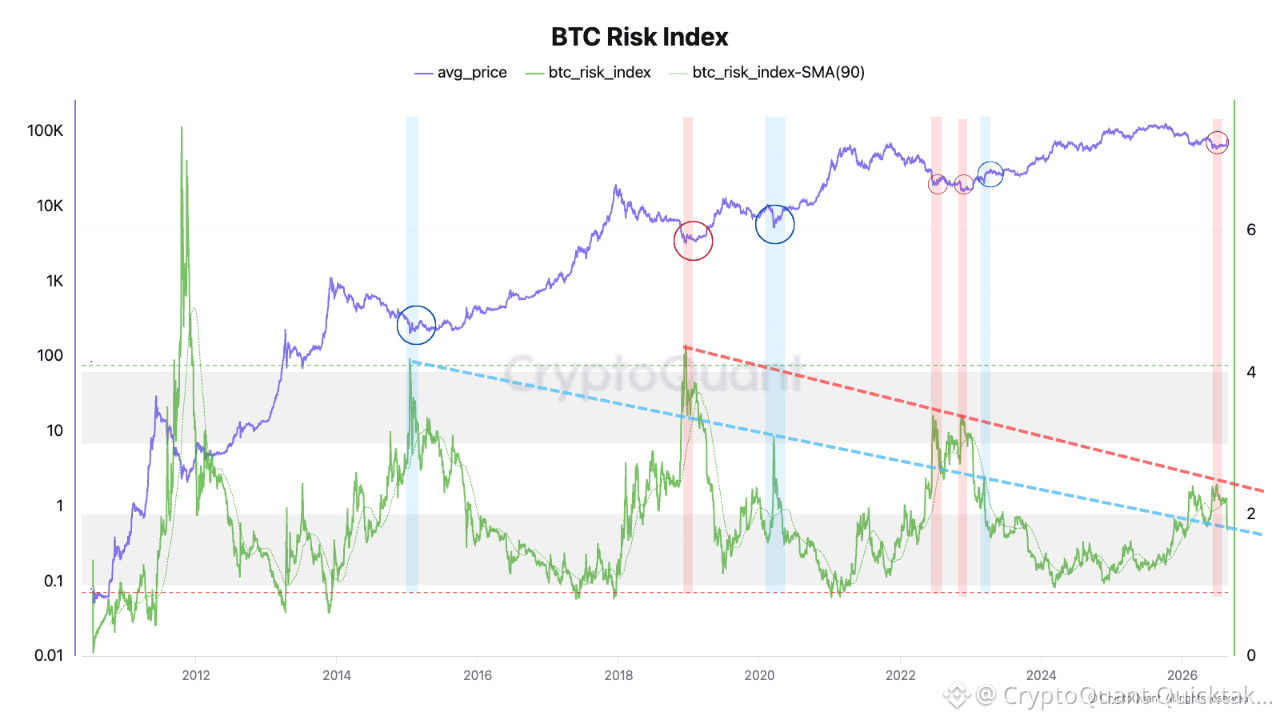
The BTC Risk Index adds the second layer.
The key signal is not simply that the index increased, but where that advance stopped. It recently reached the descending trendline around which major stress peaks and local Bitcoin floors have repeatedly formed. Historically, these contacts have produced attractive risk-reward conditions because fear and selling pressure were already elevated, weaker positions had been flushed out and much of the potential downside had already been absorbed.
More importantly, the Risk Index has now begun to move lower after touching that boundary.
Within this framework, a falling index represents a release of market stress rather than a deterioration in opportunity. Previous declines from this descending resistance have generally coincided with higher Bitcoin prices, renewed appetite for risk and a broader transition back toward a risk-on environment.
We appear to be entering a period in which conditions are beginning to stabilize, with the first green shoots of improvement becoming visible. This does not mean that a new trend has already begun, nor does it rule out further declines or corrective moves in price.
Written by MorenoDV_