#链上指标分析
Bitcoin: Profit/Loss Supply Ratio (excluding >7Y)
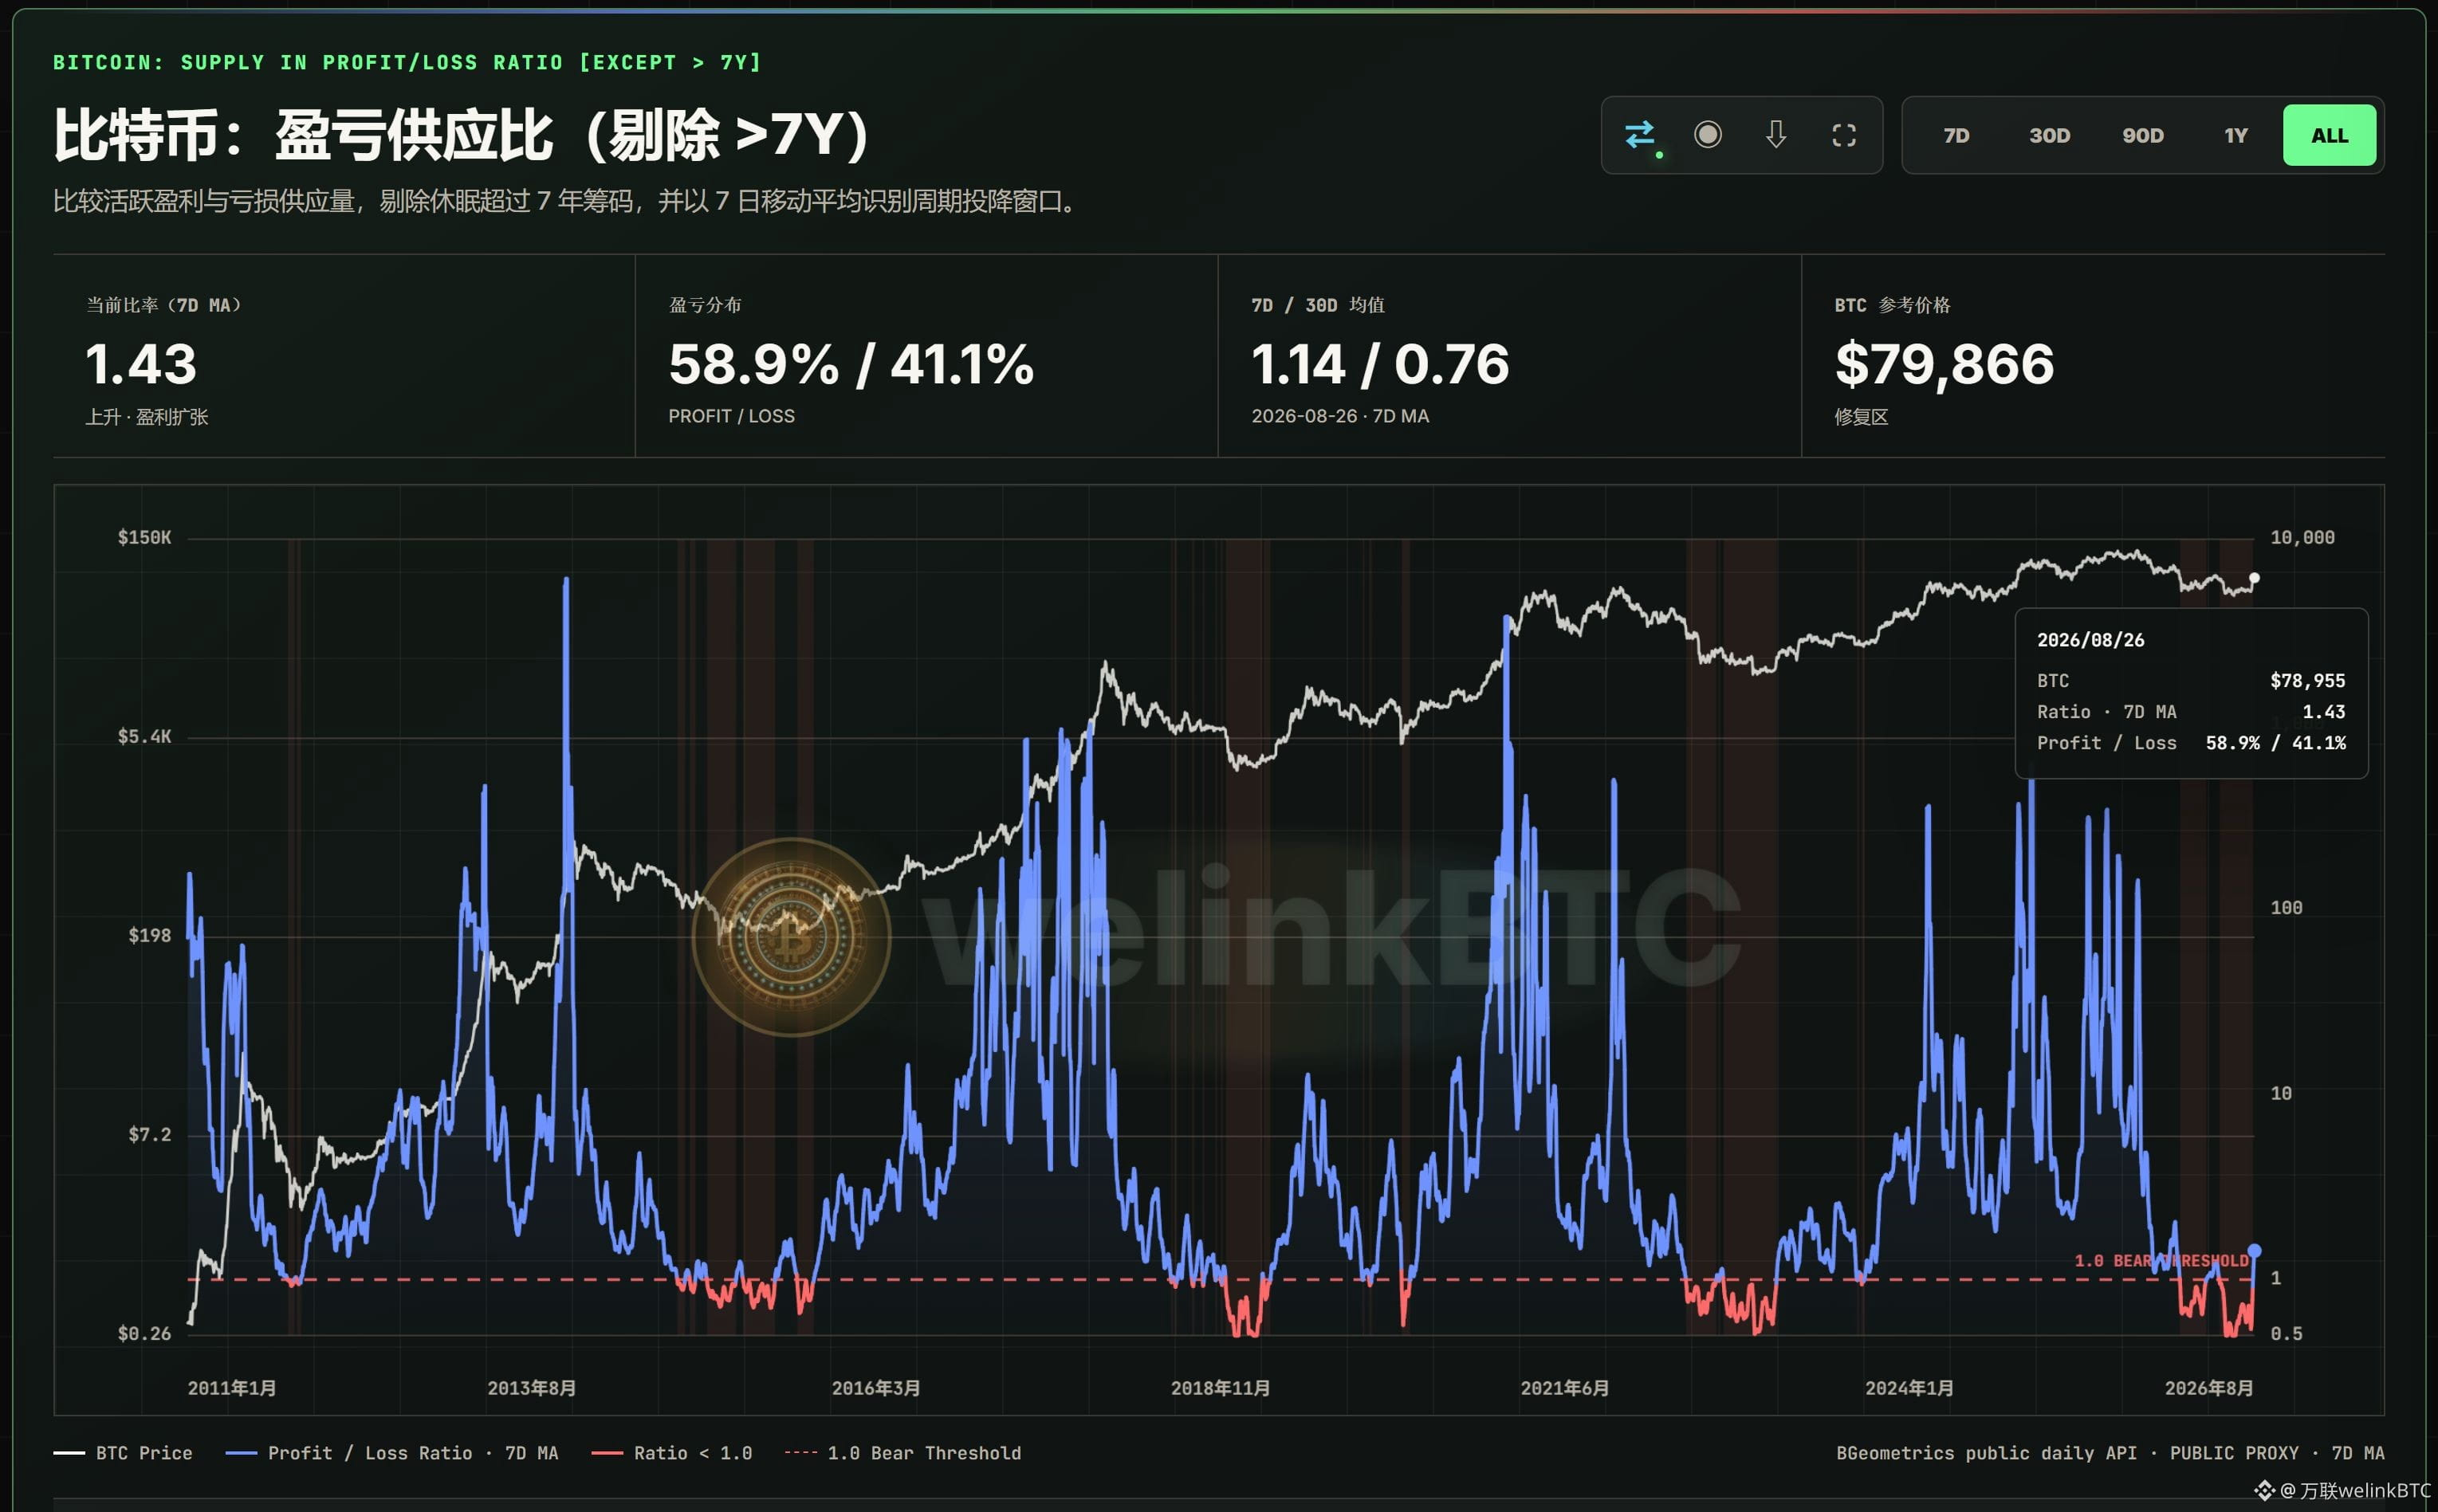
Current ratio (7D MA) 1.43
Has exceeded the 1.0 alert threshold
In an upward phase · Profit expansion
Bitcoin: Profit/Loss Supply Ratio (excluding >7Y)
Compares the more active profit supply with loss supply, excludes dormant coins older than 7 years, and identifies the capitulation window using a 7-day moving average of the period.
Active supply profit/loss status recovery zone
The current 7-day moving average ratio is 1.43,
with about 58.9% of the active supply in profit and 41.1% in loss.
7-day mean 1.14, 30-day mean 0.76;
The ratio remains above the 1.0 threshold by 0.43.
The Profit/Loss Supply Ratio measures how much pressure the active market is under; below 1.0 corresponds to an extreme capitulation zone
This public proxy model calculates (total profit supply minus 7–10 year and 10+ year dormant coins) divided by total loss supply, and applies a 7-day moving average to the result.
A ratio above 1.0 indicates more active profit-bearing coins,
while below 1.0 indicates loss-bearing coins dominate.
Historically,
periods where the ratio stays below 1.0 have overlapped with the buildup phases of deep bear markets in 2014–2015, 2018–2019, and 2022–2023.
The red zone reflects widespread unrealized losses and coin capitulation,
but a single drop below the line does not automatically confirm an absolute bottom.
$BTC
Bitcoin: Profit/Loss Supply Ratio (excluding >7Y)
Current ratio (7D MA) 1.43
Has exceeded the 1.0 alert threshold
In an upward phase · Profit expansion
Bitcoin: Profit/Loss Supply Ratio (excluding >7Y)
Compares the more active profit supply with loss supply, excludes dormant coins older than 7 years, and identifies the capitulation window using a 7-day moving average of the period.
Active supply profit/loss status recovery zone
The current 7-day moving average ratio is 1.43,
with about 58.9% of the active supply in profit and 41.1% in loss.
7-day mean 1.14, 30-day mean 0.76;
The ratio remains above the 1.0 threshold by 0.43.
The Profit/Loss Supply Ratio measures how much pressure the active market is under; below 1.0 corresponds to an extreme capitulation zone
This public proxy model calculates (total profit supply minus 7–10 year and 10+ year dormant coins) divided by total loss supply, and applies a 7-day moving average to the result.
A ratio above 1.0 indicates more active profit-bearing coins,
while below 1.0 indicates loss-bearing coins dominate.
Historically,
periods where the ratio stays below 1.0 have overlapped with the buildup phases of deep bear markets in 2014–2015, 2018–2019, and 2022–2023.
The red zone reflects widespread unrealized losses and coin capitulation,
but a single drop below the line does not automatically confirm an absolute bottom.
$BTC