Bitcoin $BTC —Is the bull market here?
I think this is a question that every player in the crypto world will ask, whether they hold tens of dollars or millions to tens of millions of dollars.
I don’t trust anyone. I only trust what I see, and what I understand.
Pure technical analysis—some people may find it shameful, but it’s the most fair analytical tool available to ordinary people.
So the following content is also based purely on technical analysis.
Back in 2025, I clearly told my friends that Bitcoin had already topped (as shown in the screenshot). The key indicator used to judge the top was called: divergence.
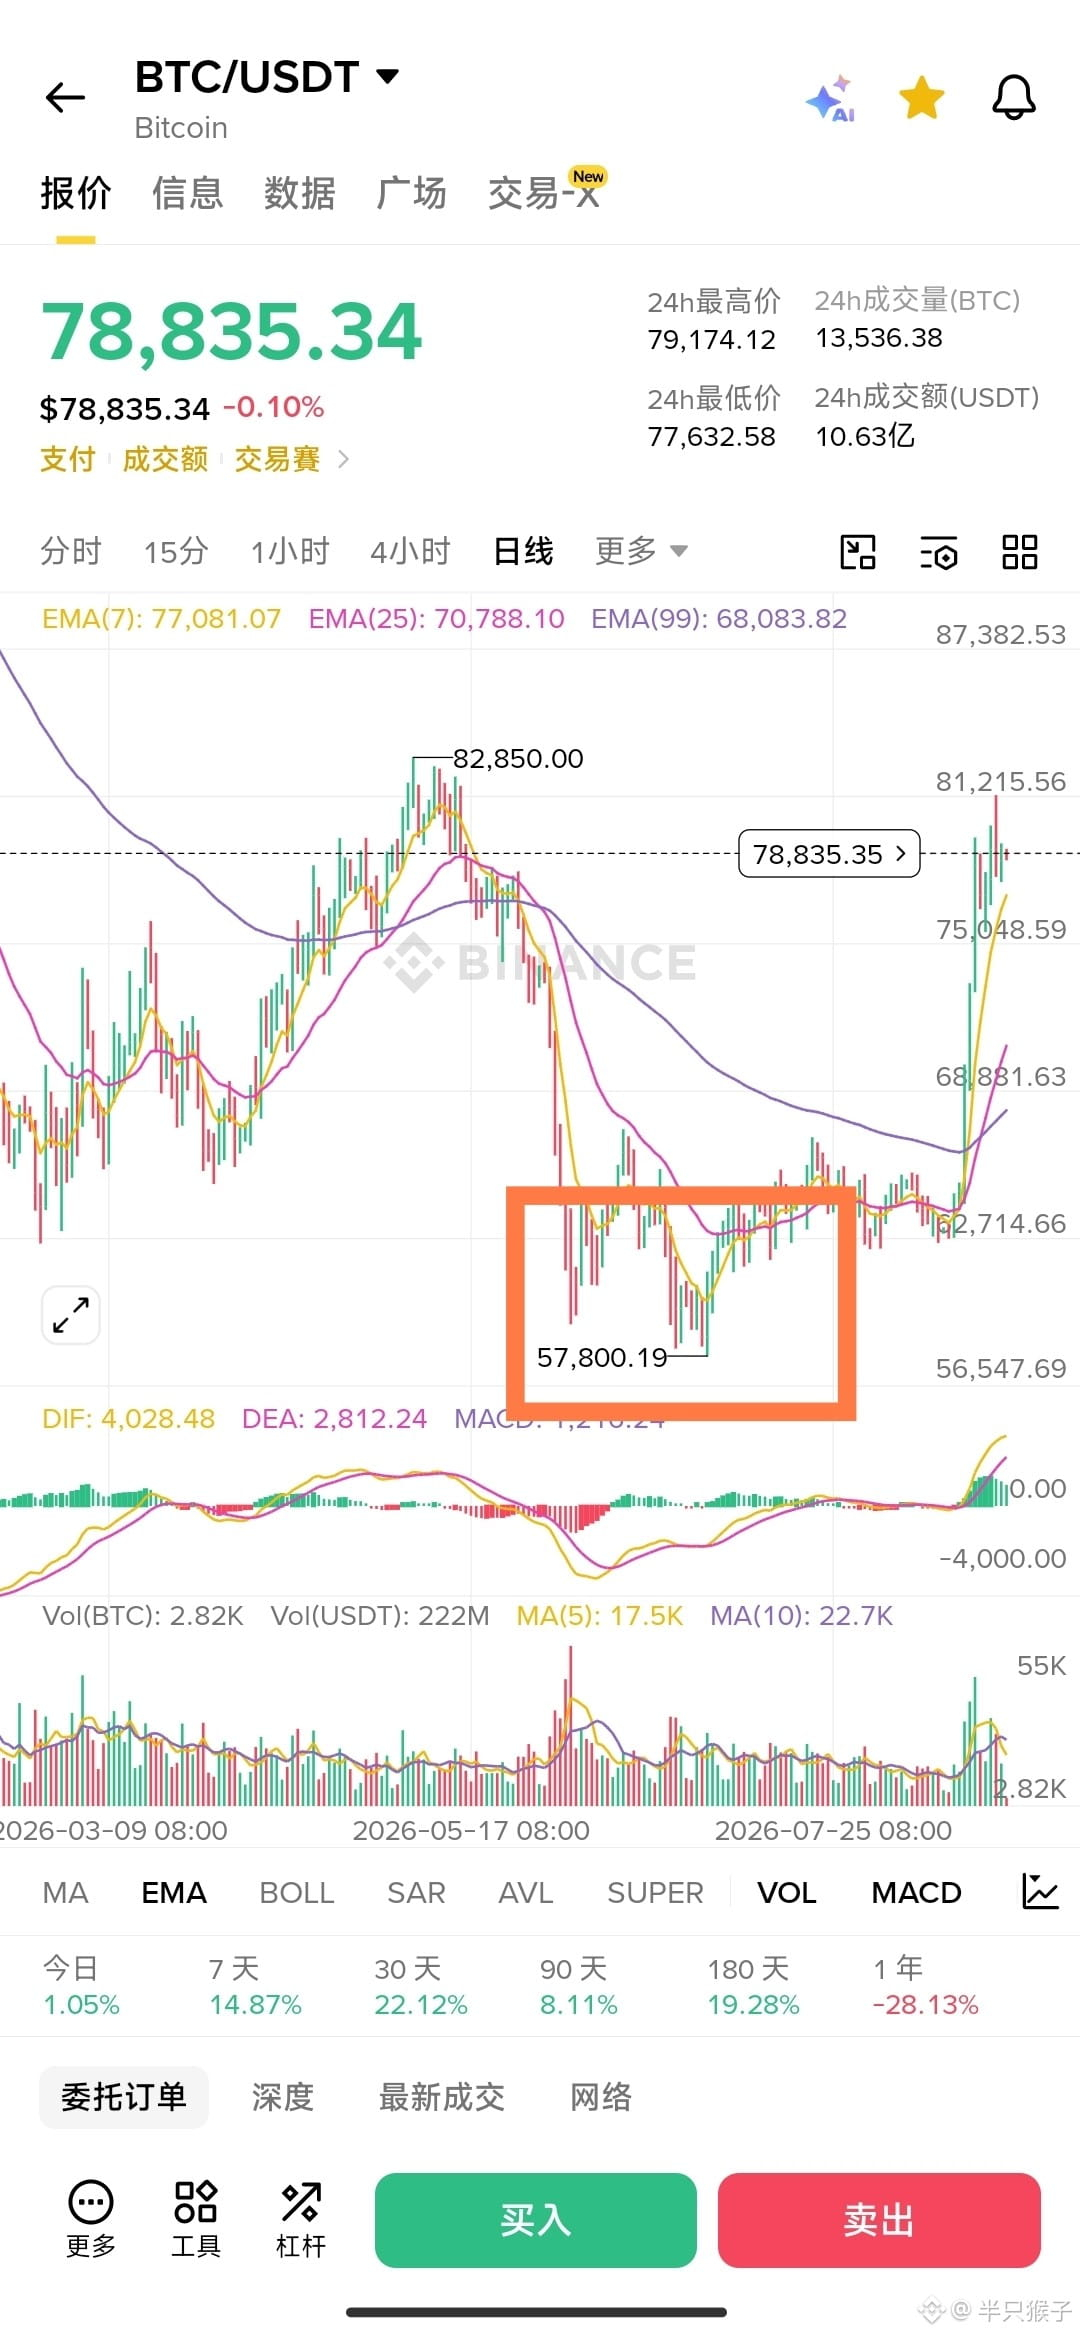
In simple terms, the price makes a new high, but the MACD doesn’t. In other words, the price hits a new high, but the related technical indicator does not. A daily timeframe divergence with enough strength is powerful enough to see Bitcoin fall sharply afterward, all the way to 58,000 USD.
And in Chart 1, you can clearly see a daily timeframe bottom divergence. Plainly speaking: the switch between bull and bear—so the bull market is here!
When I saw this divergence, I had already advised the friends around me to sell off all their U.S. stocks. The crypto market is entering a bull market right now, and everywhere is gold.
After that, Bitcoin surged from 58,000 all the way to around 80,000. That’s the power of divergence.
The previous post said that by using trendlines to judge, you had to wait until the price reached 63,000 USD to confirm. So the sensitivity of divergence is higher than that of trendlines.
And if you look at bullish breakout patterns or formations, the price is already close to 70,000 USD.
Trust me—the bull market is already here. It will keep rising all the way, but the process will be a bit winding.
I think this is a question that every player in the crypto world will ask, whether they hold tens of dollars or millions to tens of millions of dollars.
I don’t trust anyone. I only trust what I see, and what I understand.
Pure technical analysis—some people may find it shameful, but it’s the most fair analytical tool available to ordinary people.
So the following content is also based purely on technical analysis.
Back in 2025, I clearly told my friends that Bitcoin had already topped (as shown in the screenshot). The key indicator used to judge the top was called: divergence.
In simple terms, the price makes a new high, but the MACD doesn’t. In other words, the price hits a new high, but the related technical indicator does not. A daily timeframe divergence with enough strength is powerful enough to see Bitcoin fall sharply afterward, all the way to 58,000 USD.
And in Chart 1, you can clearly see a daily timeframe bottom divergence. Plainly speaking: the switch between bull and bear—so the bull market is here!
When I saw this divergence, I had already advised the friends around me to sell off all their U.S. stocks. The crypto market is entering a bull market right now, and everywhere is gold.
After that, Bitcoin surged from 58,000 all the way to around 80,000. That’s the power of divergence.
The previous post said that by using trendlines to judge, you had to wait until the price reached 63,000 USD to confirm. So the sensitivity of divergence is higher than that of trendlines.
And if you look at bullish breakout patterns or formations, the price is already close to 70,000 USD.
Trust me—the bull market is already here. It will keep rising all the way, but the process will be a bit winding.