#BTC #纳指
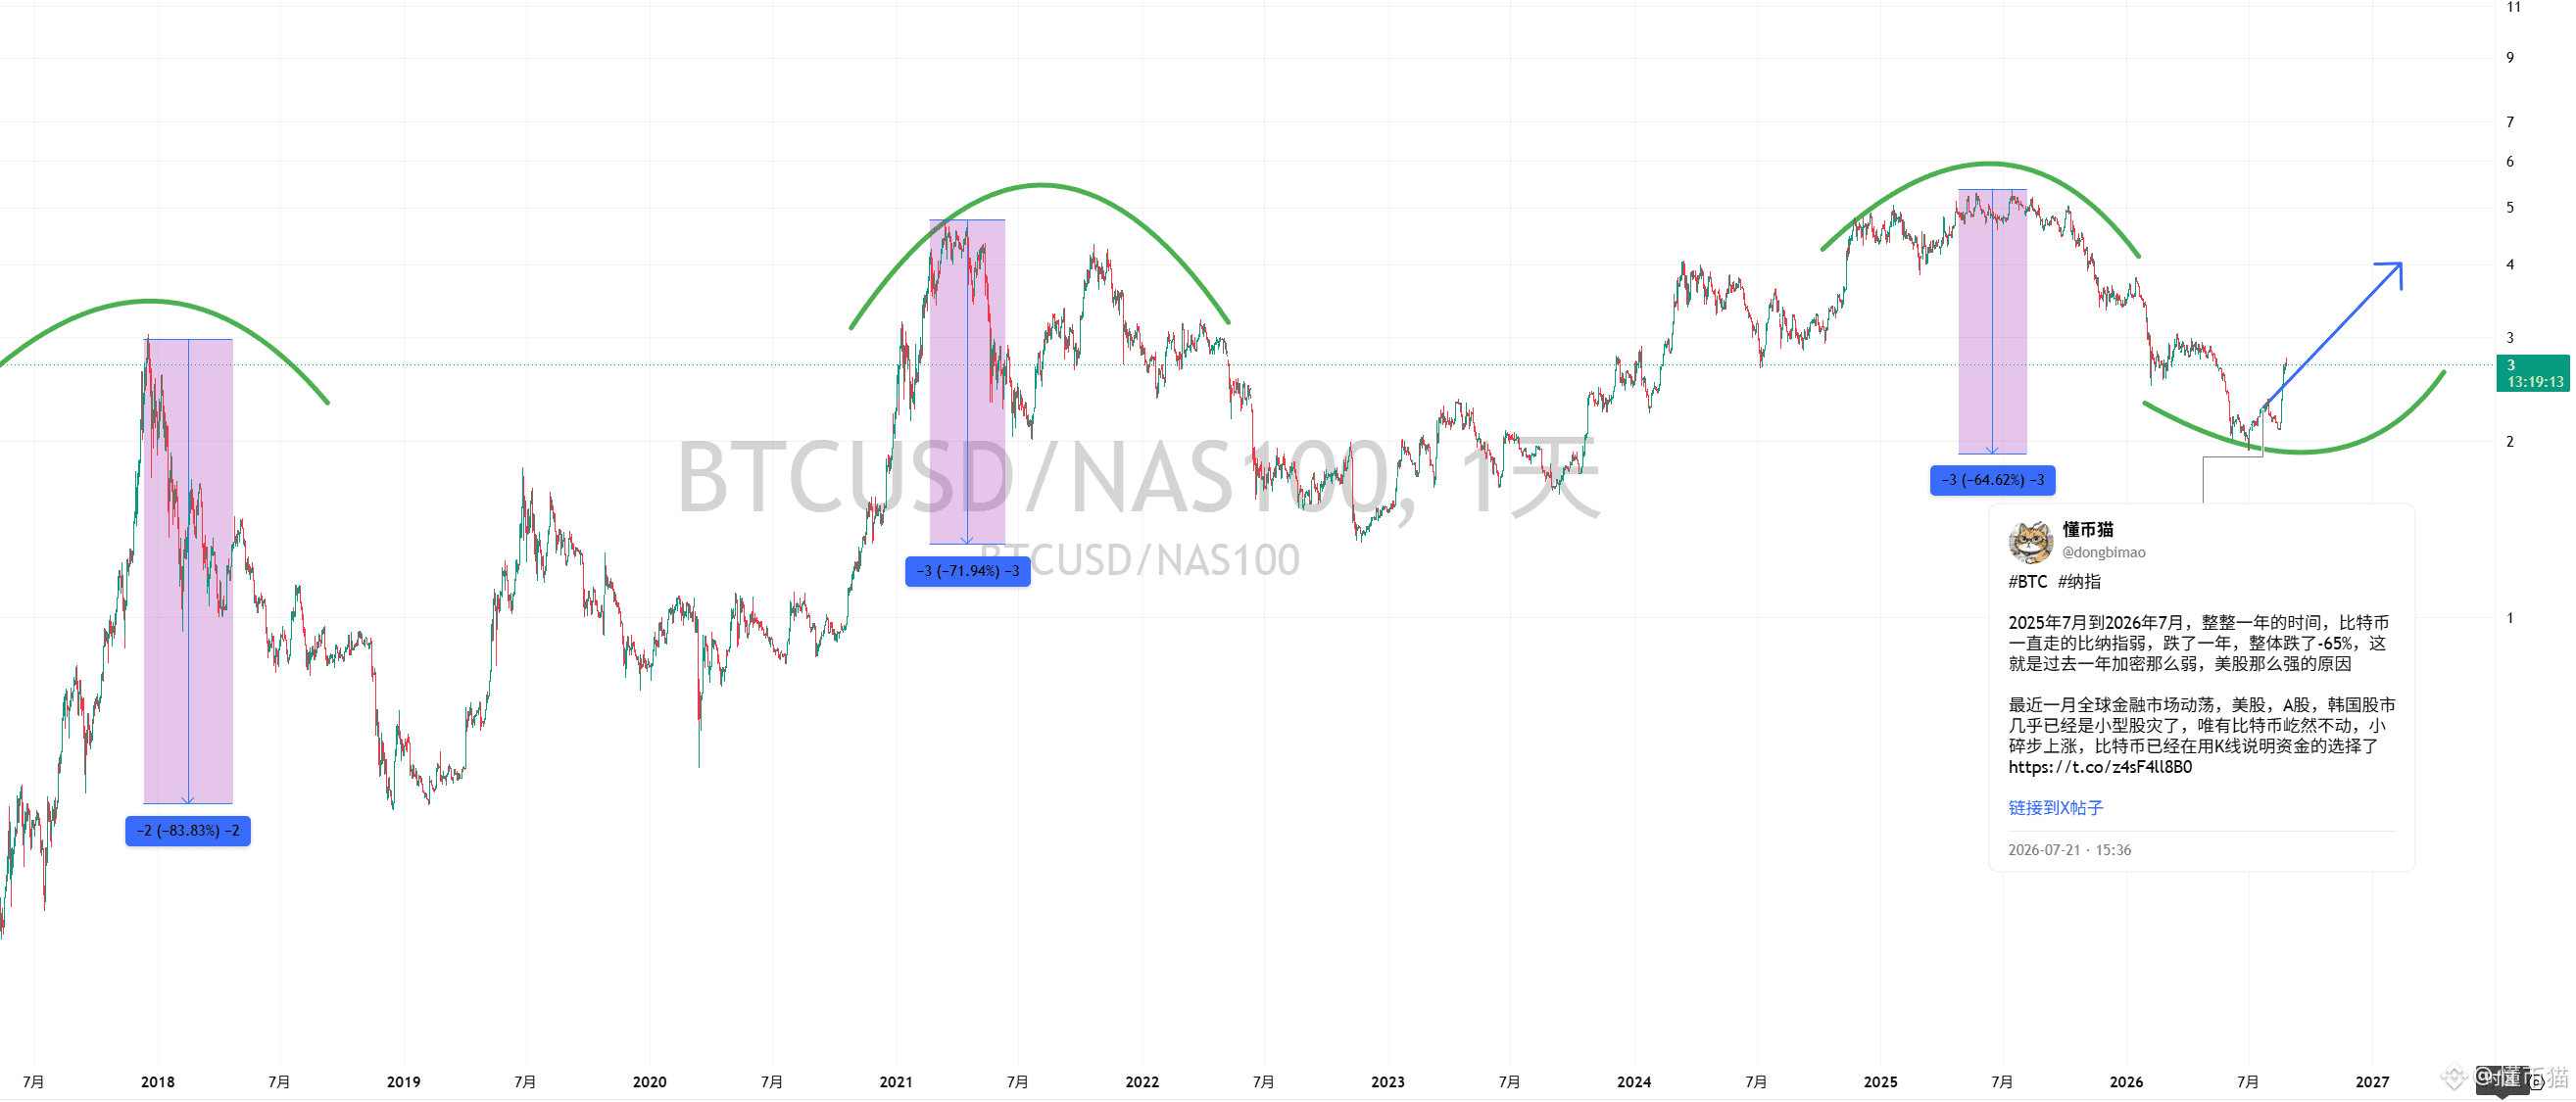
Back in July, during a live stream where I discussed converting Bitcoin and the Nasdaq exchange rate, I shared a chart: it’s a long-term comparison chart of the BTCUSD/NAS100 exchange rate.
1.
At the time, BTCUSD/NAS100 was around 2, and now it’s around 3.
In the previous Bitcoin cycle, the exchange rate dropped by 72%.
At the start of July, in this bear-market cycle, Bitcoin had already fallen 65% relative to the Nasdaq.
2.
This chart is very interesting. Anyone familiar with Bitcoin cycles can clearly see that the 4-year cycle is still working.
From 2021 to 2025, the exchange rate’s peak has stayed around 5.
In the most recent bull run, the exchange-rate high didn’t break upward by much.
Also, the drop in the exchange rate in each Bitcoin cycle has been diminishing, and volatility has been getting lower.
3.
Based on the above signs, I concluded that
in July and August, the exchange rate would start rebounding.
The probability of Bitcoin putting in a bottom would increase significantly.
There would be a fairly smooth uptrend.
Bitcoin already showed signs of a bottom reversal, so I increased my regular investing (DCA) and actively tried to go long Bitcoin from the bottom.
Now looking back, all the judgments I made at the time came true.
If you don’t understand the capital flows across different markets, or all the complicated institutional data, you can simply look at this Bitcoin exchange-rate chart, and you’ll basically understand where Bitcoin and the Nasdaq are right now.
Understand-Coin Cat community automatically returns 20%: invite code: CATBTC88
Back in July, during a live stream where I discussed converting Bitcoin and the Nasdaq exchange rate, I shared a chart: it’s a long-term comparison chart of the BTCUSD/NAS100 exchange rate.
1.
At the time, BTCUSD/NAS100 was around 2, and now it’s around 3.
In the previous Bitcoin cycle, the exchange rate dropped by 72%.
At the start of July, in this bear-market cycle, Bitcoin had already fallen 65% relative to the Nasdaq.
2.
This chart is very interesting. Anyone familiar with Bitcoin cycles can clearly see that the 4-year cycle is still working.
From 2021 to 2025, the exchange rate’s peak has stayed around 5.
In the most recent bull run, the exchange-rate high didn’t break upward by much.
Also, the drop in the exchange rate in each Bitcoin cycle has been diminishing, and volatility has been getting lower.
3.
Based on the above signs, I concluded that
in July and August, the exchange rate would start rebounding.
The probability of Bitcoin putting in a bottom would increase significantly.
There would be a fairly smooth uptrend.
Bitcoin already showed signs of a bottom reversal, so I increased my regular investing (DCA) and actively tried to go long Bitcoin from the bottom.
Now looking back, all the judgments I made at the time came true.
If you don’t understand the capital flows across different markets, or all the complicated institutional data, you can simply look at this Bitcoin exchange-rate chart, and you’ll basically understand where Bitcoin and the Nasdaq are right now.
Understand-Coin Cat community automatically returns 20%: invite code: CATBTC88