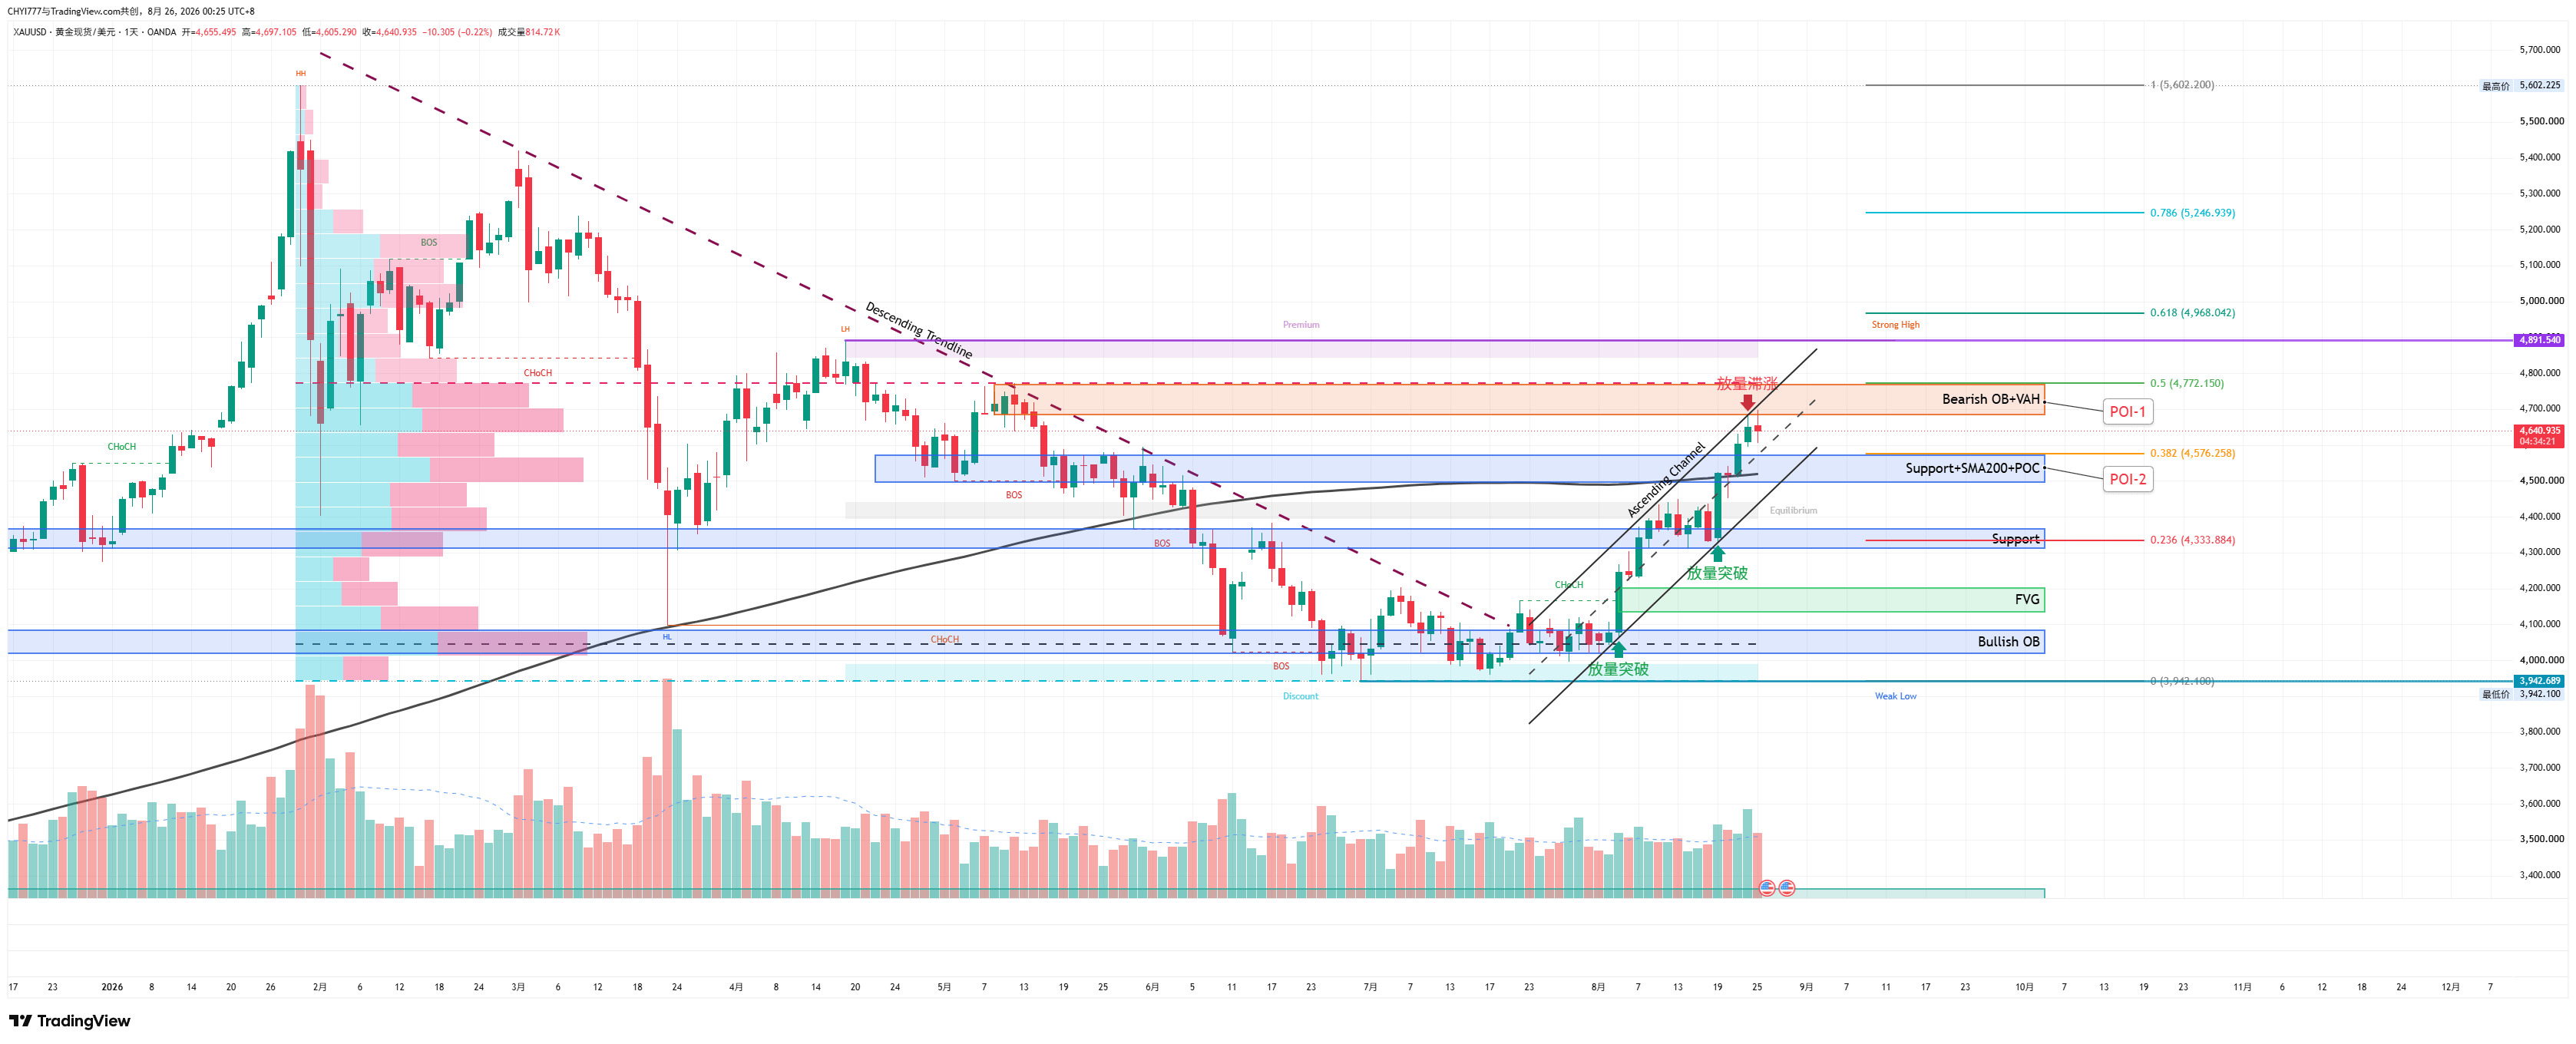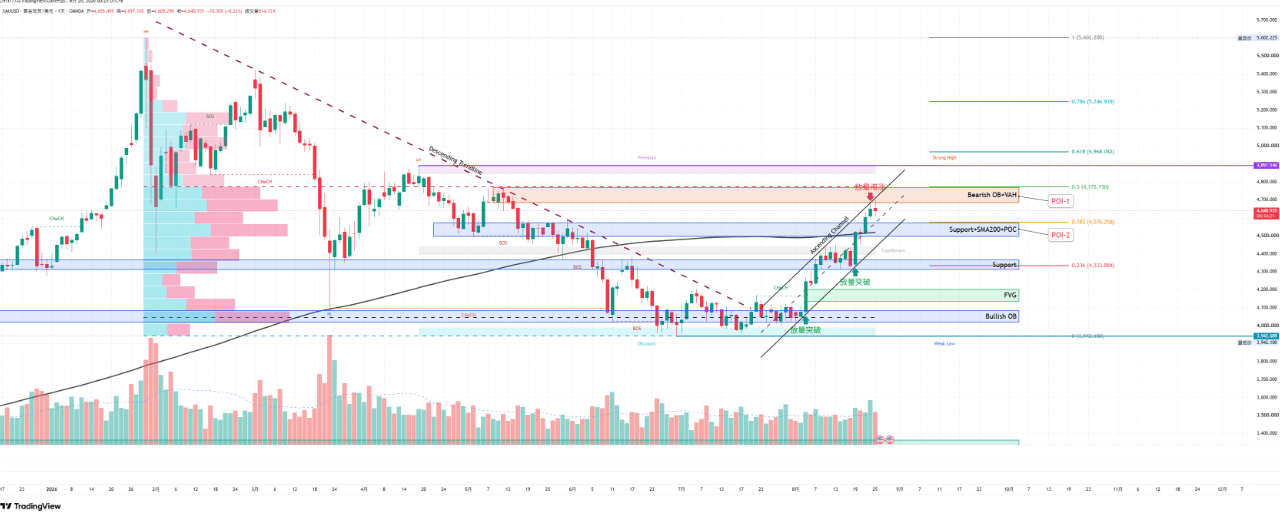

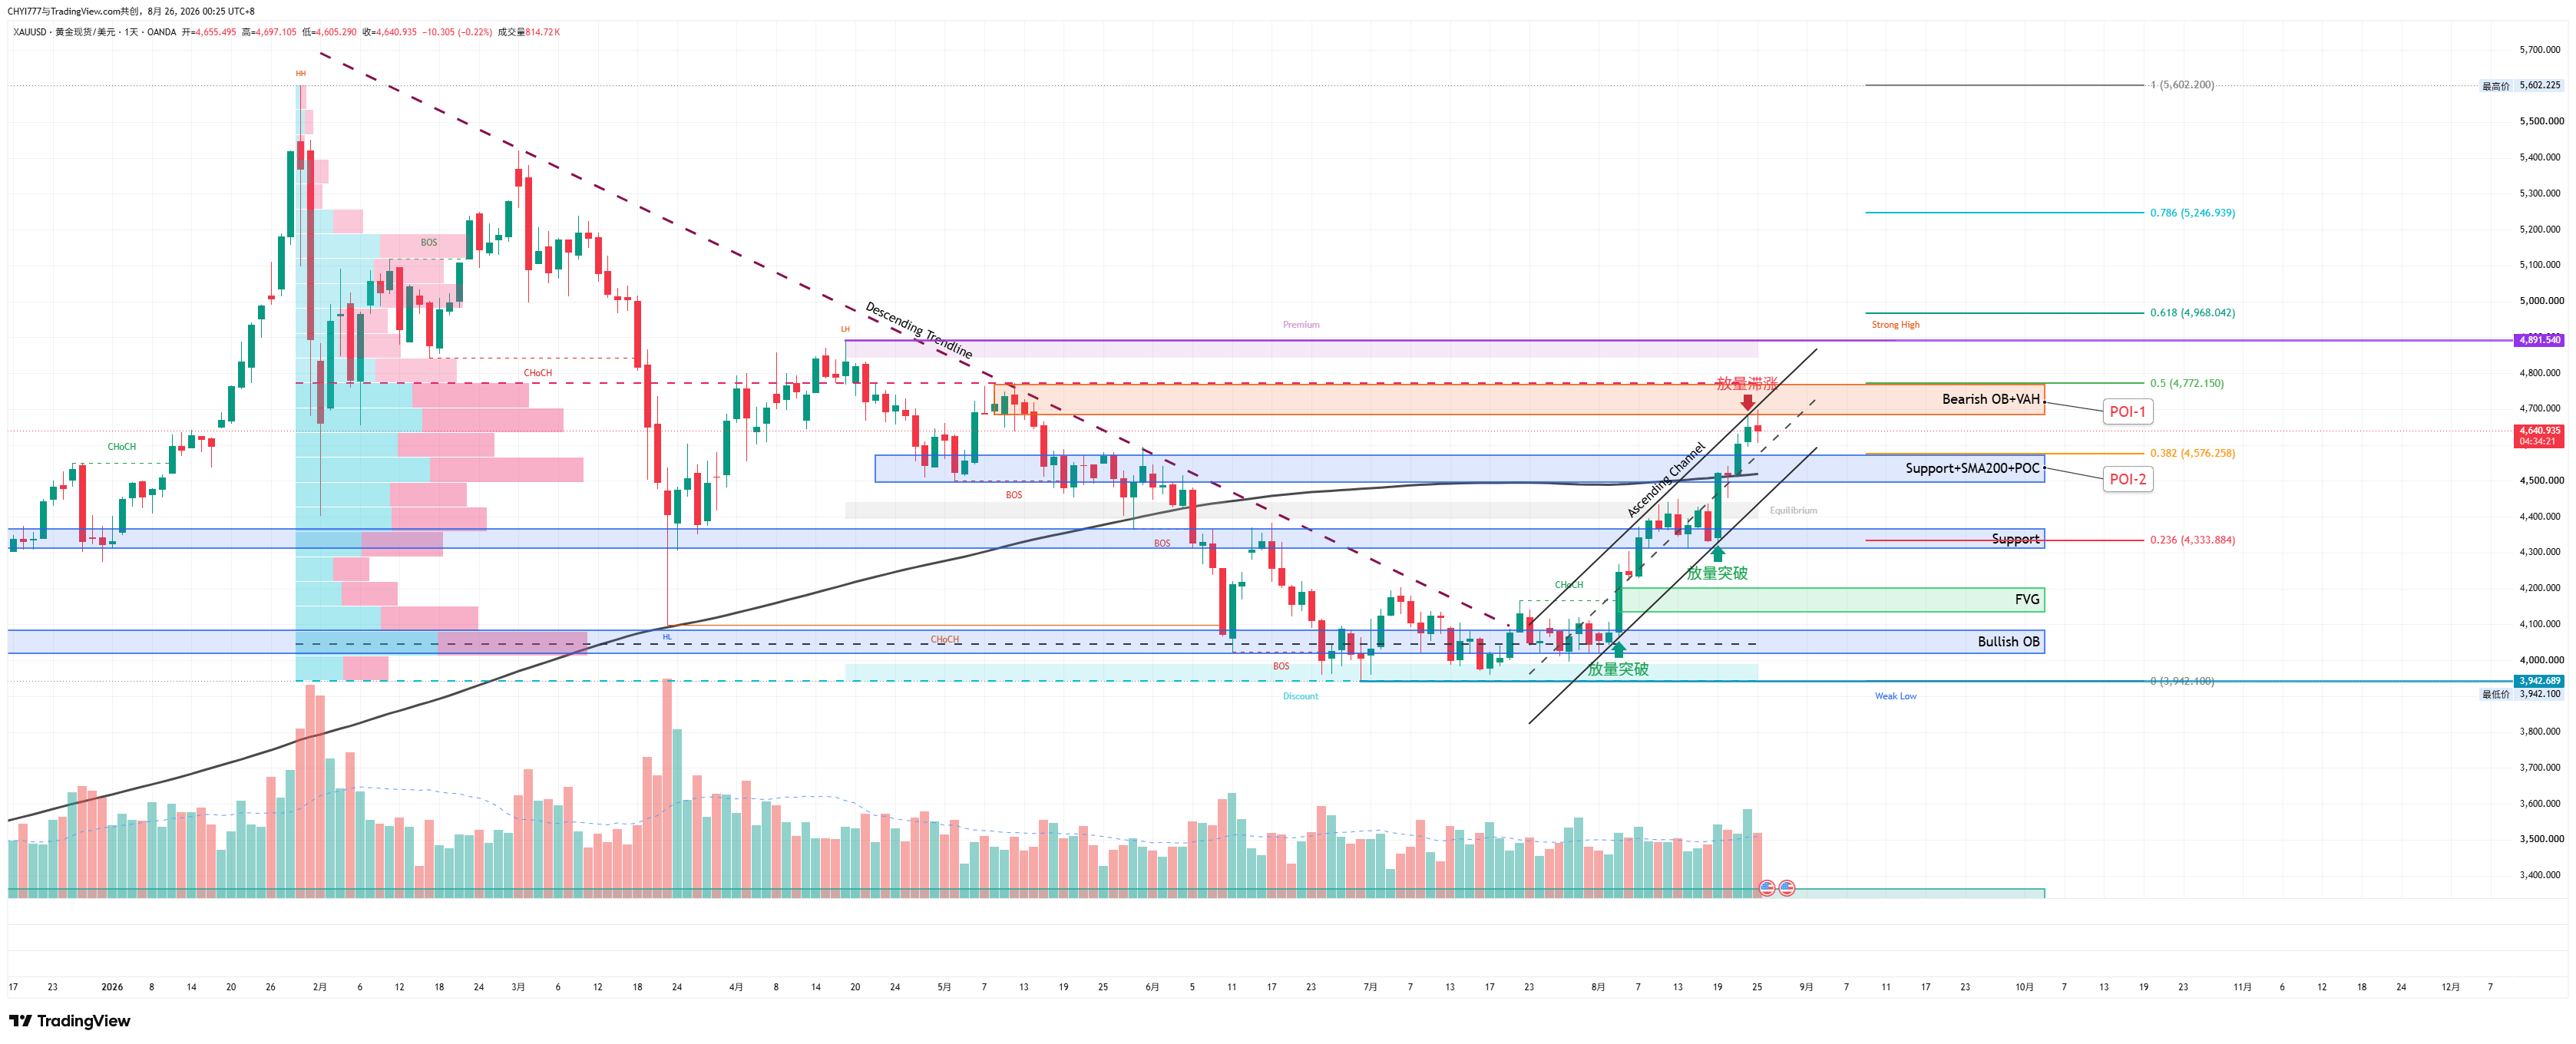
After gold completed accumulation around the 4000 area from June to August, it rebounded strongly. The current price has tested above the resistance zone and then slipped back under pressure. Overall, the bullish structure remains intact, but in the short term there is profit-taking pressure, and the market is waiting to choose a new direction.
Fundamentals
The market continues to weigh the outlook for the Fed’s monetary policy against the US dollar’s trend. Any dovish shift regarding the interest-rate path or renewed weakness in the dollar could provide fresh upside fuel for gold; conversely, if the dollar rebounds or real yields rise, pressure to take profits at higher levels will be released more quickly. Geopolitical uncertainty in the Middle East remains in the background, continuing to support demand for safe-haven assets.
Technical structure
On the daily chart, gold is trading within the rising channel from August. Current price is retracing from the POI-1 (Point of Interest 1) resistance zone; the first key support lies in the overlap area of the rising channel lower boundary and POI-2 (Point of Interest 2).
Key areas
🔹 POI-1 (4690-4770): The main resistance above formed by a Bearish OB (Bearish Order Block), VAH (Volume Area High), and a 0.5 Fibonacci confluence. Price previously stalled and dropped in this zone, showing a volume-expansion stagnation signal.
🔹 POI-2 (4500-4570): a multi-confluence area of Support, the SMA200 (200-day simple moving average), POC (Point of Control), the 0.382 Fibonacci level, and the rising channel. If price breaks below the recent trend, it may turn into a range-bound (choppy) market.
🔹 Bull/Bear boundary line (4310-4370): the overlap zone of the 0.236 Fibonacci and Support. If it breaks, the near-term trend turns bearish.
🔹 Demand zone (4135-4200): located at the FVG (Fair Value Gap), the bottom line of a broader bullish structure.
🔹 Major support (4020-4080): Bullish OB (Bullish Order Block), the bottom line of the bullish structure. If broken, the overall structure flips completely bearish.
🔹 Extended target (4850-5000): main resistance above where the 0.618 Fibonacci level overlaps with the Strong High (strong high point).
Bullish scenario — Uptrend continuation
If price stabilizes above POI-2 (4500-4570) and shows bullish candlestick confirmation, then the rising channel lower boundary support remains valid. After a rebound breaks above 4690, it will re-challenge POI-1 (4690-4770). If the daily close holds above 4770, the bullish structure continues, with targets pointing to 4850-5000.
Bearish scenario — Adjustment risk
If gold breaks below POI-2 (4500-4570)—especially if the body breaks the rising channel lower boundary—the short-term accelerated rebound will come to an end. The next target is 4310-4370; continued breakdown will expose 4135-4200. Deeper still would test 4020-4080—this is the last line of defense that bulls must hold.
Personal view
Gold is currently at a critical decision point within the rising channel. The trend structure still leans bullish, but the retracement from POI-1 (4690-4770) suggests that breakout-chasing funds at higher levels are becoming cautious. The market needs a new catalyst to drive the next leg higher.
Wait for a clear stabilization signal at POI-2 (4500-4570) before entering. If the rebound returns to the upper edge of POI-1 (4690-4770), don’t chase blindly—wait for daily breakout confirmation.
POI-2 (4500-4570) → Stabilization or a breakdown.
Hold + bullish confirmation → Rebound target: 4690-4770. After a breakout, look for 4850-5000.
Breakdown → Adjust down to 4310-4370; extreme case: 4020-4080.
Bias: Bullish structure—wait for a stabilization signal at POI-2 (4500-4570) to go long, or wait for breakout confirmation at POI-1 (4690-4770). Avoid trading unplanned in mid-range prices.
For sharing my personal review only; it does not constitute any investment advice.
#XAU