【BTC Weekly Market Analysis】8/25
Let's review the market trend: From the broader market perspective, this bottom-building phase has crossed the first stage and directly reached the second stage. This bottom-blasting surge may seem sudden, but actually it was planned by the big players well in advance.
The U.S. Treasury has increased its buyback of U.S. Treasuries, a positive for U.S. stocks, attracting some hot money that comes in from retail investors—after taking in new inflows, some of that hot money then flows into the crypto market. Crypto overall liquidity has never been high; the proportion of people bearish on the market is large, and most spot players are still on the sidelines. During July and August, the multiple “bull-trap” moves were not perfect enough, causing the accumulated short positions to keep building higher. This surge driven by inflows of hot money represents a historically significant liquidation-type push. With the fiery SNDK storing and then—when BTC surged—dropping like a stone, it suggests the selling pressure in U.S. stocks is still manageable.
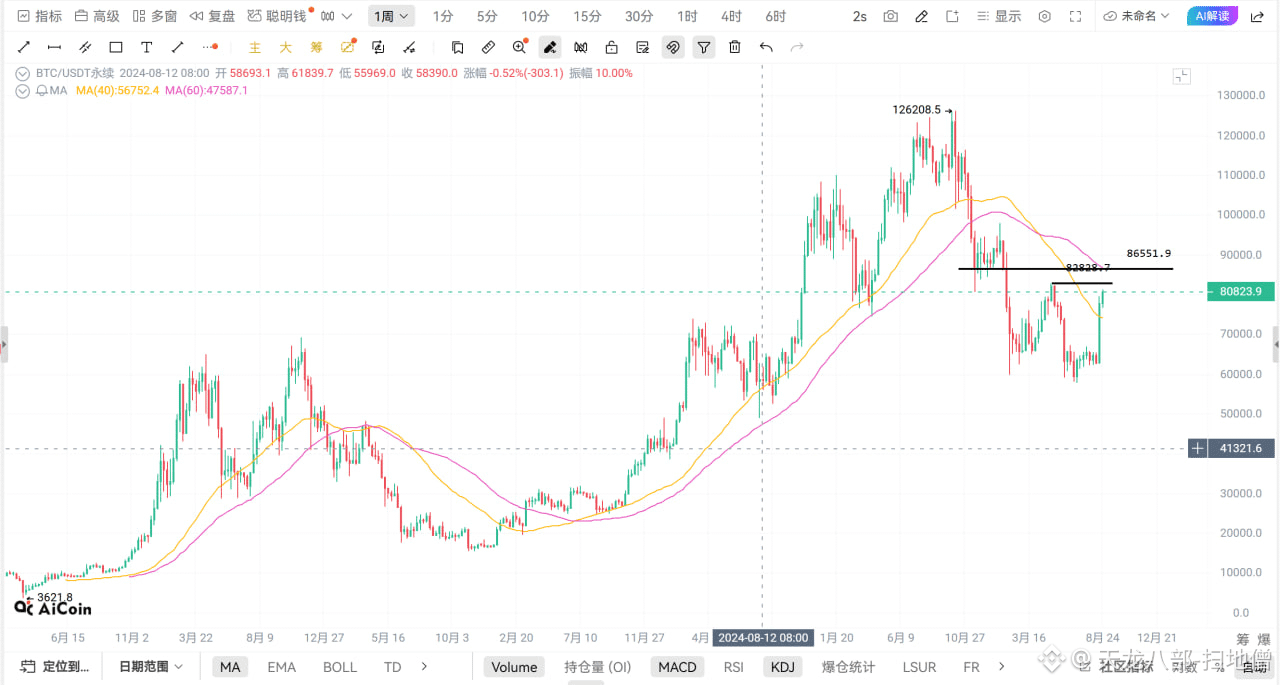
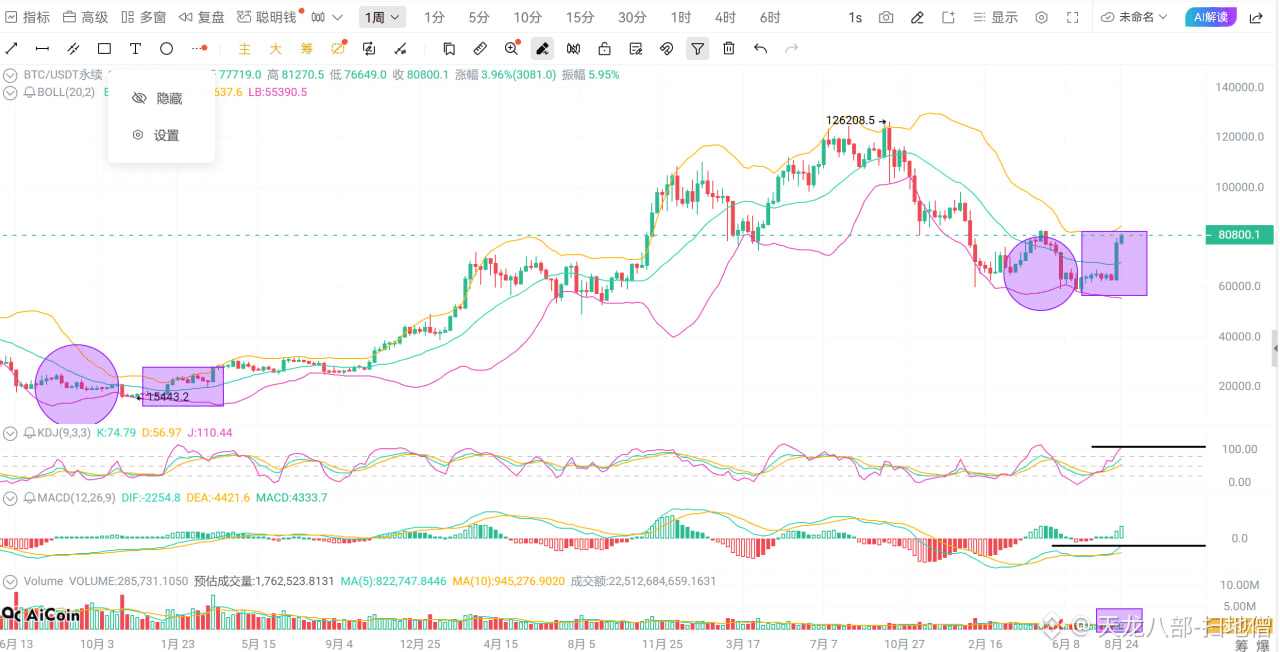
Now, let’s talk about the current situation. After the market broke the 67,500 support level, it began to surge hard and broke through 80,000. It’s currently around 81,300. The resistance above is the pullback high from May at 82,800. The weekly MA60 pressure point is 86,500. The KDJ has reached 111. The MACD has formed a golden cross below zero, and although it still has room to go, after multiple cross-overs between long and short energy, two consecutive weeks have shown long-side energy release.
Speaking of volume (VOL) and the alternating between long and short energy: the release of long momentum leading to a pullback was expected. But nobody expected the 67,500 support to be broken so easily. Actually, KDJ was at 31 points when the price was at 67,200; KDJ was at 73 when the price was at 65,400. After two “wrinkle” pullbacks, price rallied again—while the price at high levels declined, but KDJ climbed. This moment also fits into the big players’ calculations. In the end, when it surged to 81,300, KDJ was only 111—meaning it has not traveled as far in KDJ terms as the previous consolidation pullback rally to 65,400.
As of now, the monthly chart suggests a bullish outlook—the month is clearly trending bullish. However, on the weekly timeframe, bearish indications are not far off, and the risk of downside is present at any time. But from the medium-to-long-term indicators, there is still a chance for the market to continue rising and break above 82,800. Because the blast pushed the medium-to-long-term indicators into an extreme distortion angle, to get an “ultimate” short-entry position, you still need to take advantage of wave-by-wave opportunities and probe step by step.
The market has still formed an upward monthly cycle. For weekly-level retracement supports, there are basically 75,000 and 69,000. Later, the market still needs to rise—this is part of the repair after an upswing to bring the broader market indicators back in line. If the market continues to rise later, the expected direction after the retracement is toward 98,000.
$BTC
Let's review the market trend: From the broader market perspective, this bottom-building phase has crossed the first stage and directly reached the second stage. This bottom-blasting surge may seem sudden, but actually it was planned by the big players well in advance.
The U.S. Treasury has increased its buyback of U.S. Treasuries, a positive for U.S. stocks, attracting some hot money that comes in from retail investors—after taking in new inflows, some of that hot money then flows into the crypto market. Crypto overall liquidity has never been high; the proportion of people bearish on the market is large, and most spot players are still on the sidelines. During July and August, the multiple “bull-trap” moves were not perfect enough, causing the accumulated short positions to keep building higher. This surge driven by inflows of hot money represents a historically significant liquidation-type push. With the fiery SNDK storing and then—when BTC surged—dropping like a stone, it suggests the selling pressure in U.S. stocks is still manageable.
Now, let’s talk about the current situation. After the market broke the 67,500 support level, it began to surge hard and broke through 80,000. It’s currently around 81,300. The resistance above is the pullback high from May at 82,800. The weekly MA60 pressure point is 86,500. The KDJ has reached 111. The MACD has formed a golden cross below zero, and although it still has room to go, after multiple cross-overs between long and short energy, two consecutive weeks have shown long-side energy release.
Speaking of volume (VOL) and the alternating between long and short energy: the release of long momentum leading to a pullback was expected. But nobody expected the 67,500 support to be broken so easily. Actually, KDJ was at 31 points when the price was at 67,200; KDJ was at 73 when the price was at 65,400. After two “wrinkle” pullbacks, price rallied again—while the price at high levels declined, but KDJ climbed. This moment also fits into the big players’ calculations. In the end, when it surged to 81,300, KDJ was only 111—meaning it has not traveled as far in KDJ terms as the previous consolidation pullback rally to 65,400.
As of now, the monthly chart suggests a bullish outlook—the month is clearly trending bullish. However, on the weekly timeframe, bearish indications are not far off, and the risk of downside is present at any time. But from the medium-to-long-term indicators, there is still a chance for the market to continue rising and break above 82,800. Because the blast pushed the medium-to-long-term indicators into an extreme distortion angle, to get an “ultimate” short-entry position, you still need to take advantage of wave-by-wave opportunities and probe step by step.
The market has still formed an upward monthly cycle. For weekly-level retracement supports, there are basically 75,000 and 69,000. Later, the market still needs to rise—this is part of the repair after an upswing to bring the broader market indicators back in line. If the market continues to rise later, the expected direction after the retracement is toward 98,000.
$BTC