


Why the possible correction of the crypto market is considered specifically as a pullback, not as the end of the uptrend. And accordingly—long-term shorts are not considered a sound idea.
The answer to this question is given by signals on a number of charts:
- the dominance of stablecoins USDT+USDC,
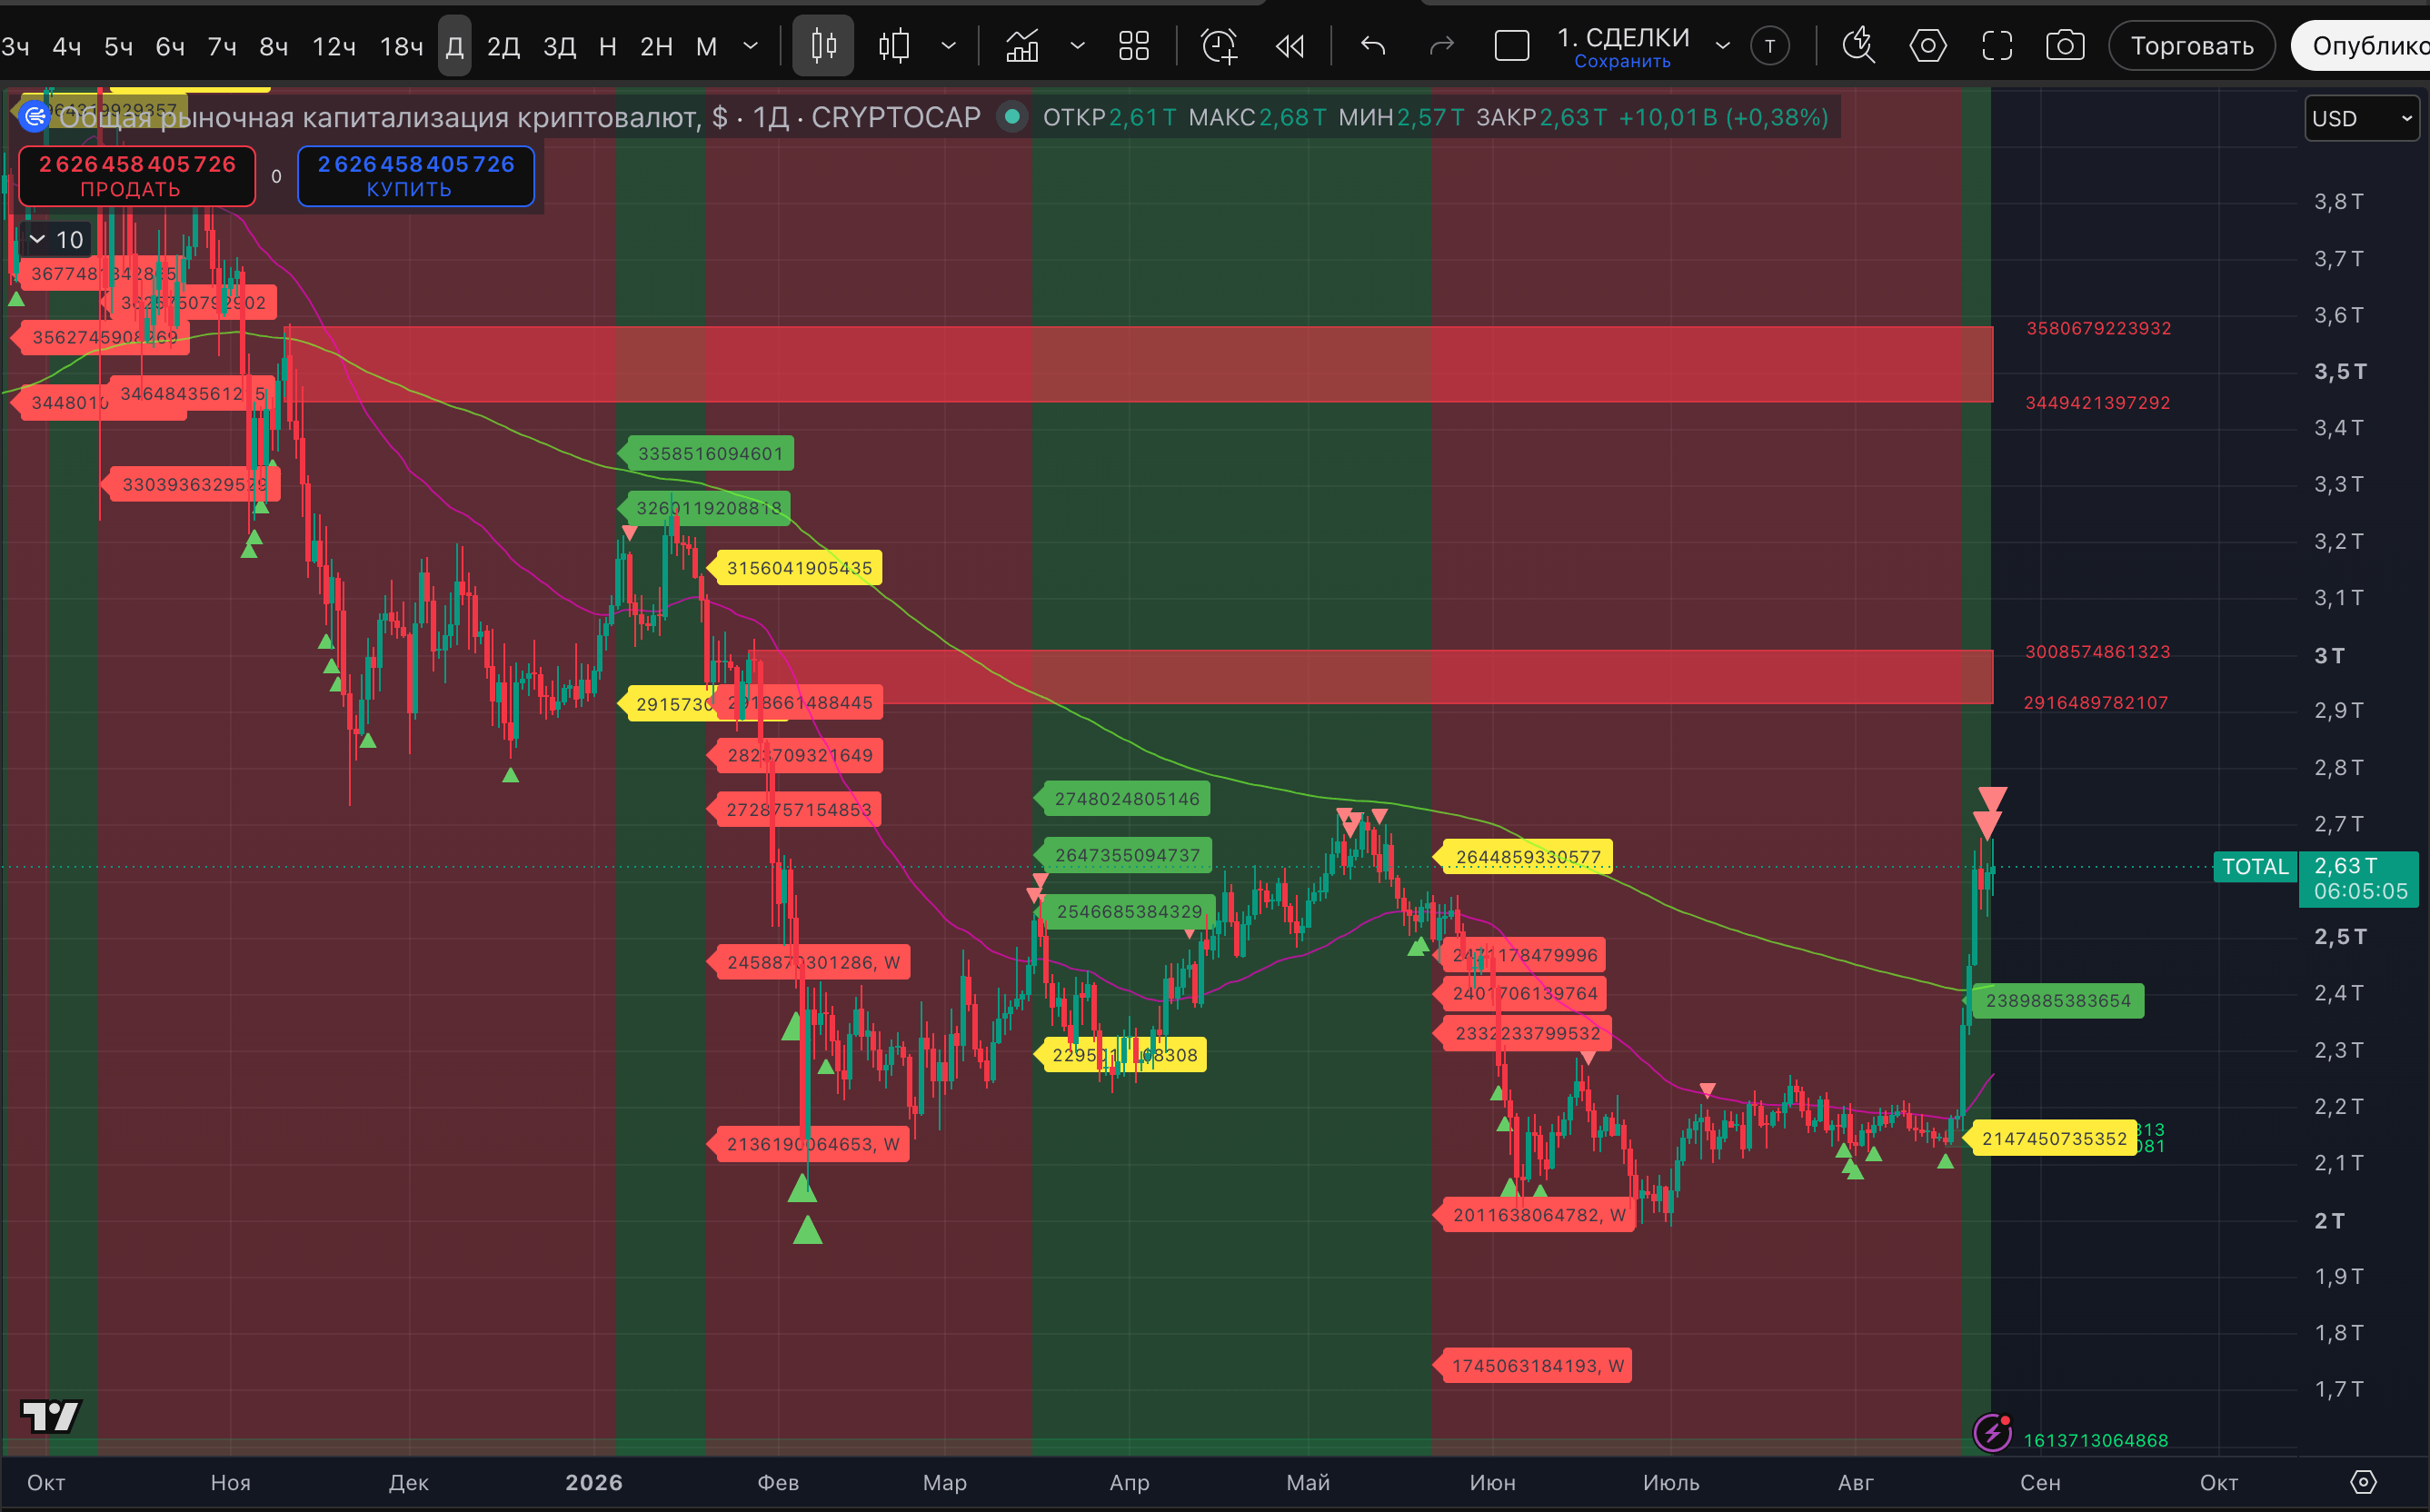
- TOTAL (the capitalization of the entire crypto market),
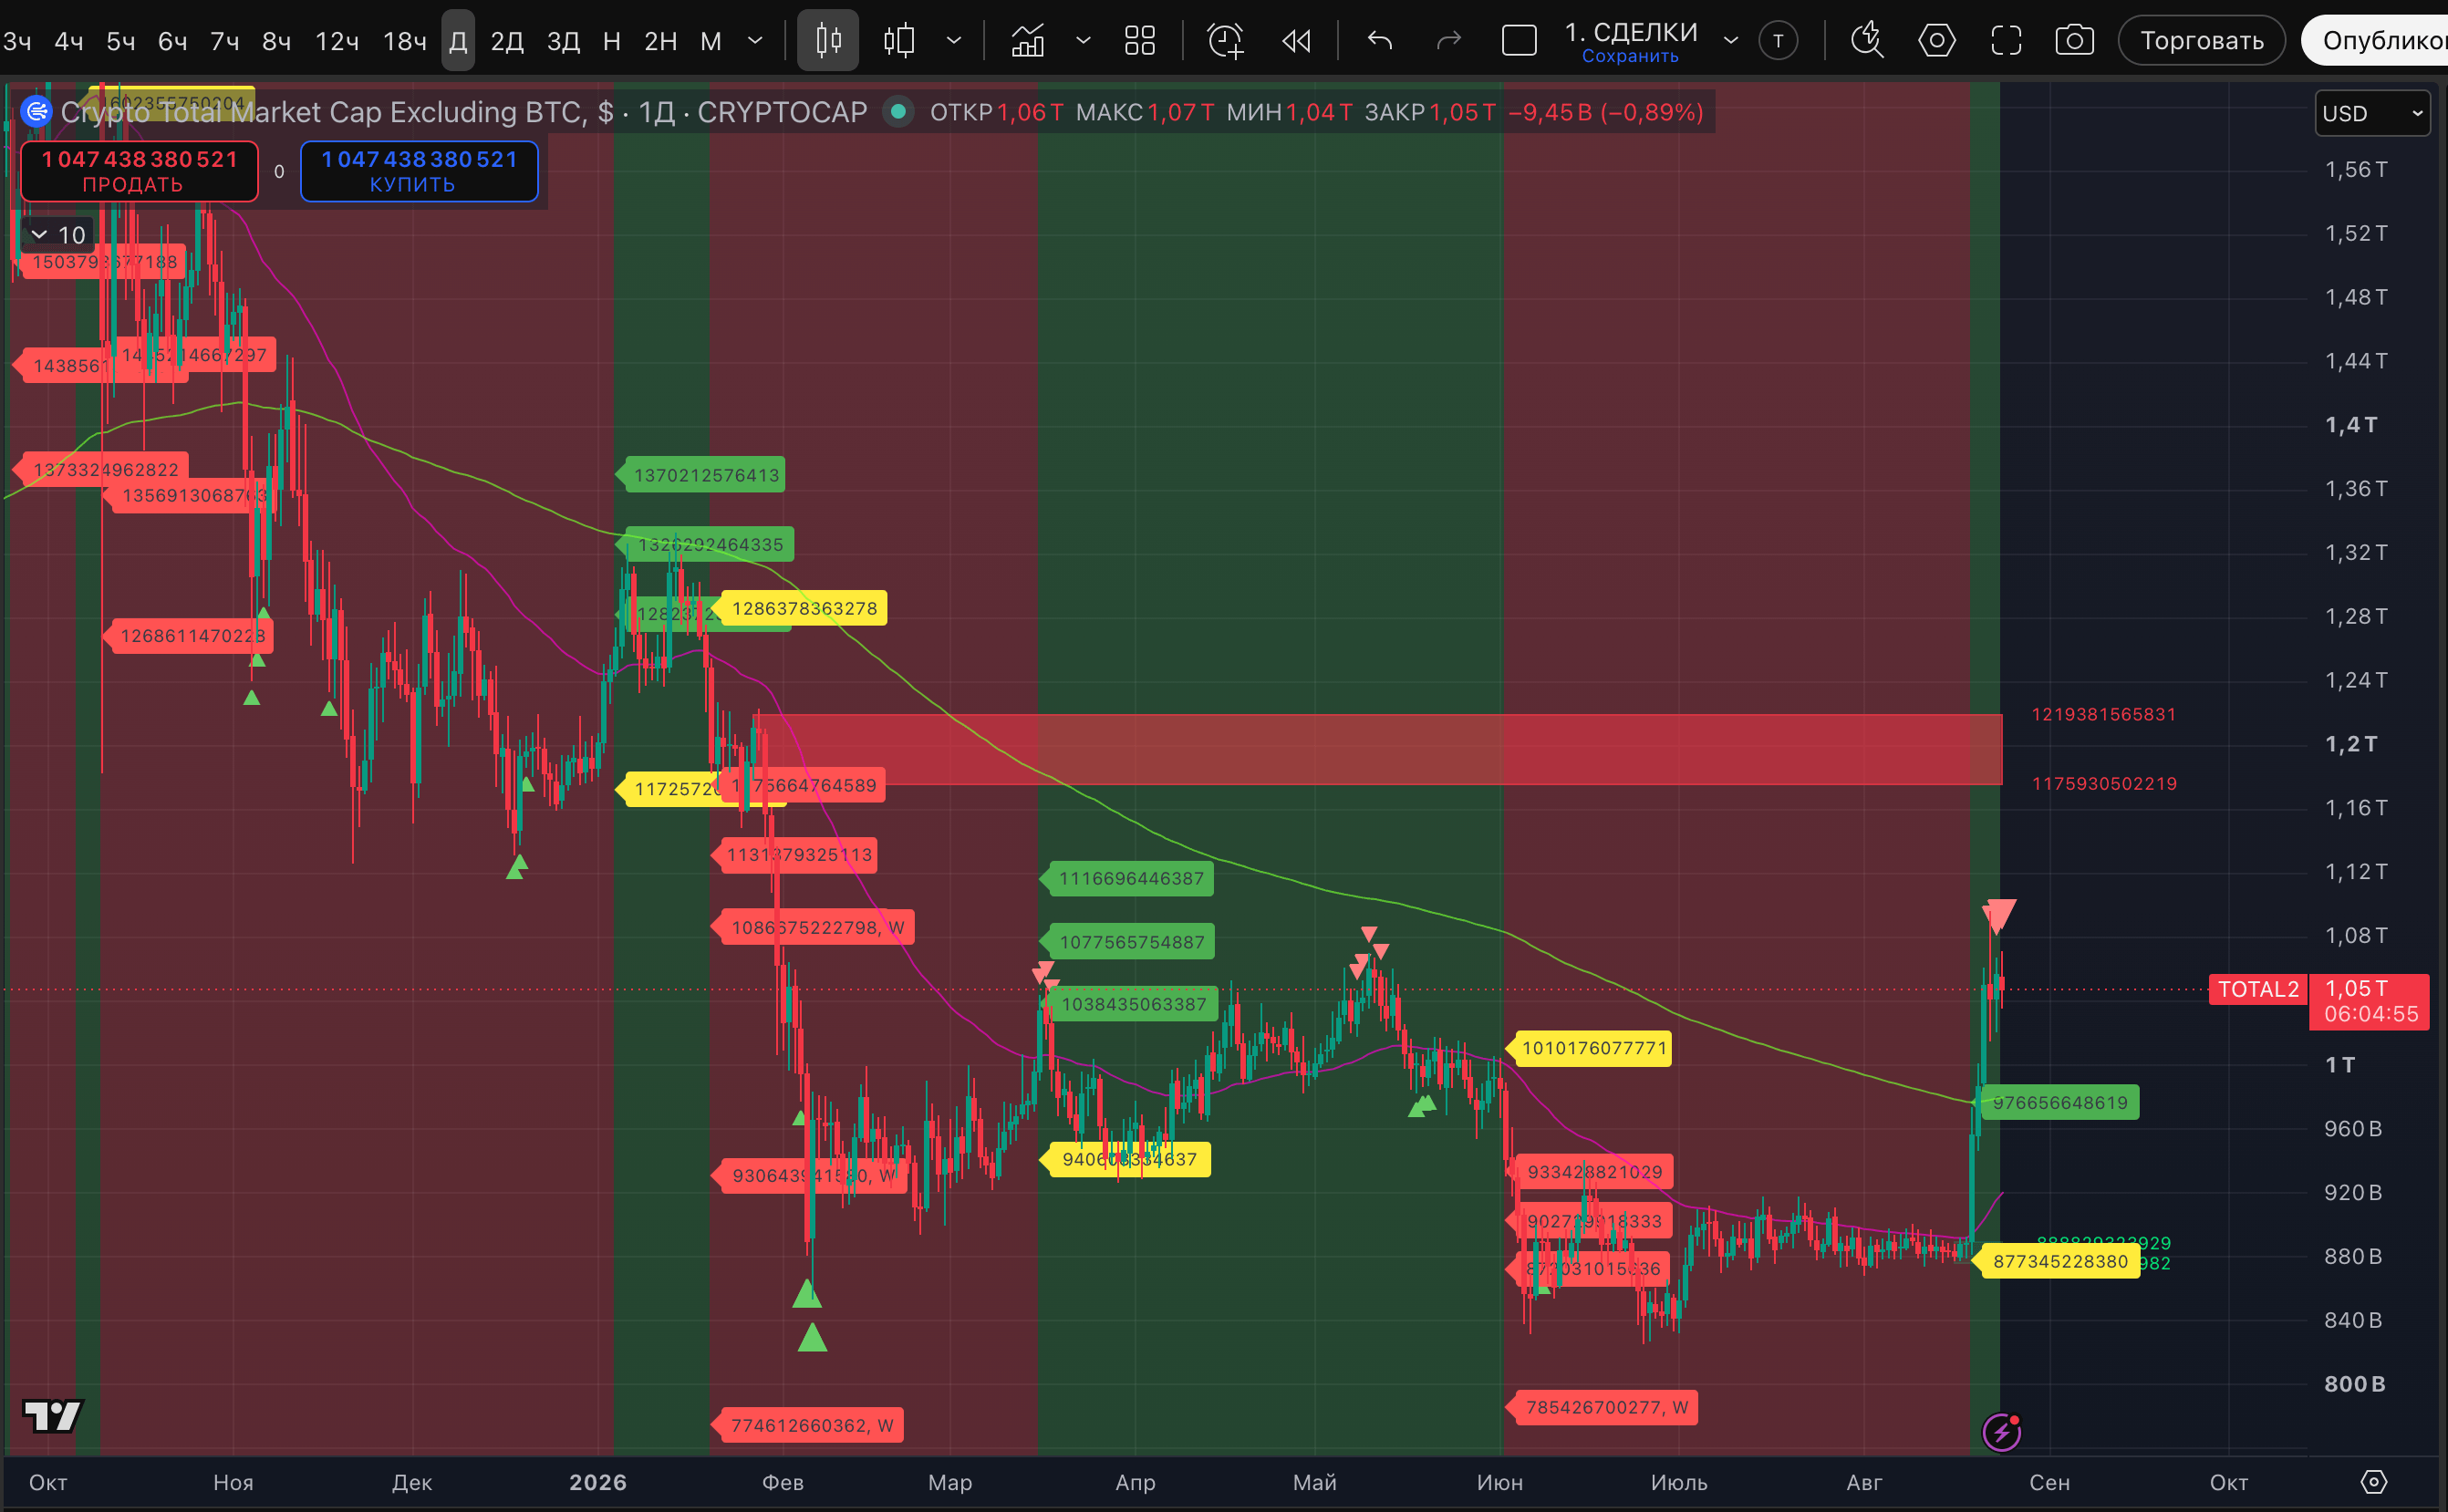
- TOTAL2 (crypto market capitalization excluding Bitcoin),
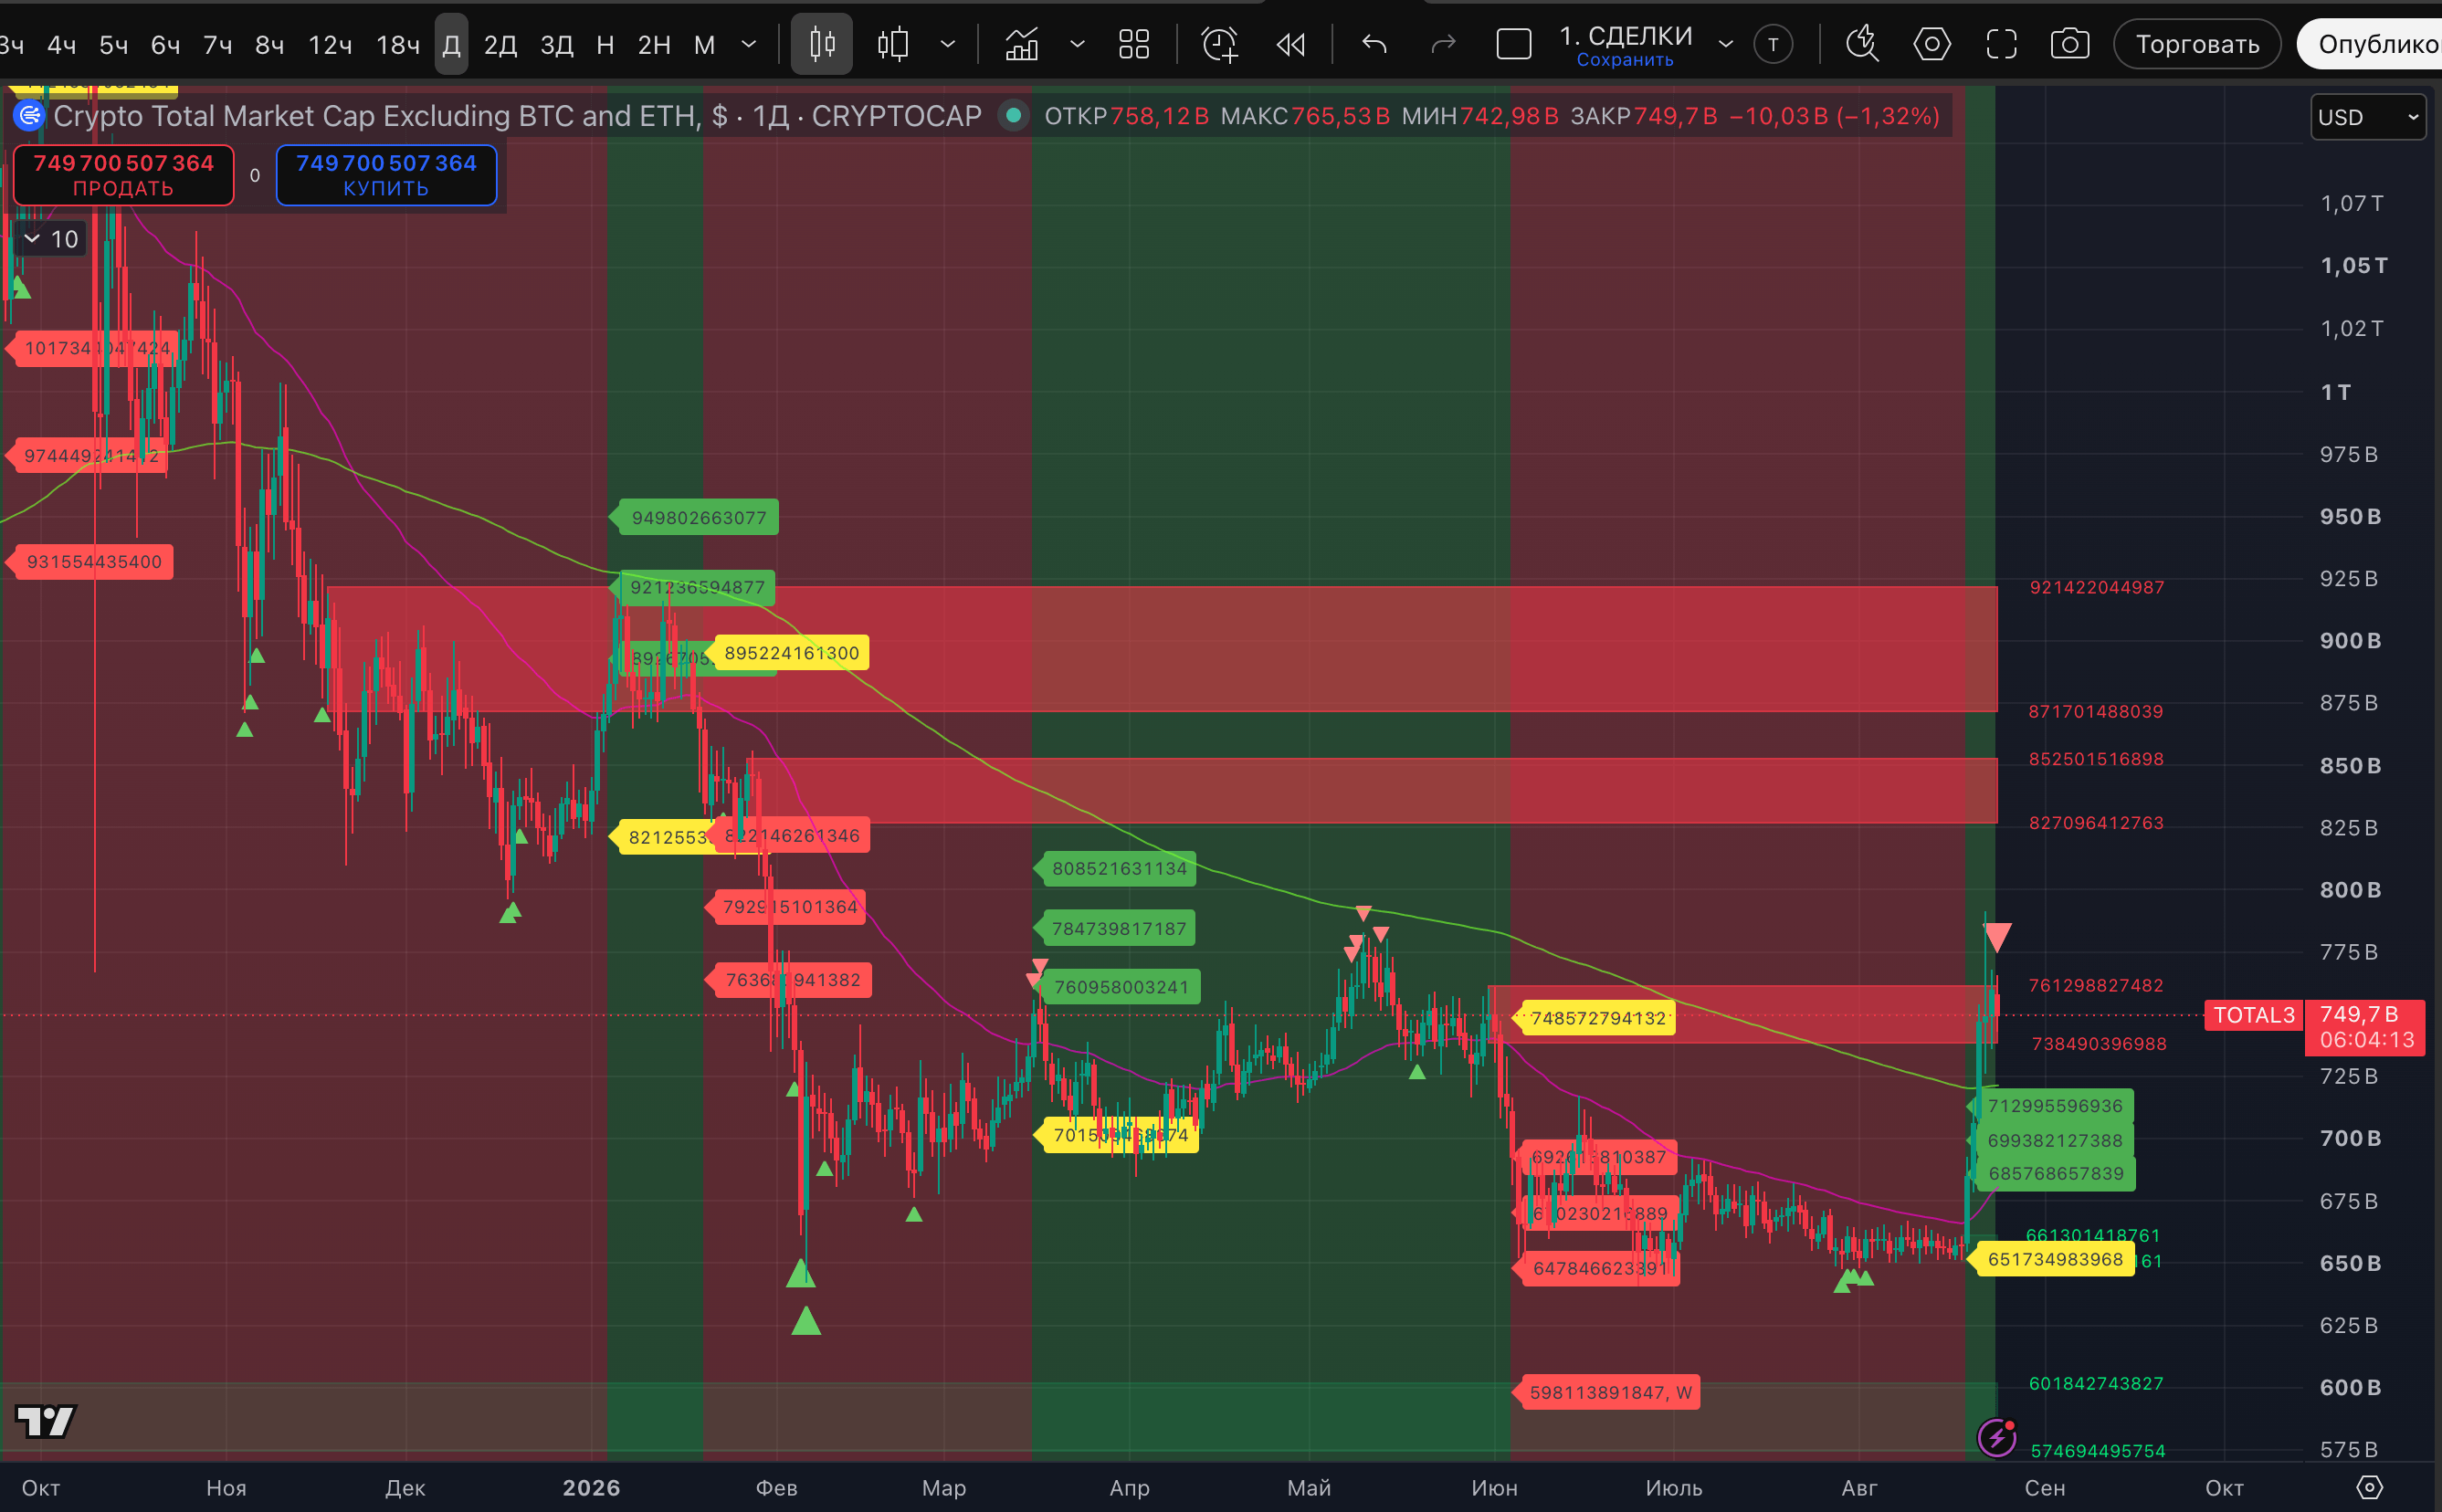
- TOTAL3 (crypto market capitalization excluding Bitcoin and Ethereum),
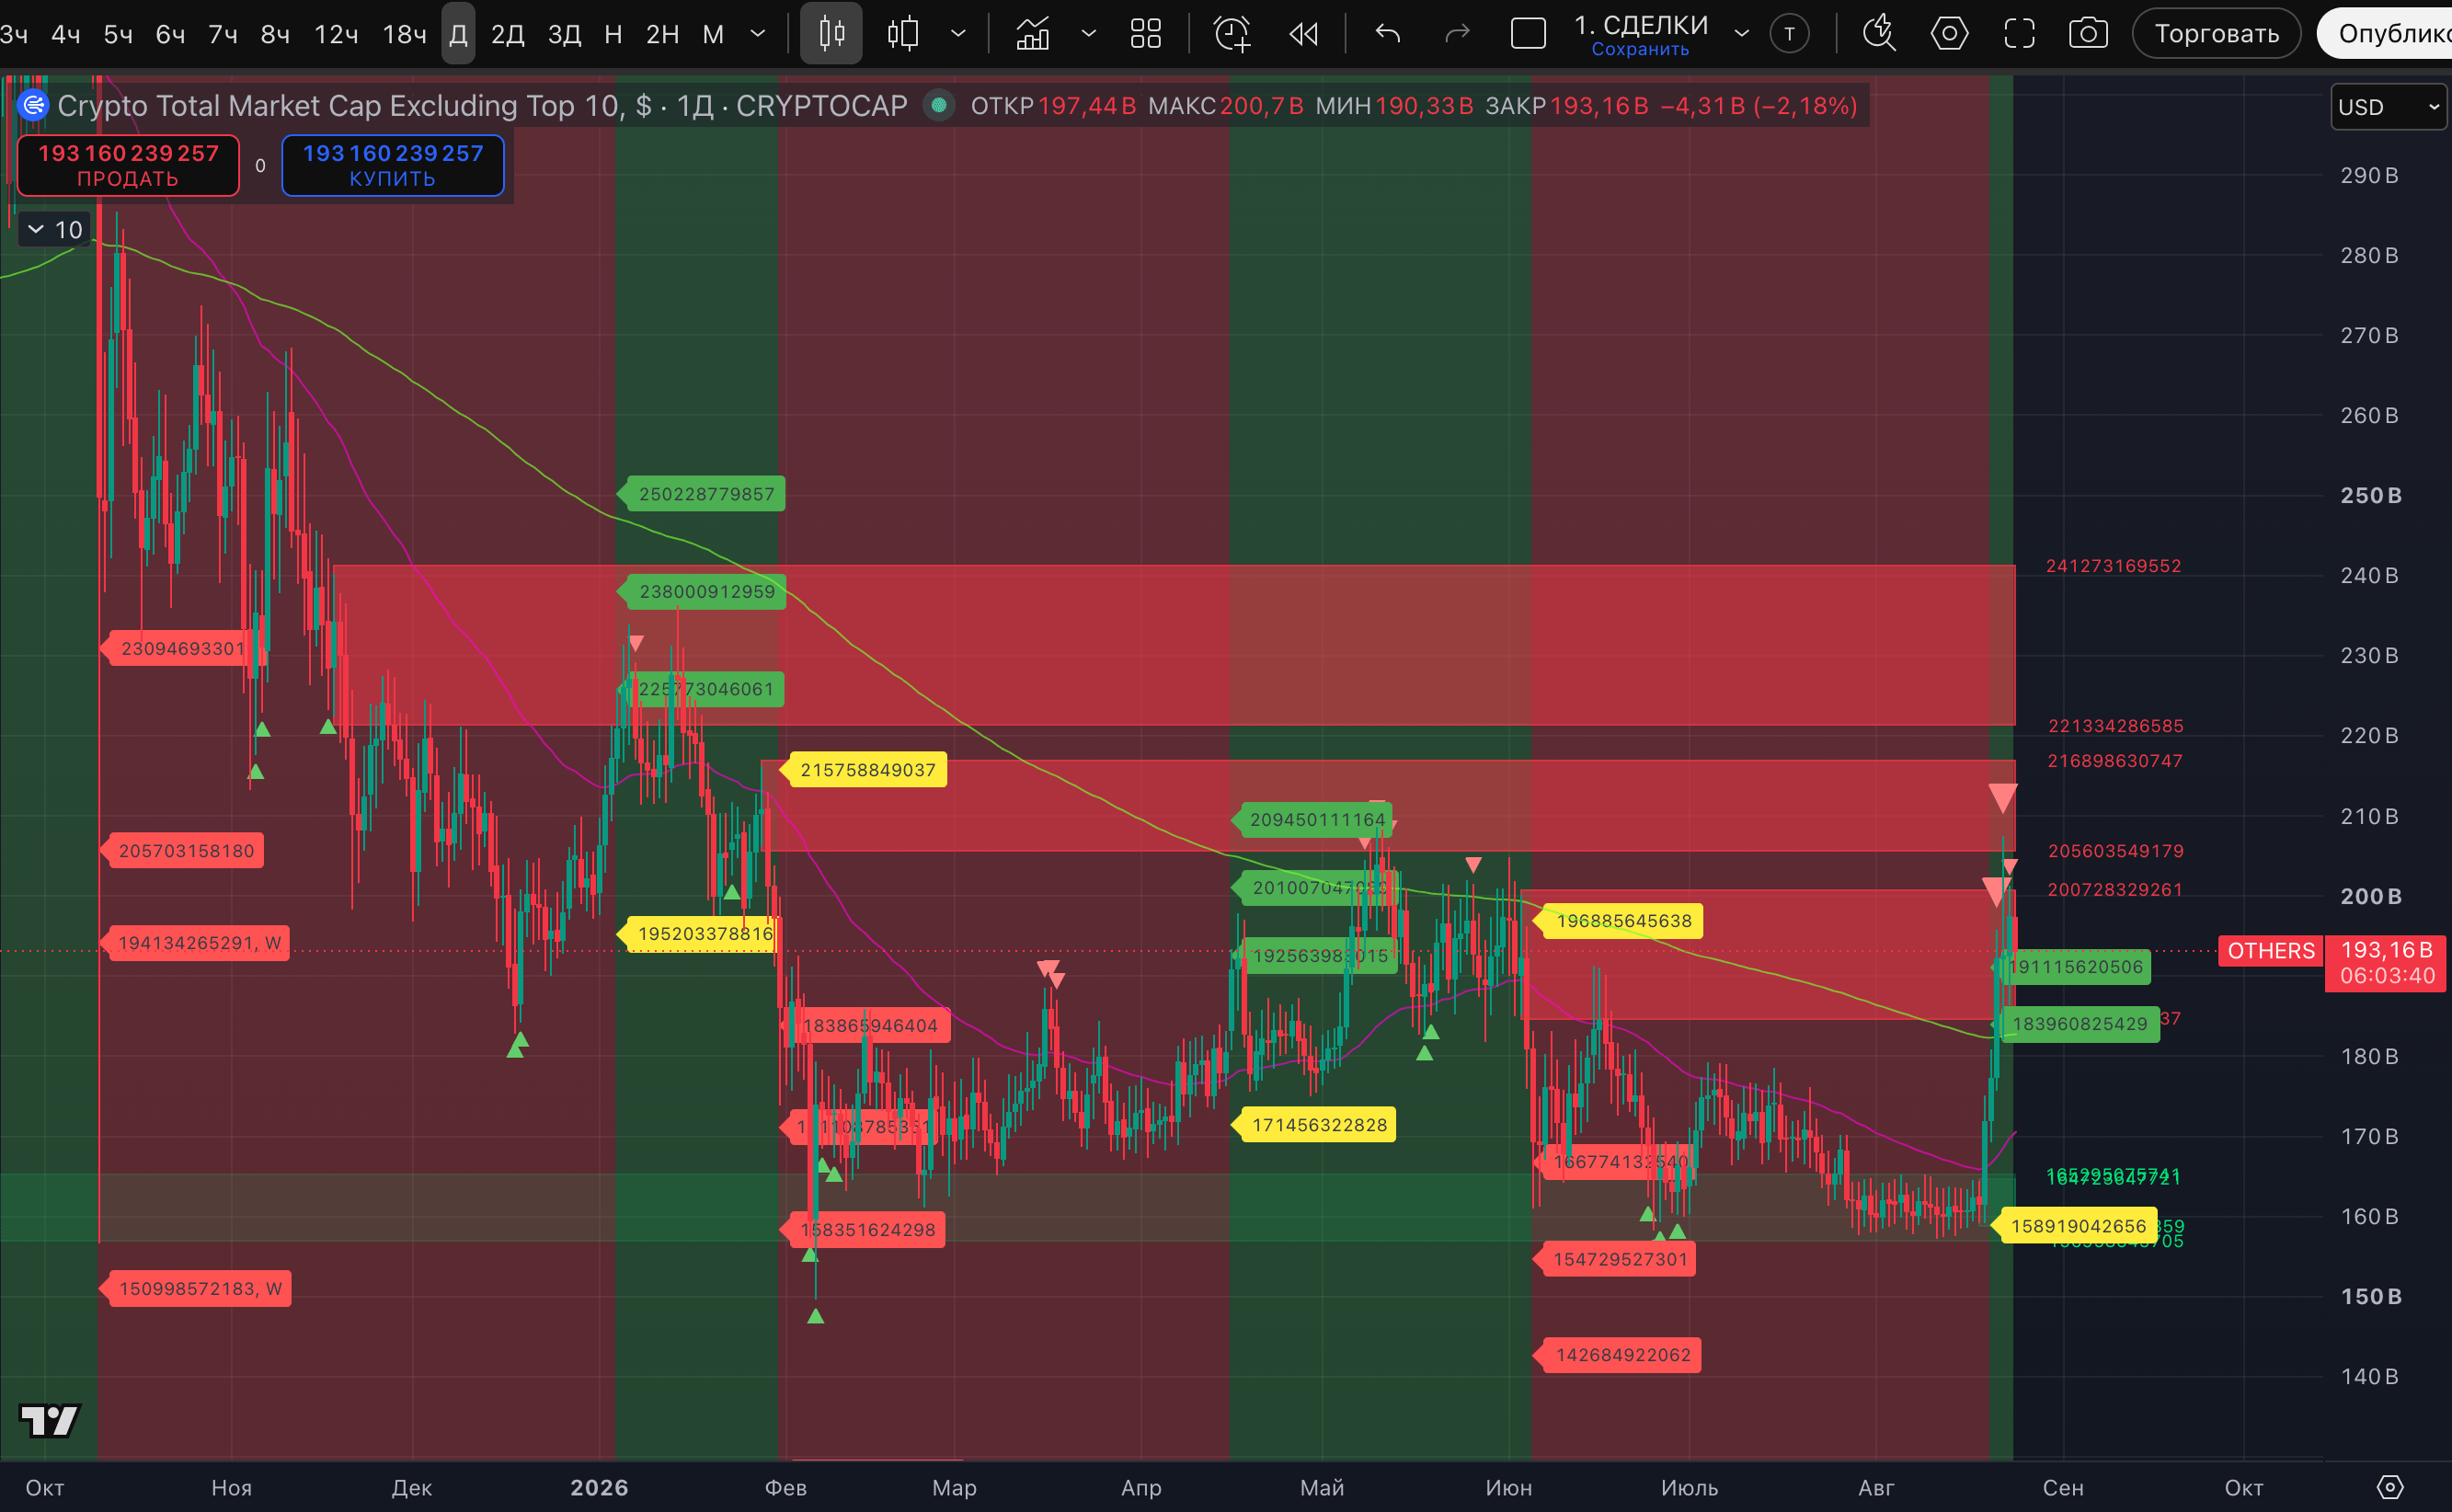
- OTHERS (crypto market capitalization capitalization without TOP-10).
Let’s start with stablecoin dominance.
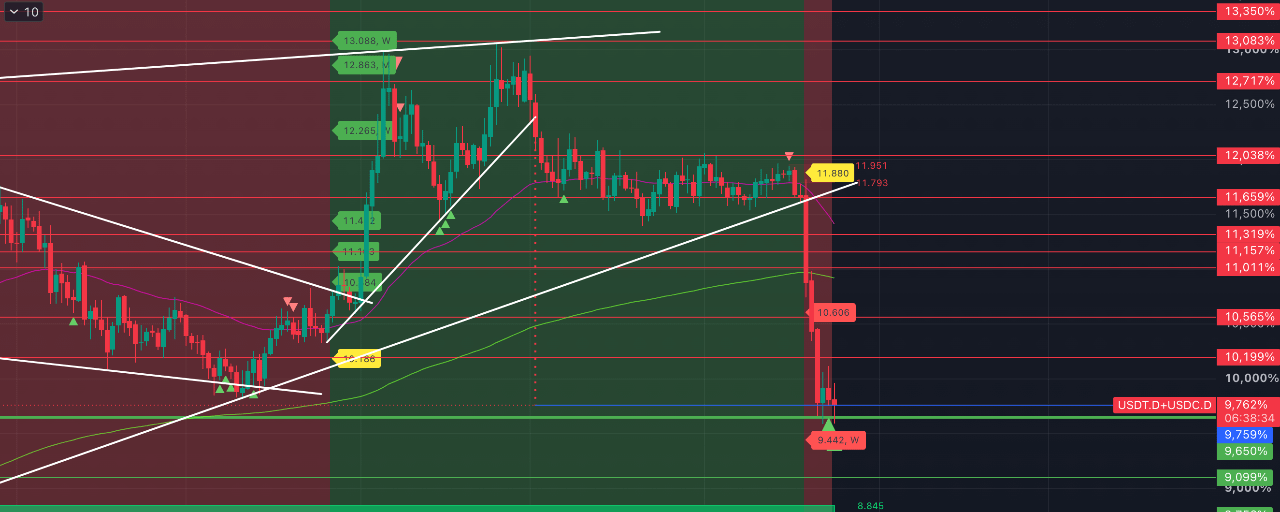
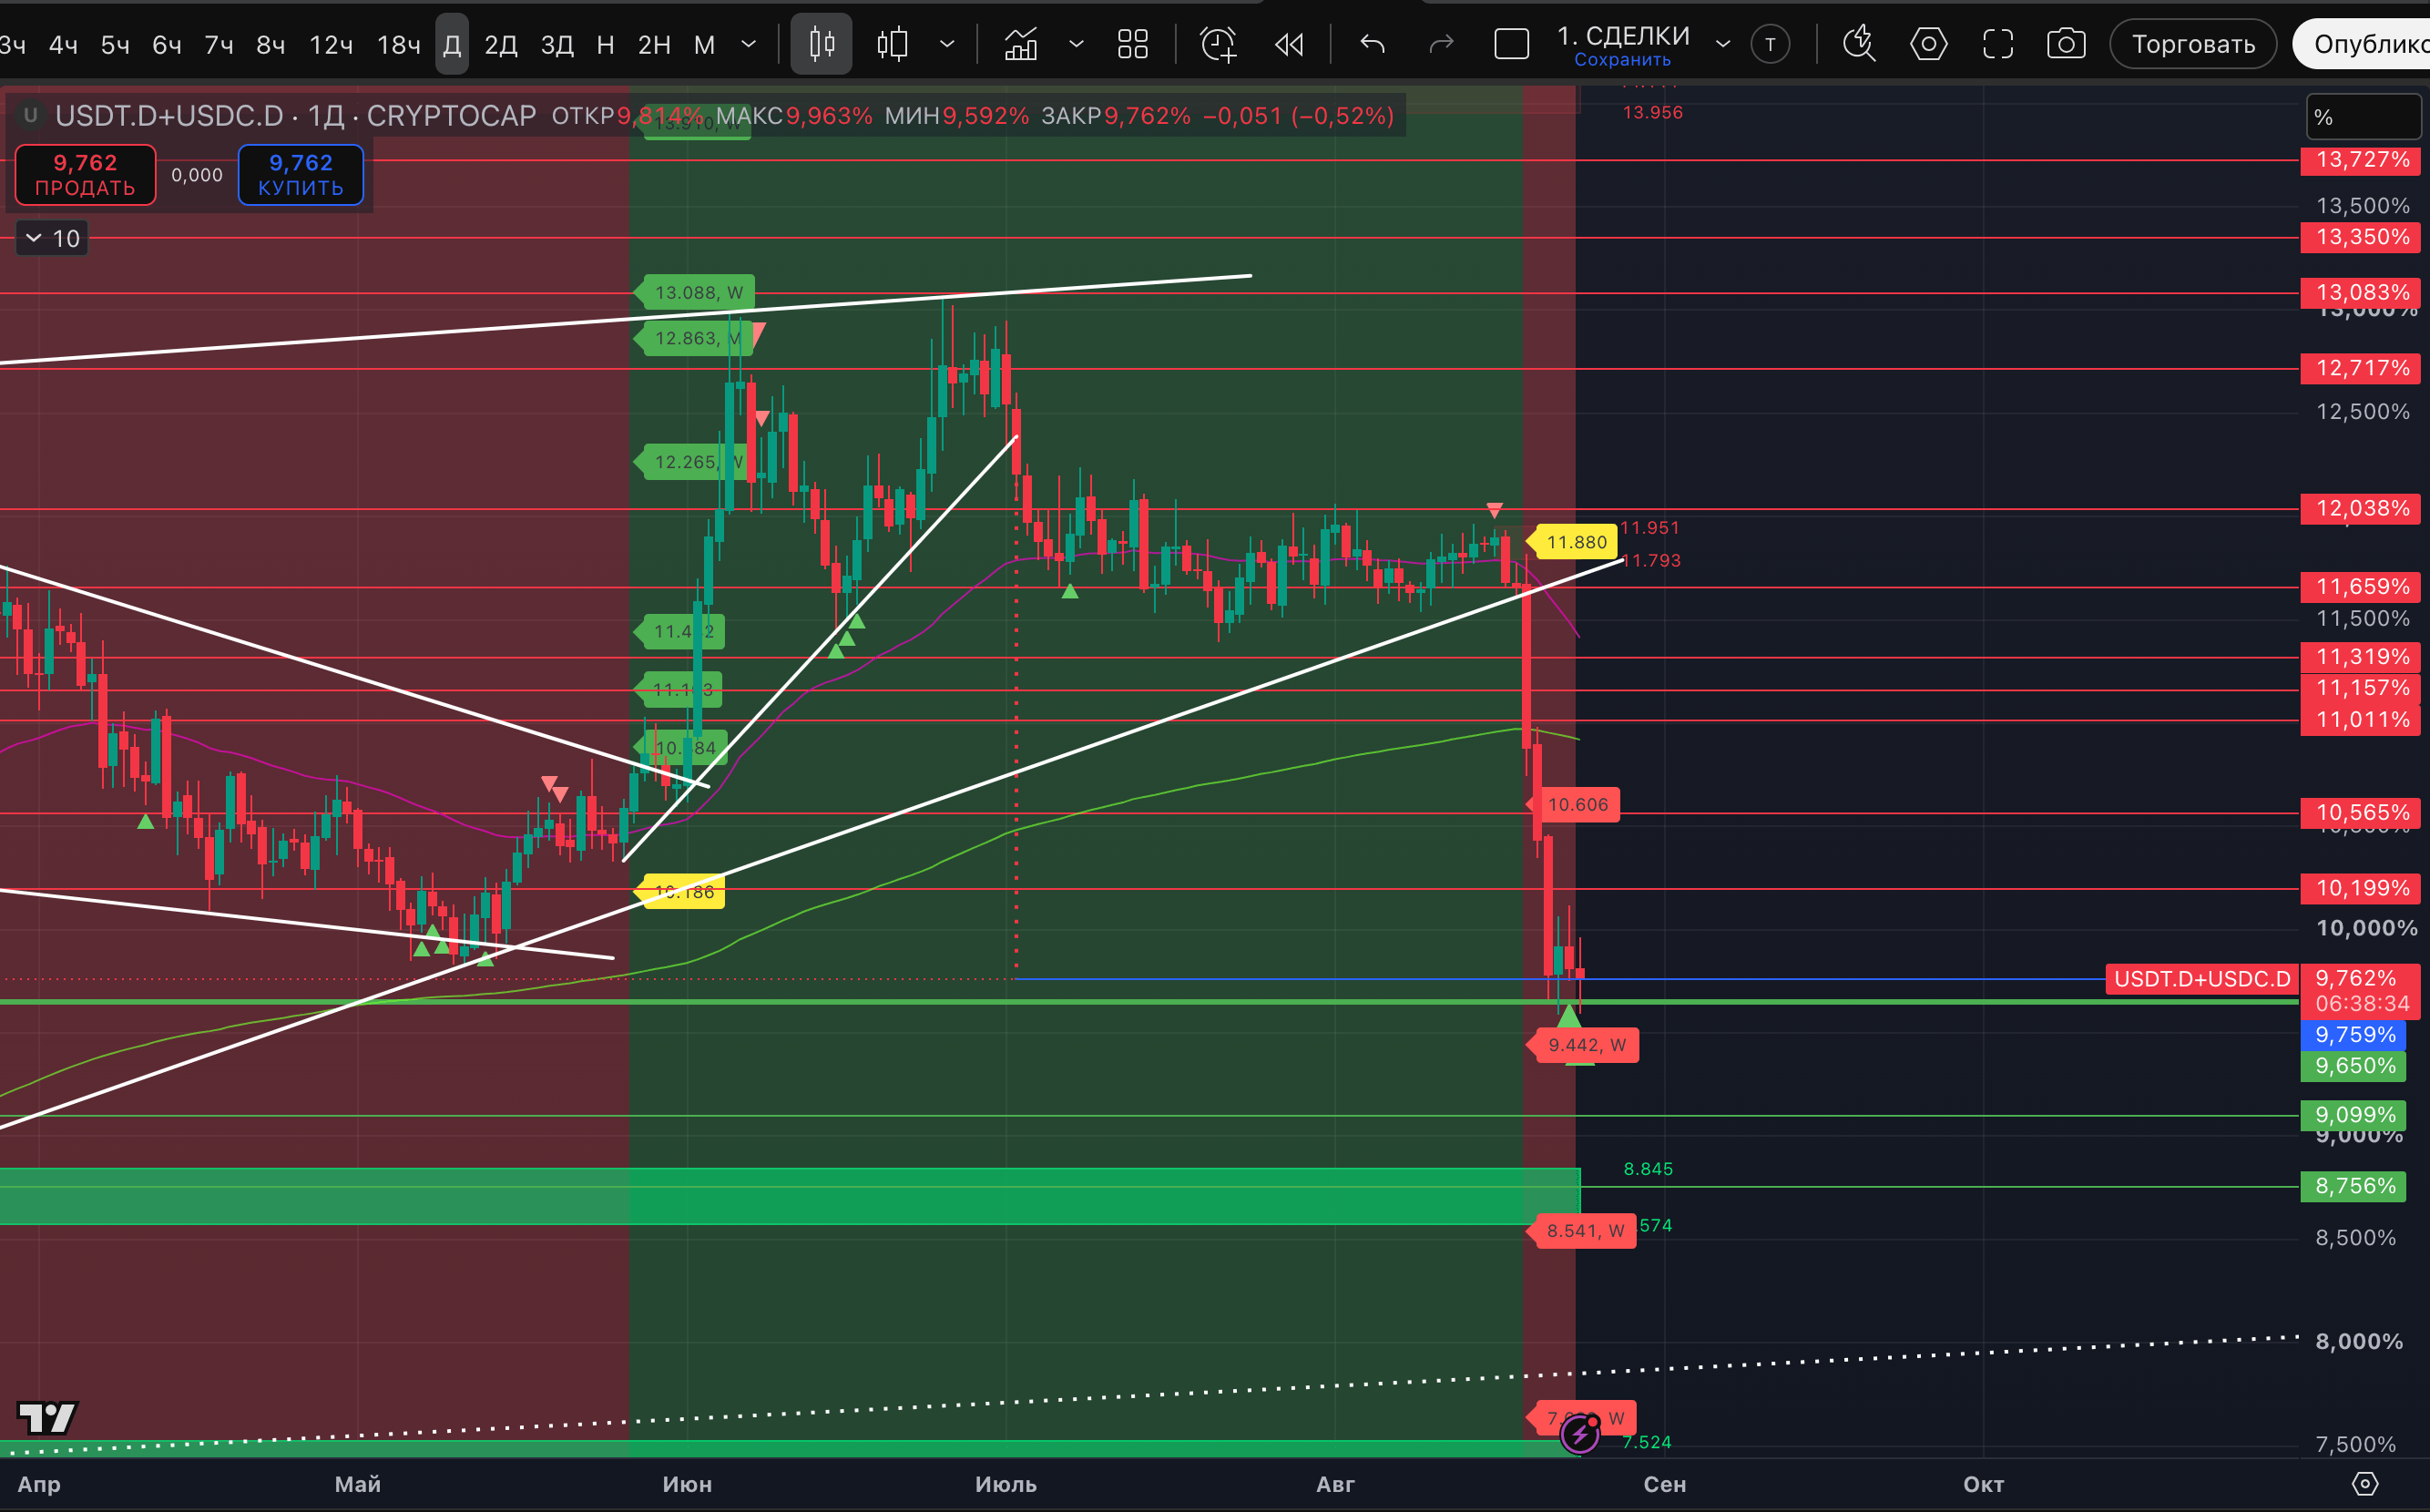
Here, the price within the May–July “Bearish wedge” workout reached the target of 9,759% that was mentioned in the review from July 14. And it retested the 9,650% level, which in our assessment separates the bearish and bullish markets. Stablecoin dominance came to test this extremely important support with two Strong signal potential high labels on the daily timeframe. That’s why from here we still expect a rebound toward the 10,199% or 10,565% levels.
But the most important thing is that the dominance of stablecoins this week showed a shift to a sustained downtrend on the weekly timeframe. First time since October 2025. The baseline targets are 9,442%, 8,541%, 7,639%. At the same time, on the way to continuing the correction there is a zone of 7,950–9,037%, which is unlikely to be broken through quickly.
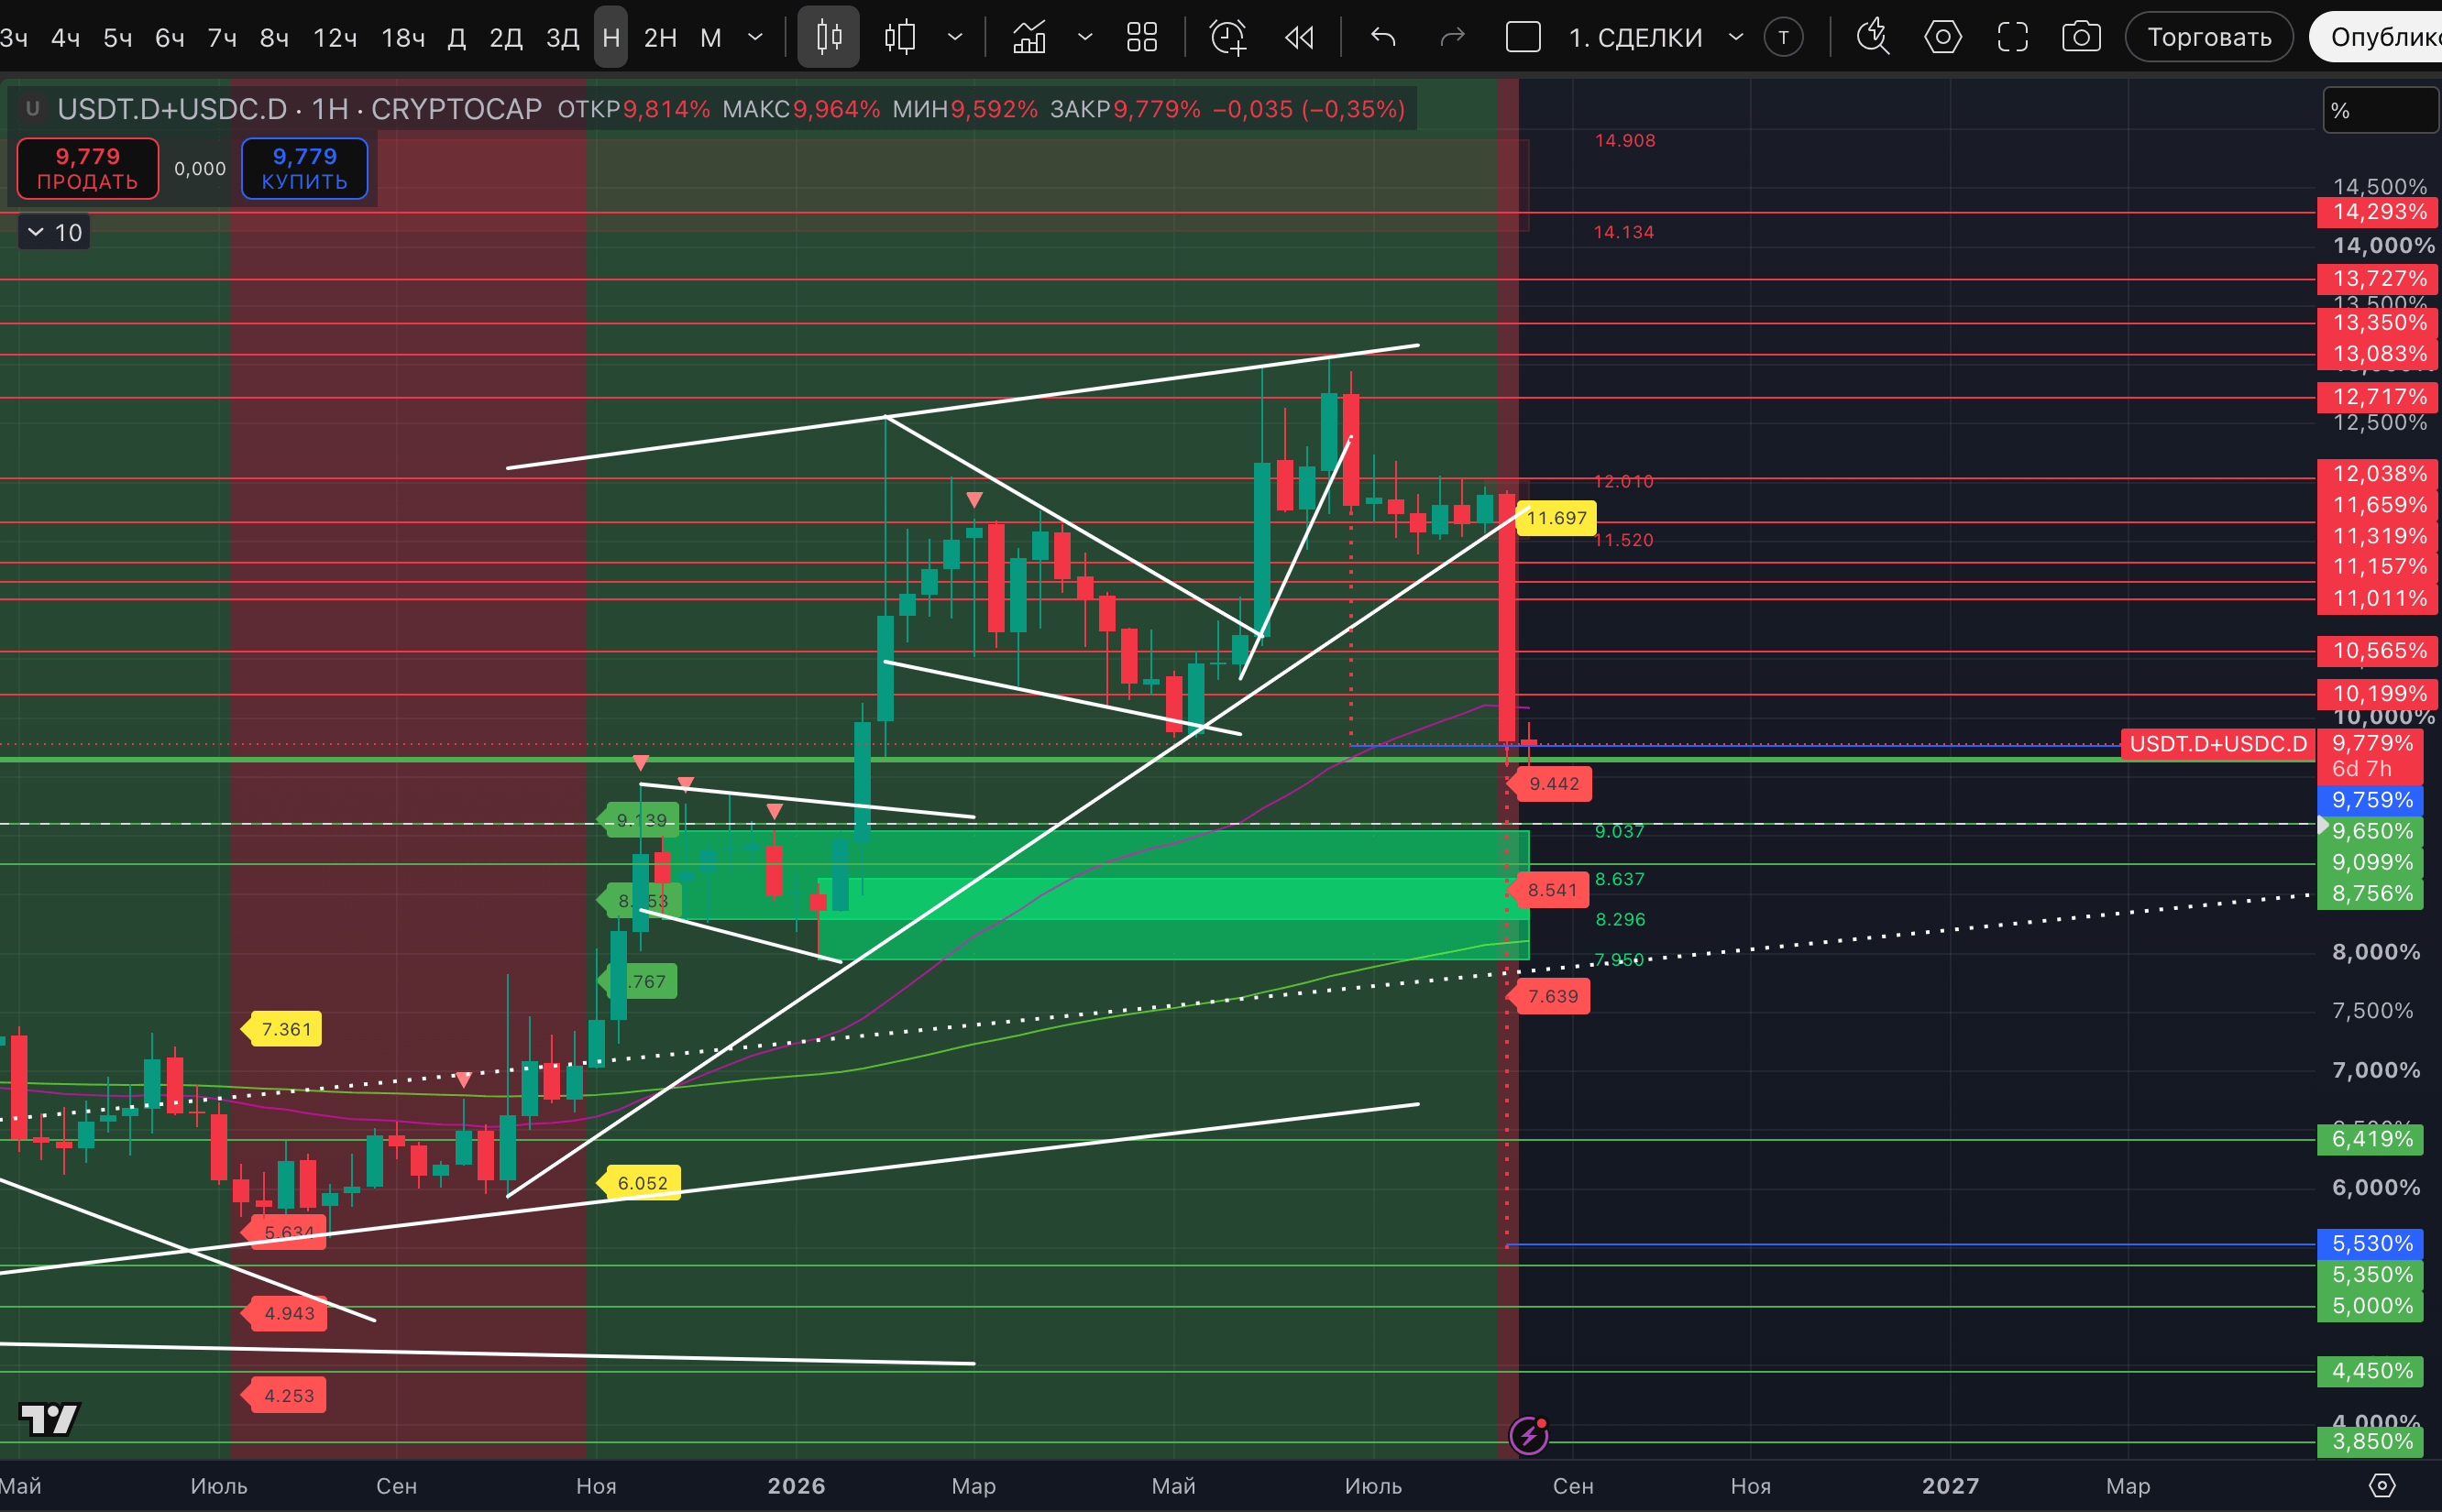
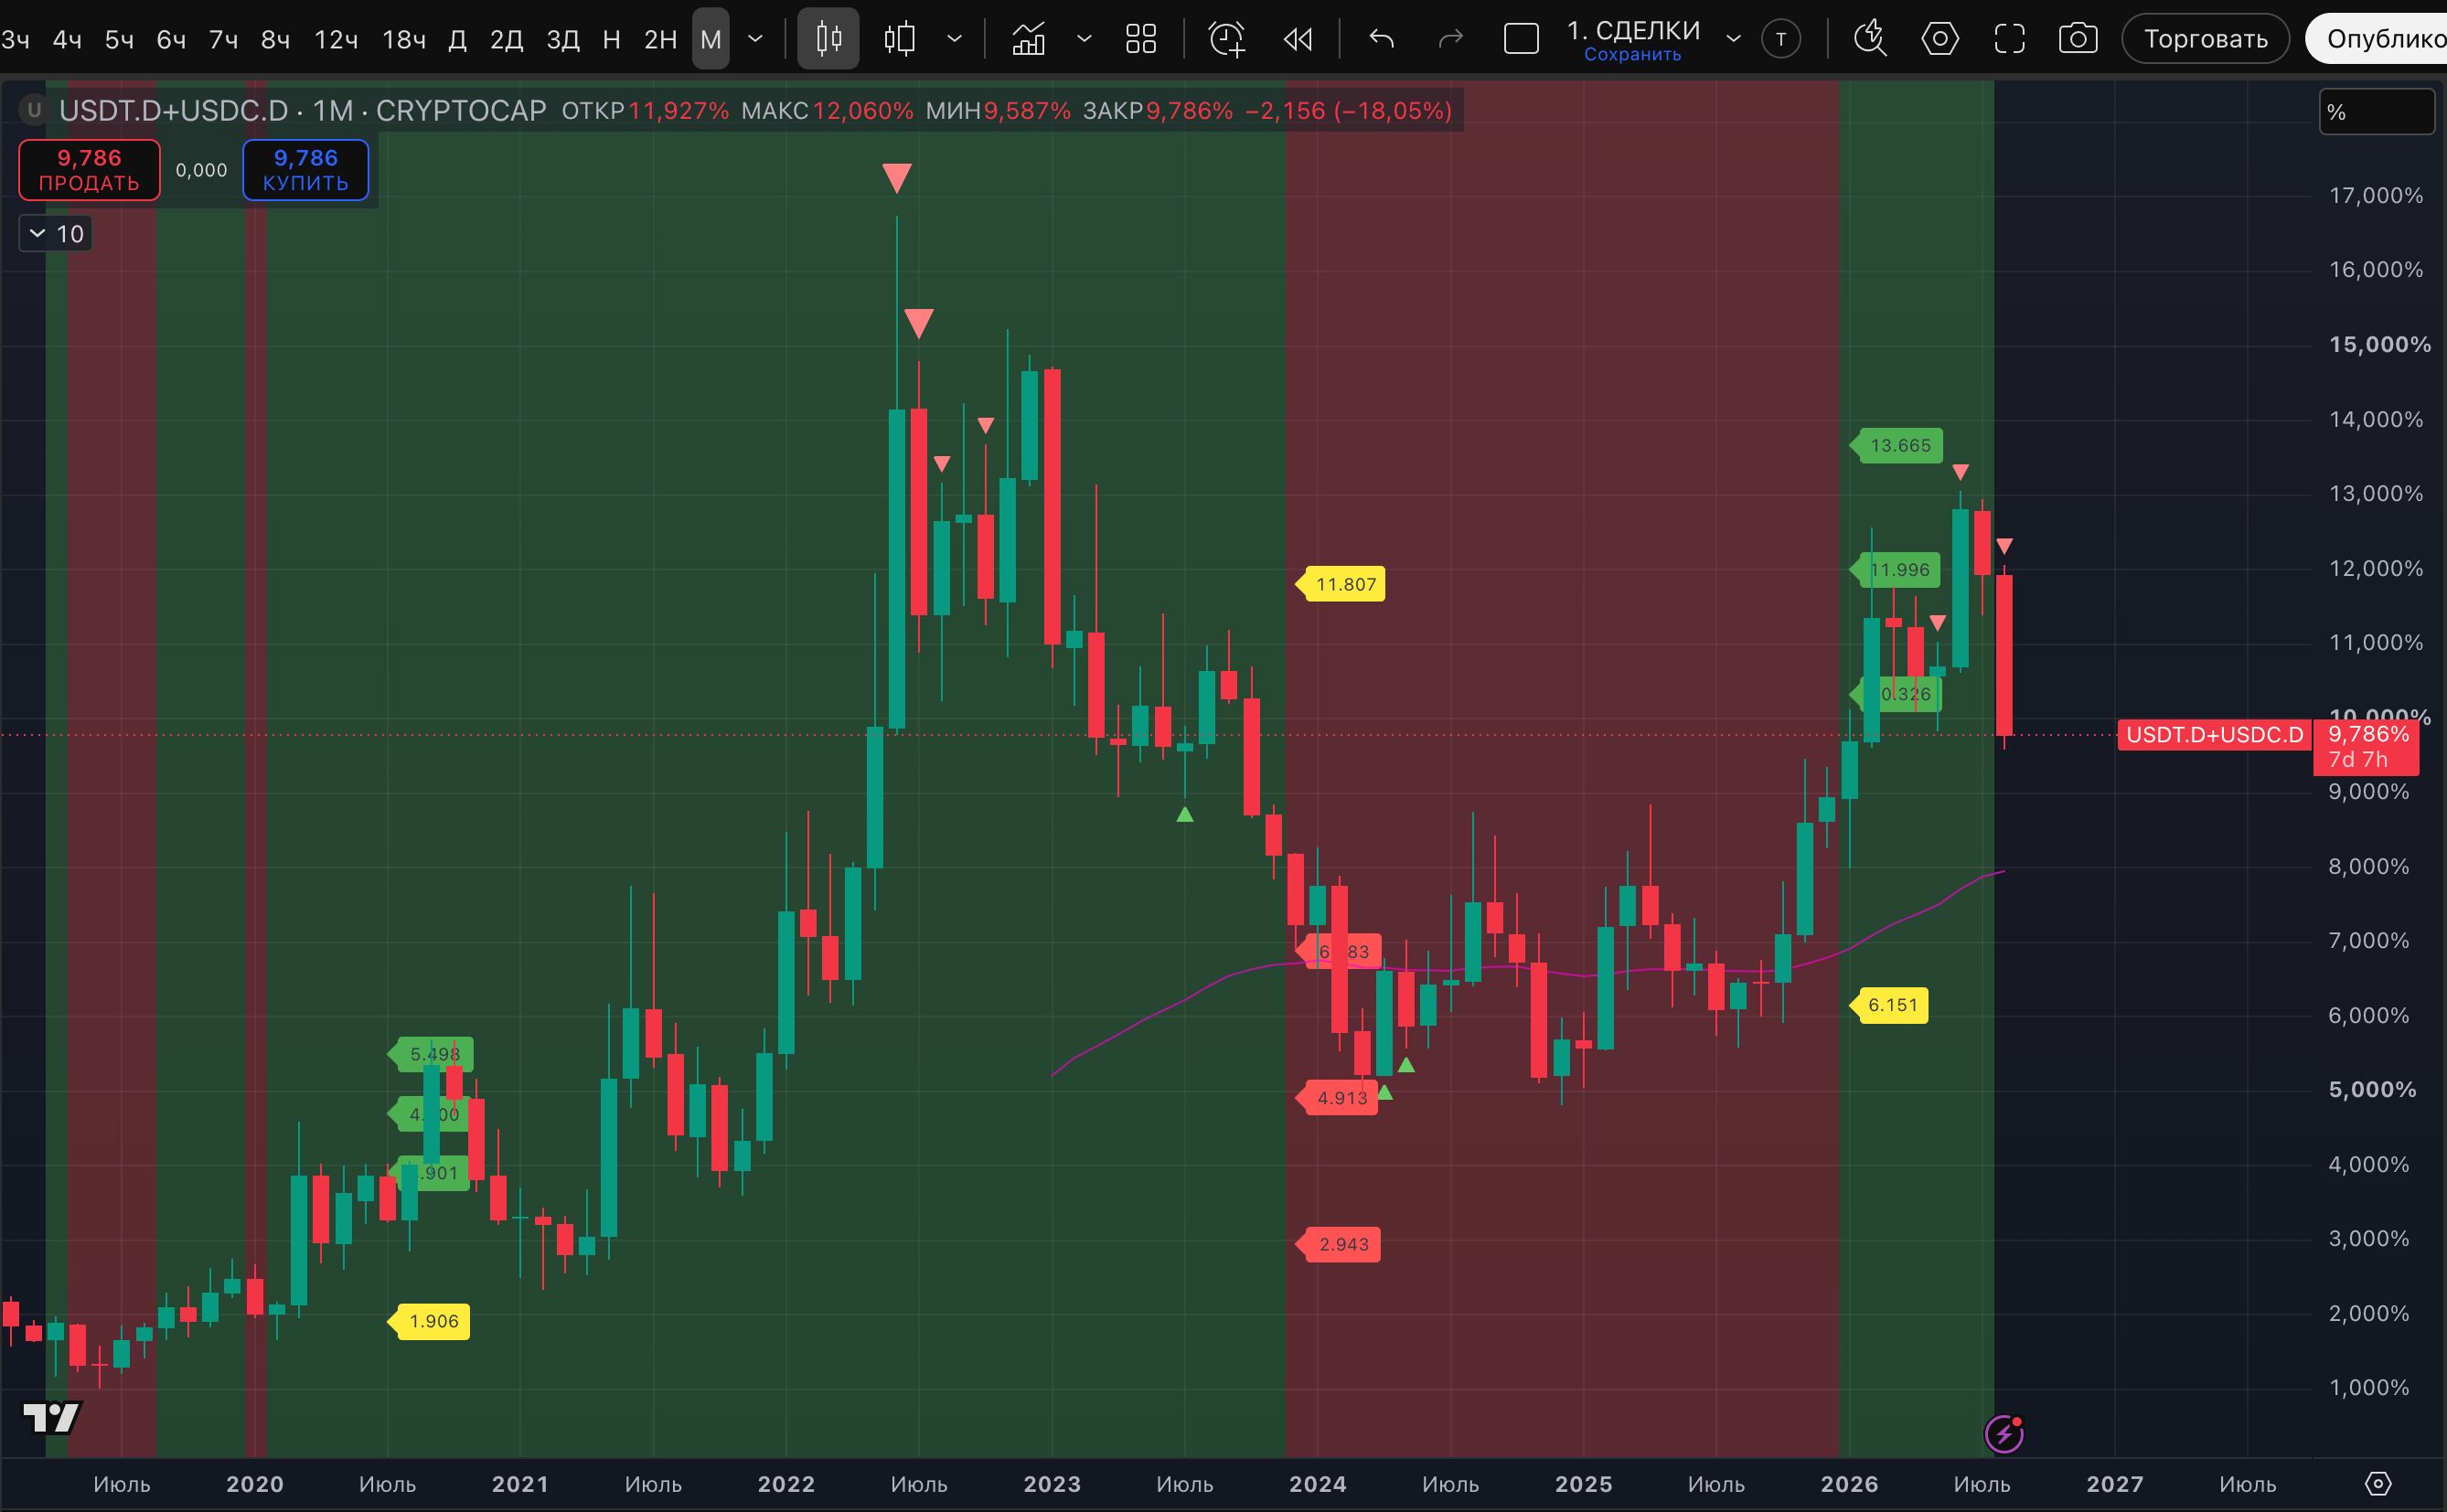
But the very fact that a downtrend is present, and that at the same time the start of working out of the big “Bearish wedge” pattern with a target around 5,530% — that is precisely a confident signal from stablecoin dominance for a bullish market of volatile assets.
It’s the right time to recall our forecasts that the high point of stablecoin dominance was set in June. The labels for a potential high on the monthly timeframe so far appear to be playing out perfectly.
Next, we move on to capitalization charts:
- TOTAL: daily timeframe — an uptrend (but two Strong signal high labels), 3-day timeframe — an uptrend, weekly timeframe — a downtrend (Bitcoin didn’t fully match the bigger picture),
- TOTAL2: daily timeframe — an uptrend (but two Strong signal high labels), 3-day timeframe — an uptrend, weekly timeframe — a downtrend (the uptrend on this timeframe for Ethereum didn’t fully match the bigger picture),
- TOTAL3: daily timeframe — an uptrend (but one Strong signal high label), 3-day timeframe — an uptrend, weekly timeframe — a downtrend,
- OTHERS: daily timeframe — an uptrend (but there are two Strong signal high labels and one normal one; the metric is ready to roll over, and today it’s already trying), 3-day timeframe — an uptrend, weekly timeframe — a downtrend.
So, in total, we have a picture in which all the important capitalization charts have shifted to an uptrend on the 3-day timeframe (even those without BTC, ETH, and TOP-10). This is a VERY strong signal for a bull market. Which now needs to be either confirmed by a shift to an uptrend also on the weekly timeframe. Or refuted by breaking the uptrend on the 3-day timeframe. While the uptrend on the 3-day chart remains in force, we’re clearly biased bullish.
Right now the key question is the mentioned Strong signal potential highs on the daily timeframe. Those exist across all capitalization metrics. At the same time, there is a mirrored Strong signal potential low on the stablecoin dominance chart for USDT+USDC. And together, all of this is a bubbling mix of extremes that should “explode” with a sell-off of the overbought market. If we’re talking about TOTAL, then a drop from the current $2.64T toward the $2.41T area, where the 200 EMA sits, seems likely. Testing this moving average would be the least painful scenario for all capitalization metrics.