#btc #bullish #trap #fyp #foryoupedia
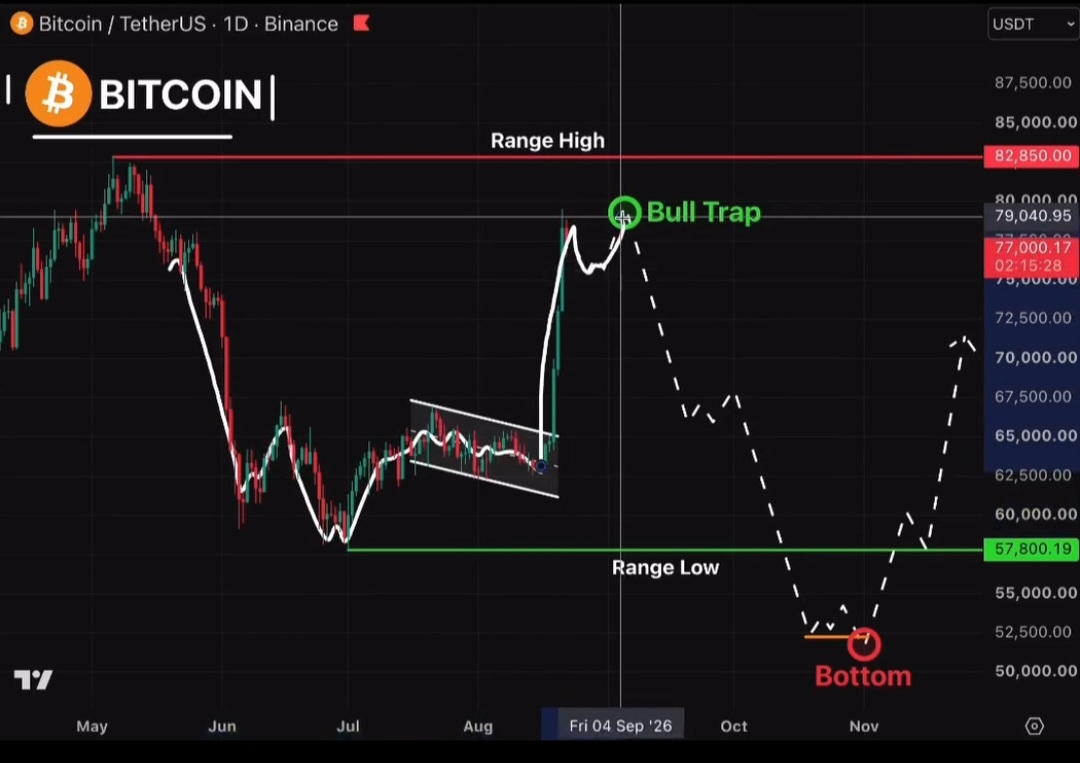
Data shows that upward movement toward $78K is often a "liquidity sweep"—clearing liquidity to trap retail traders in FOMO before a major distribution by smart money.
MVRV Z-Score Indicator: Currently it is in the range of 0.24–0.5, which historically indicates an accumulation area or bottoming. However, if there is a drastic dump from $78K, this indicator could return to the extreme negative zone, confirming the "final flush" phase.
Whale Behavior: On-chain data from Binance and other platforms shows an increase in whale inflows (1,000–10,000 BTC) over the past few weeks. This often serves as a sign of preparation for high volatility or asset redistribution.
2. Key Level Analysis: 78K, 57K, and $48K
Your trading plan has a logical technical structure:
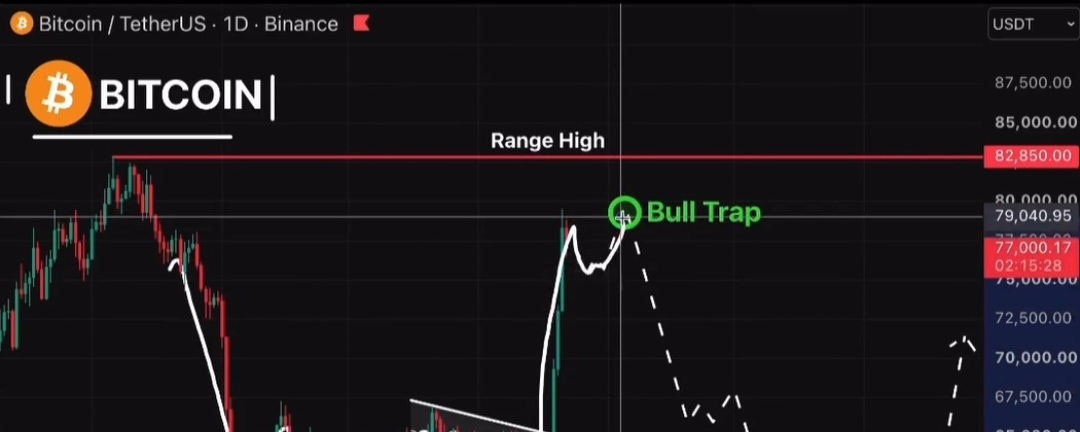
$78K (Resistance/Sweep Zone): This area acts as a "bull trap." If the price fails to hold this level and forms a lower high, bearish confirmation will be very strong.
57K (Critical Support/Acceptance): This is the main line of defense. Technical data shows that a weekly close below 57K will pave the way for further downside. Some analysts refer to the 52K–57K area as the last structural support zone before entering a deep bear market.
48K (Mid-Term Target): This target aligns with bearish predictions from several models that expect a correction of 50–60% from the previous cycle peak. The 48K area also coincides with the realized price of many long-term investors, which could trigger a buyback action (capitulation bottom).
3. Macro Context & 2026 Cycle
2026 is predicted to be a transition year or the start of the bearish phase following the 2024 halving.
Decreasing Volatility: VanEck’s August 2026 report says 30-day volatility has fallen to 27.2%, far below the long-term average (80%). This volatility drop often precedes explosive moves, both upward and downward.
Institutional Sentiment: Even though Spot ETFs continue to accumulate, divergence between price and on-chain metrics (such as MVRV not yet reaching the peak of the previous cycle) suggests the market may not be fully mature for a parabolic run—rather, it may be in a dangerous consolidation phase.
4. Conclusion & Strategic Recommendations
Your scenario is valid and high-risk, but it is supported by on-chain data showing buyer exhaustion at the upper levels.
Critical steps to watch:
Breakdown Confirmation: Wait for a daily or weekly close below 57K before adding to the short position, or wait for a buy entry at 48K.
Beware of "Fakeout": Whales often use low volatility to trigger a fake breakout upward to 80K before dropping the price. Make sure you use a tight stop-loss if you take a long position around 78K.
Monitor Exchange Reserves: Watch for whether there is a significant increase in BTC reserves on exchanges (indicating selling pressure) or a decrease (indicating cold accumulation).
Important Note: The crypto market is heavily influenced by global macroeconomic news. Make sure you also monitor the Fed’s interest-rate policy and the US Dollar Index (DXY), because the negative correlation between DXY and BTC is still very strong in 2026.
Disclaimer: This analysis is for educational purposes and not financial advice. Always do your own research (DYOR) before making any investment decisions.