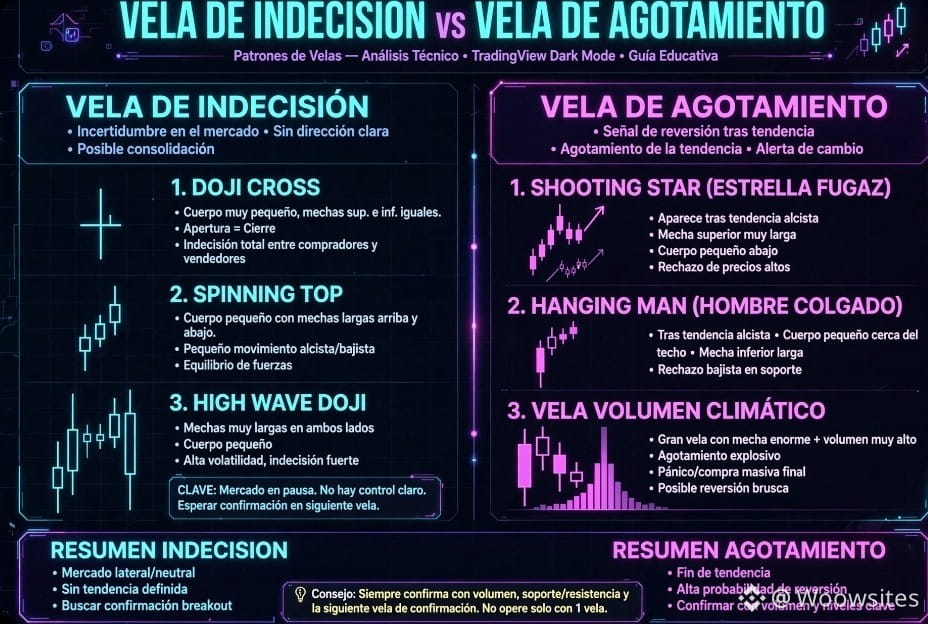
Look, these are two totally different things and this image makes it crystal clear:
INDECISION CANDLE (left) — The market is unsure
This is when nobody can agree. Price goes back and forth but it closes almost where it opened.
• Doji Cross: Open = Close. Perfect cross. Total indecision. • Spinning Top: Small body, wicks above and below. There’s a fight but it ends in a tie. • High Wave Doji: Extremely long wicks on both sides. Lots of volatility, but in the end nobody wins.
What to do: Don’t trade. It’s a yellow light. Wait for the next candle to confirm which way it breaks. If you’re in the middle of nowhere, it’s noise. If it’s at support/resistance, it’s a warning of a potential reversal.
FATIGUE CANDLE (right) — It ran out of fuel
This shows up AT THE END of a strong trend and it screams “we’re done.”
• Shooting Star: After going up a lot, it leaves a huge upper wick and a small lower body. They tried to keep pushing higher and got blown out. • Hanging Man: Also at the end of an upswing, long lower wick. It looks bullish but it’s a trap if it confirms with the next red candle. • Climactic Volume Candle: The most obvious one. Huge candle + record volume. It’s the last breath—panic or final euphoria. A sharp reversal always follows afterward.
Key difference so you don’t get confused:
Indecision = can happen on either side; the market is sideways.
Fatigue = ONLY counts if it comes after a long, clear trend. If there wasn’t a trend before, it’s not fatigue.
$BTC
INDECISION CANDLE (left) — The market is unsure
This is when nobody can agree. Price goes back and forth but it closes almost where it opened.
• Doji Cross: Open = Close. Perfect cross. Total indecision. • Spinning Top: Small body, wicks above and below. There’s a fight but it ends in a tie. • High Wave Doji: Extremely long wicks on both sides. Lots of volatility, but in the end nobody wins.
What to do: Don’t trade. It’s a yellow light. Wait for the next candle to confirm which way it breaks. If you’re in the middle of nowhere, it’s noise. If it’s at support/resistance, it’s a warning of a potential reversal.
FATIGUE CANDLE (right) — It ran out of fuel
This shows up AT THE END of a strong trend and it screams “we’re done.”
• Shooting Star: After going up a lot, it leaves a huge upper wick and a small lower body. They tried to keep pushing higher and got blown out. • Hanging Man: Also at the end of an upswing, long lower wick. It looks bullish but it’s a trap if it confirms with the next red candle. • Climactic Volume Candle: The most obvious one. Huge candle + record volume. It’s the last breath—panic or final euphoria. A sharp reversal always follows afterward.
Key difference so you don’t get confused:
Indecision = can happen on either side; the market is sideways.
Fatigue = ONLY counts if it comes after a long, clear trend. If there wasn’t a trend before, it’s not fatigue.
$BTC