8.22 【Aerial Refueling? Consolidation Area First Appears】
BTC
recap this briefly. This wave of violent rally pushed above 10,000+. Around 7.8, signs of slowing finally appeared. But the trend isn’t over yet.
First the conclusion: near the bull/bear boundary, the trend is still bullish. To short, you need more candles and clearer structure. For short-term trading, it’s a small consolidation range.
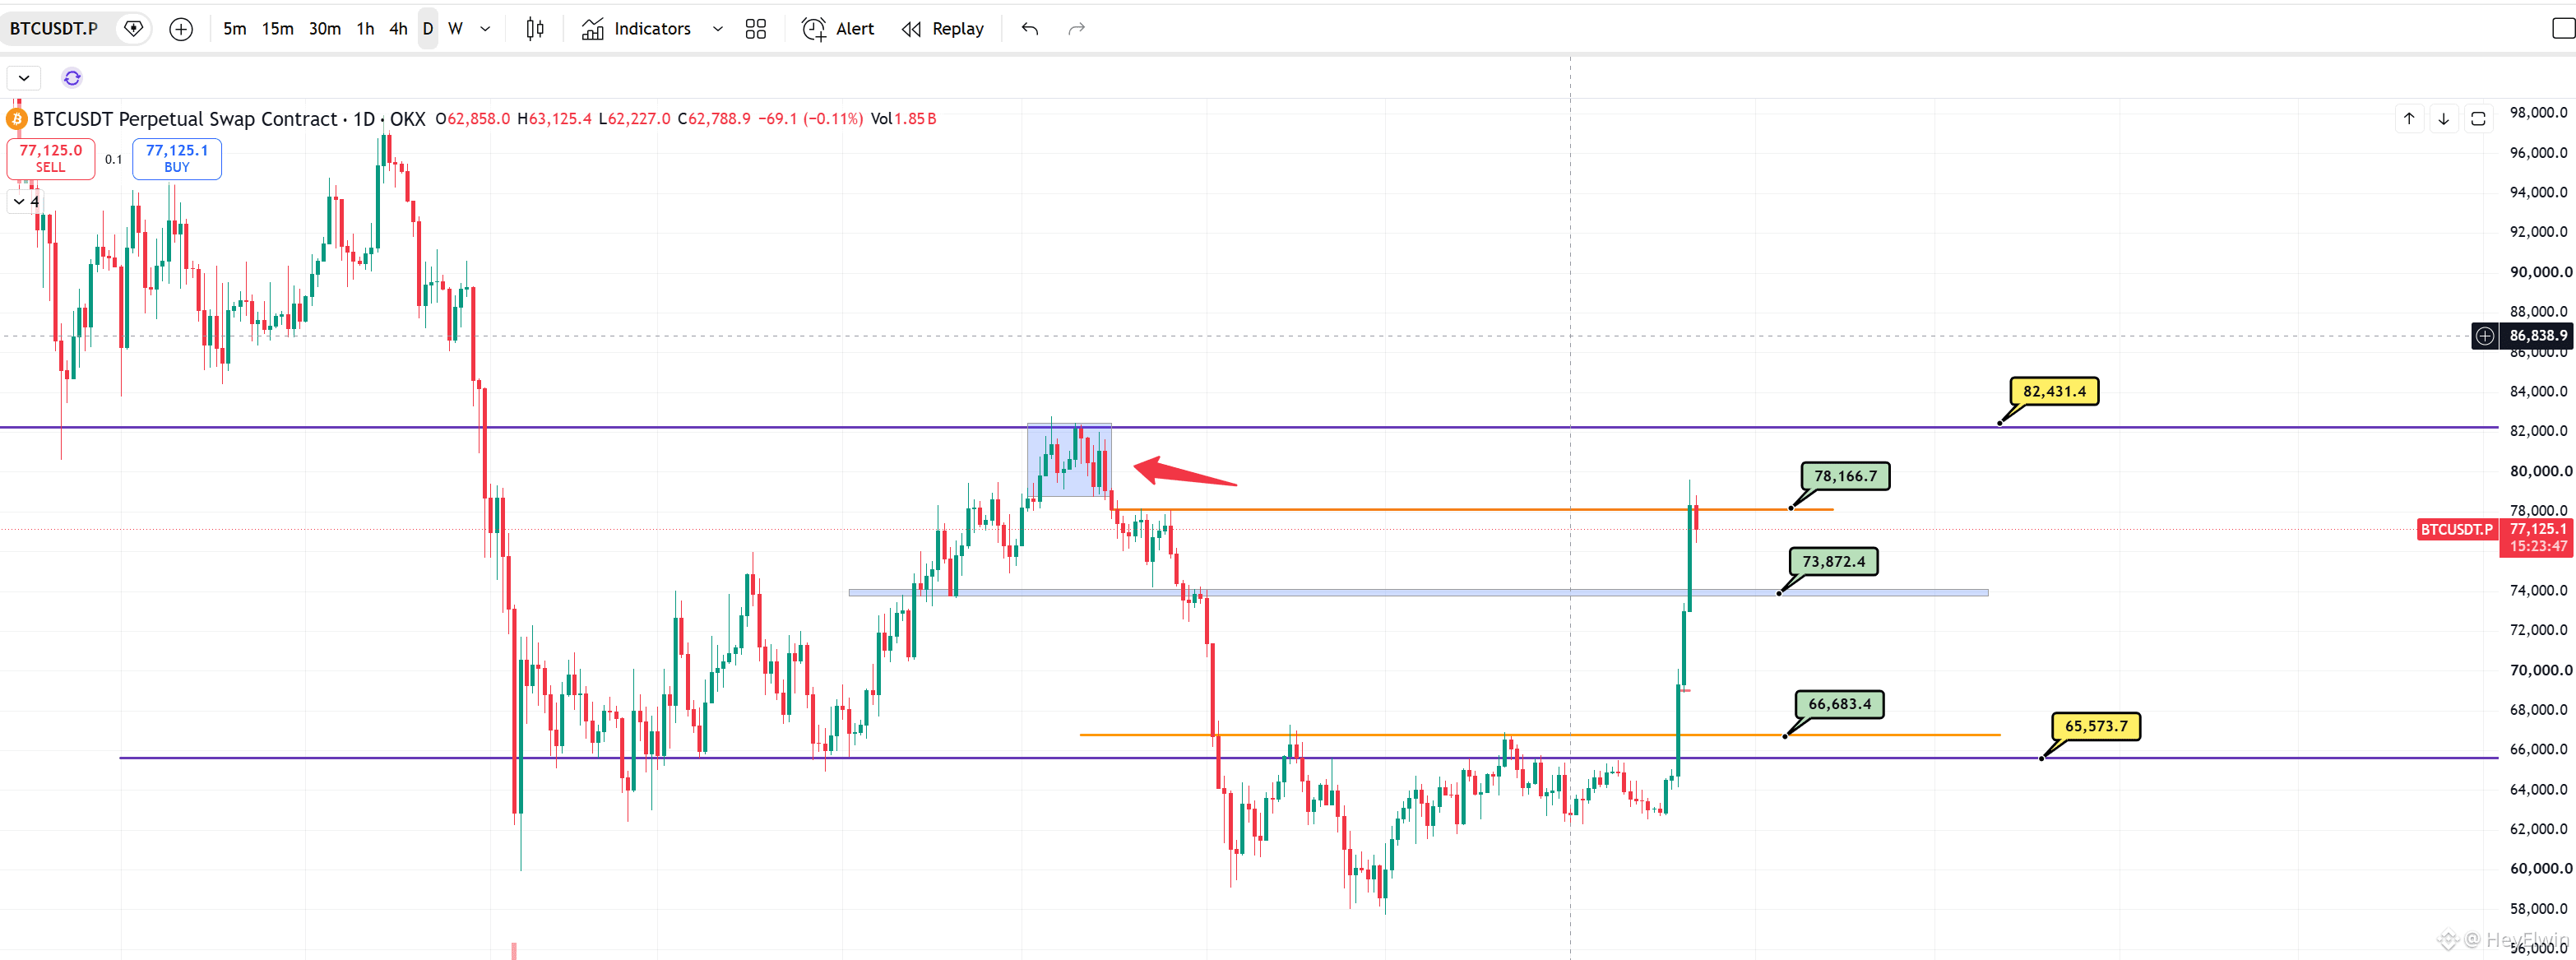
Figure 1. The weekly resistance at 8.25 is still there. As for whether this is a “bull return,” this is a key level—see the detailed weekly analysis from the past few days.
The larger timeframe support and resistance shown in the chart remain valid. Currently, price is stalling at the daily resistance around 7.8. With this kind of rally, a small pullback is completely normal. As long as 7.4 doesn’t break, there’s no need to worry about entering a price “vacuum” zone.
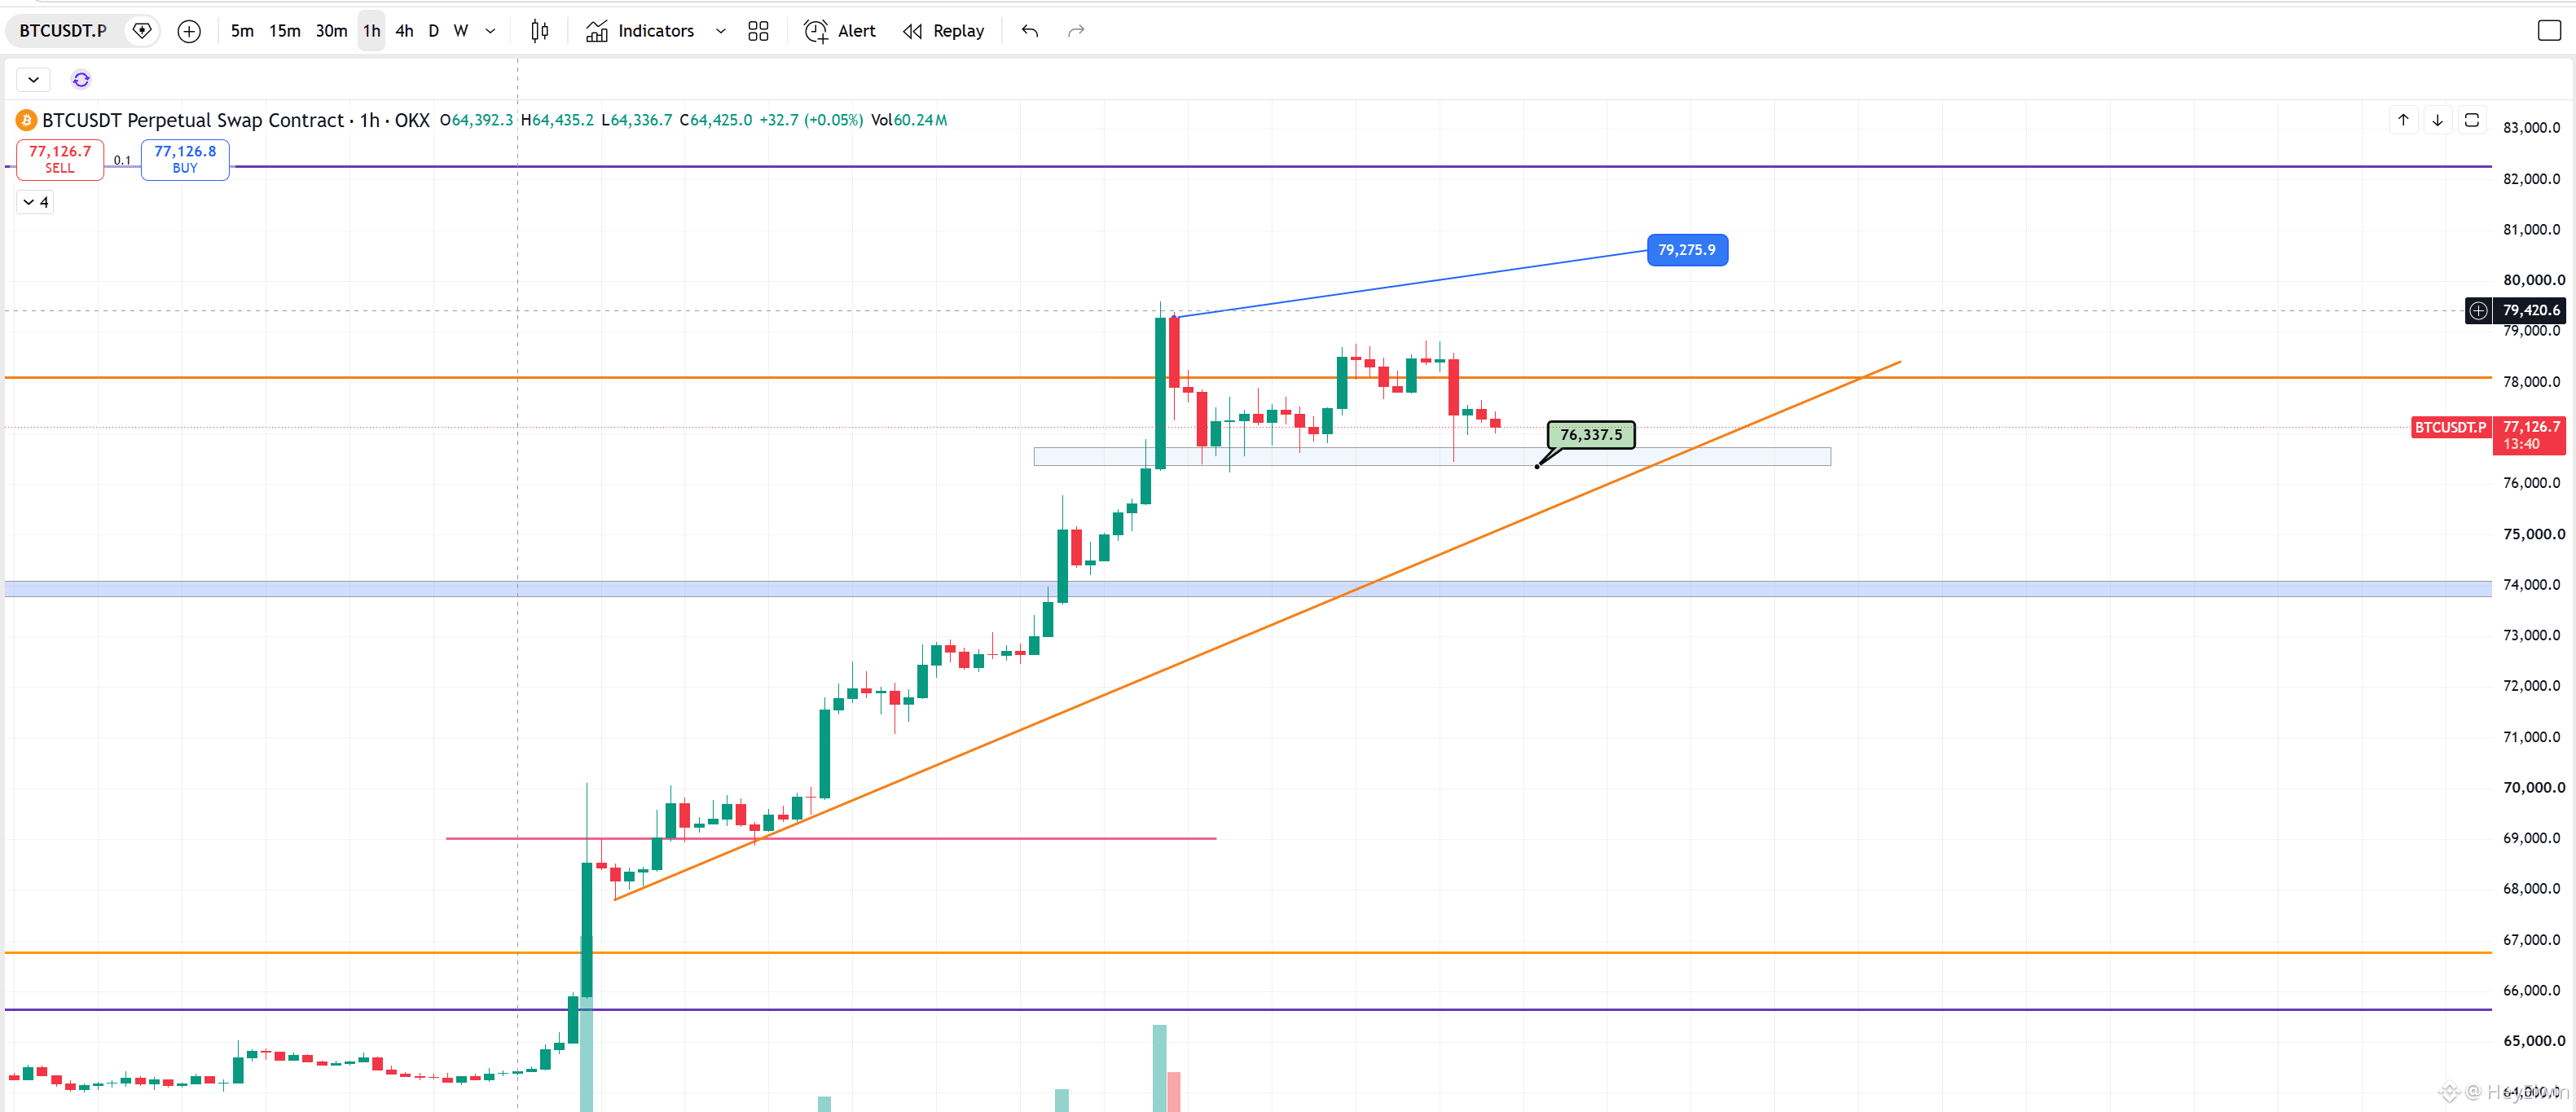
Figure 2. The shorter-term view everyone cares about most. Intraday support is 7.63—the trendline. In my view, a consolidation zone is likely to form here. Then short-term longs and shorts can revolve around the trendline, between 7.63 and 7.92. You can do high-sell/low-buy around the top and bottom of this range. Combined with the currently dominant larger-timeframe bullish trend, the conclusion is: prioritize going long.
Whether price hovers around 7.8, or later pushes up toward 8.25, the first time it reaches resistance and you short there is “left-side” behavior. As long as it hasn’t formed a longer consolidation and broken down through the prior structure, it won’t immediately flip from a bullish trend to a bearish one. The so-called consolidation can be referenced at the left-side arrow in Figure 1. Instead of thinking about shorting at the highest point, better to buy on dips, keep buying, keep buying~
#TRUMP突破3.4美元创3月21日以来新高 $BTC
BTC
recap this briefly. This wave of violent rally pushed above 10,000+. Around 7.8, signs of slowing finally appeared. But the trend isn’t over yet.
First the conclusion: near the bull/bear boundary, the trend is still bullish. To short, you need more candles and clearer structure. For short-term trading, it’s a small consolidation range.
Figure 1. The weekly resistance at 8.25 is still there. As for whether this is a “bull return,” this is a key level—see the detailed weekly analysis from the past few days.
The larger timeframe support and resistance shown in the chart remain valid. Currently, price is stalling at the daily resistance around 7.8. With this kind of rally, a small pullback is completely normal. As long as 7.4 doesn’t break, there’s no need to worry about entering a price “vacuum” zone.
Figure 2. The shorter-term view everyone cares about most. Intraday support is 7.63—the trendline. In my view, a consolidation zone is likely to form here. Then short-term longs and shorts can revolve around the trendline, between 7.63 and 7.92. You can do high-sell/low-buy around the top and bottom of this range. Combined with the currently dominant larger-timeframe bullish trend, the conclusion is: prioritize going long.
Whether price hovers around 7.8, or later pushes up toward 8.25, the first time it reaches resistance and you short there is “left-side” behavior. As long as it hasn’t formed a longer consolidation and broken down through the prior structure, it won’t immediately flip from a bullish trend to a bearish one. The so-called consolidation can be referenced at the left-side arrow in Figure 1. Instead of thinking about shorting at the highest point, better to buy on dips, keep buying, keep buying~
#TRUMP突破3.4美元创3月21日以来新高 $BTC