
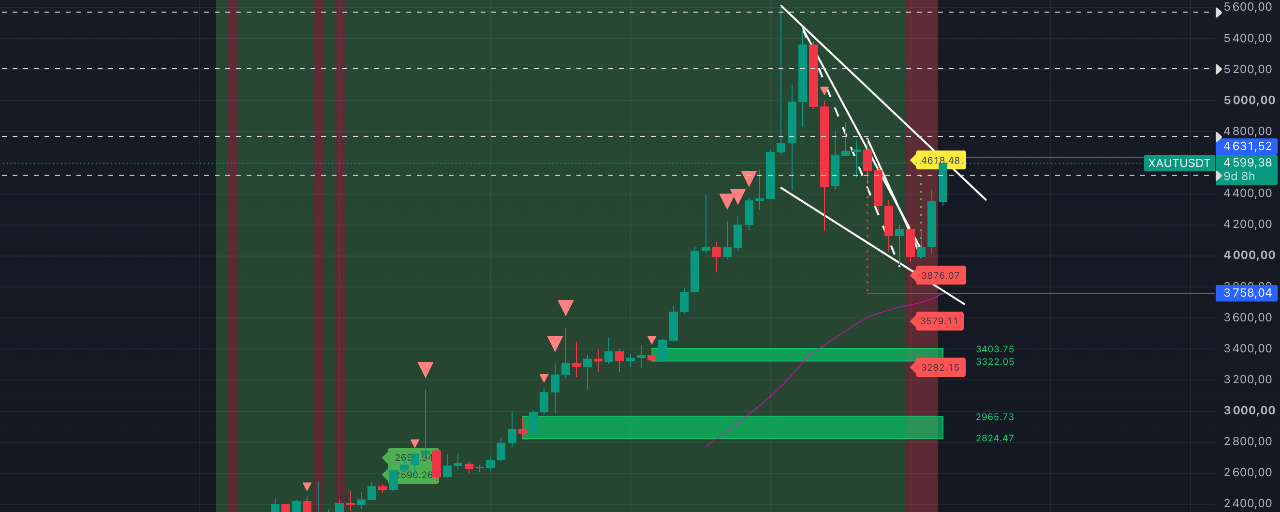

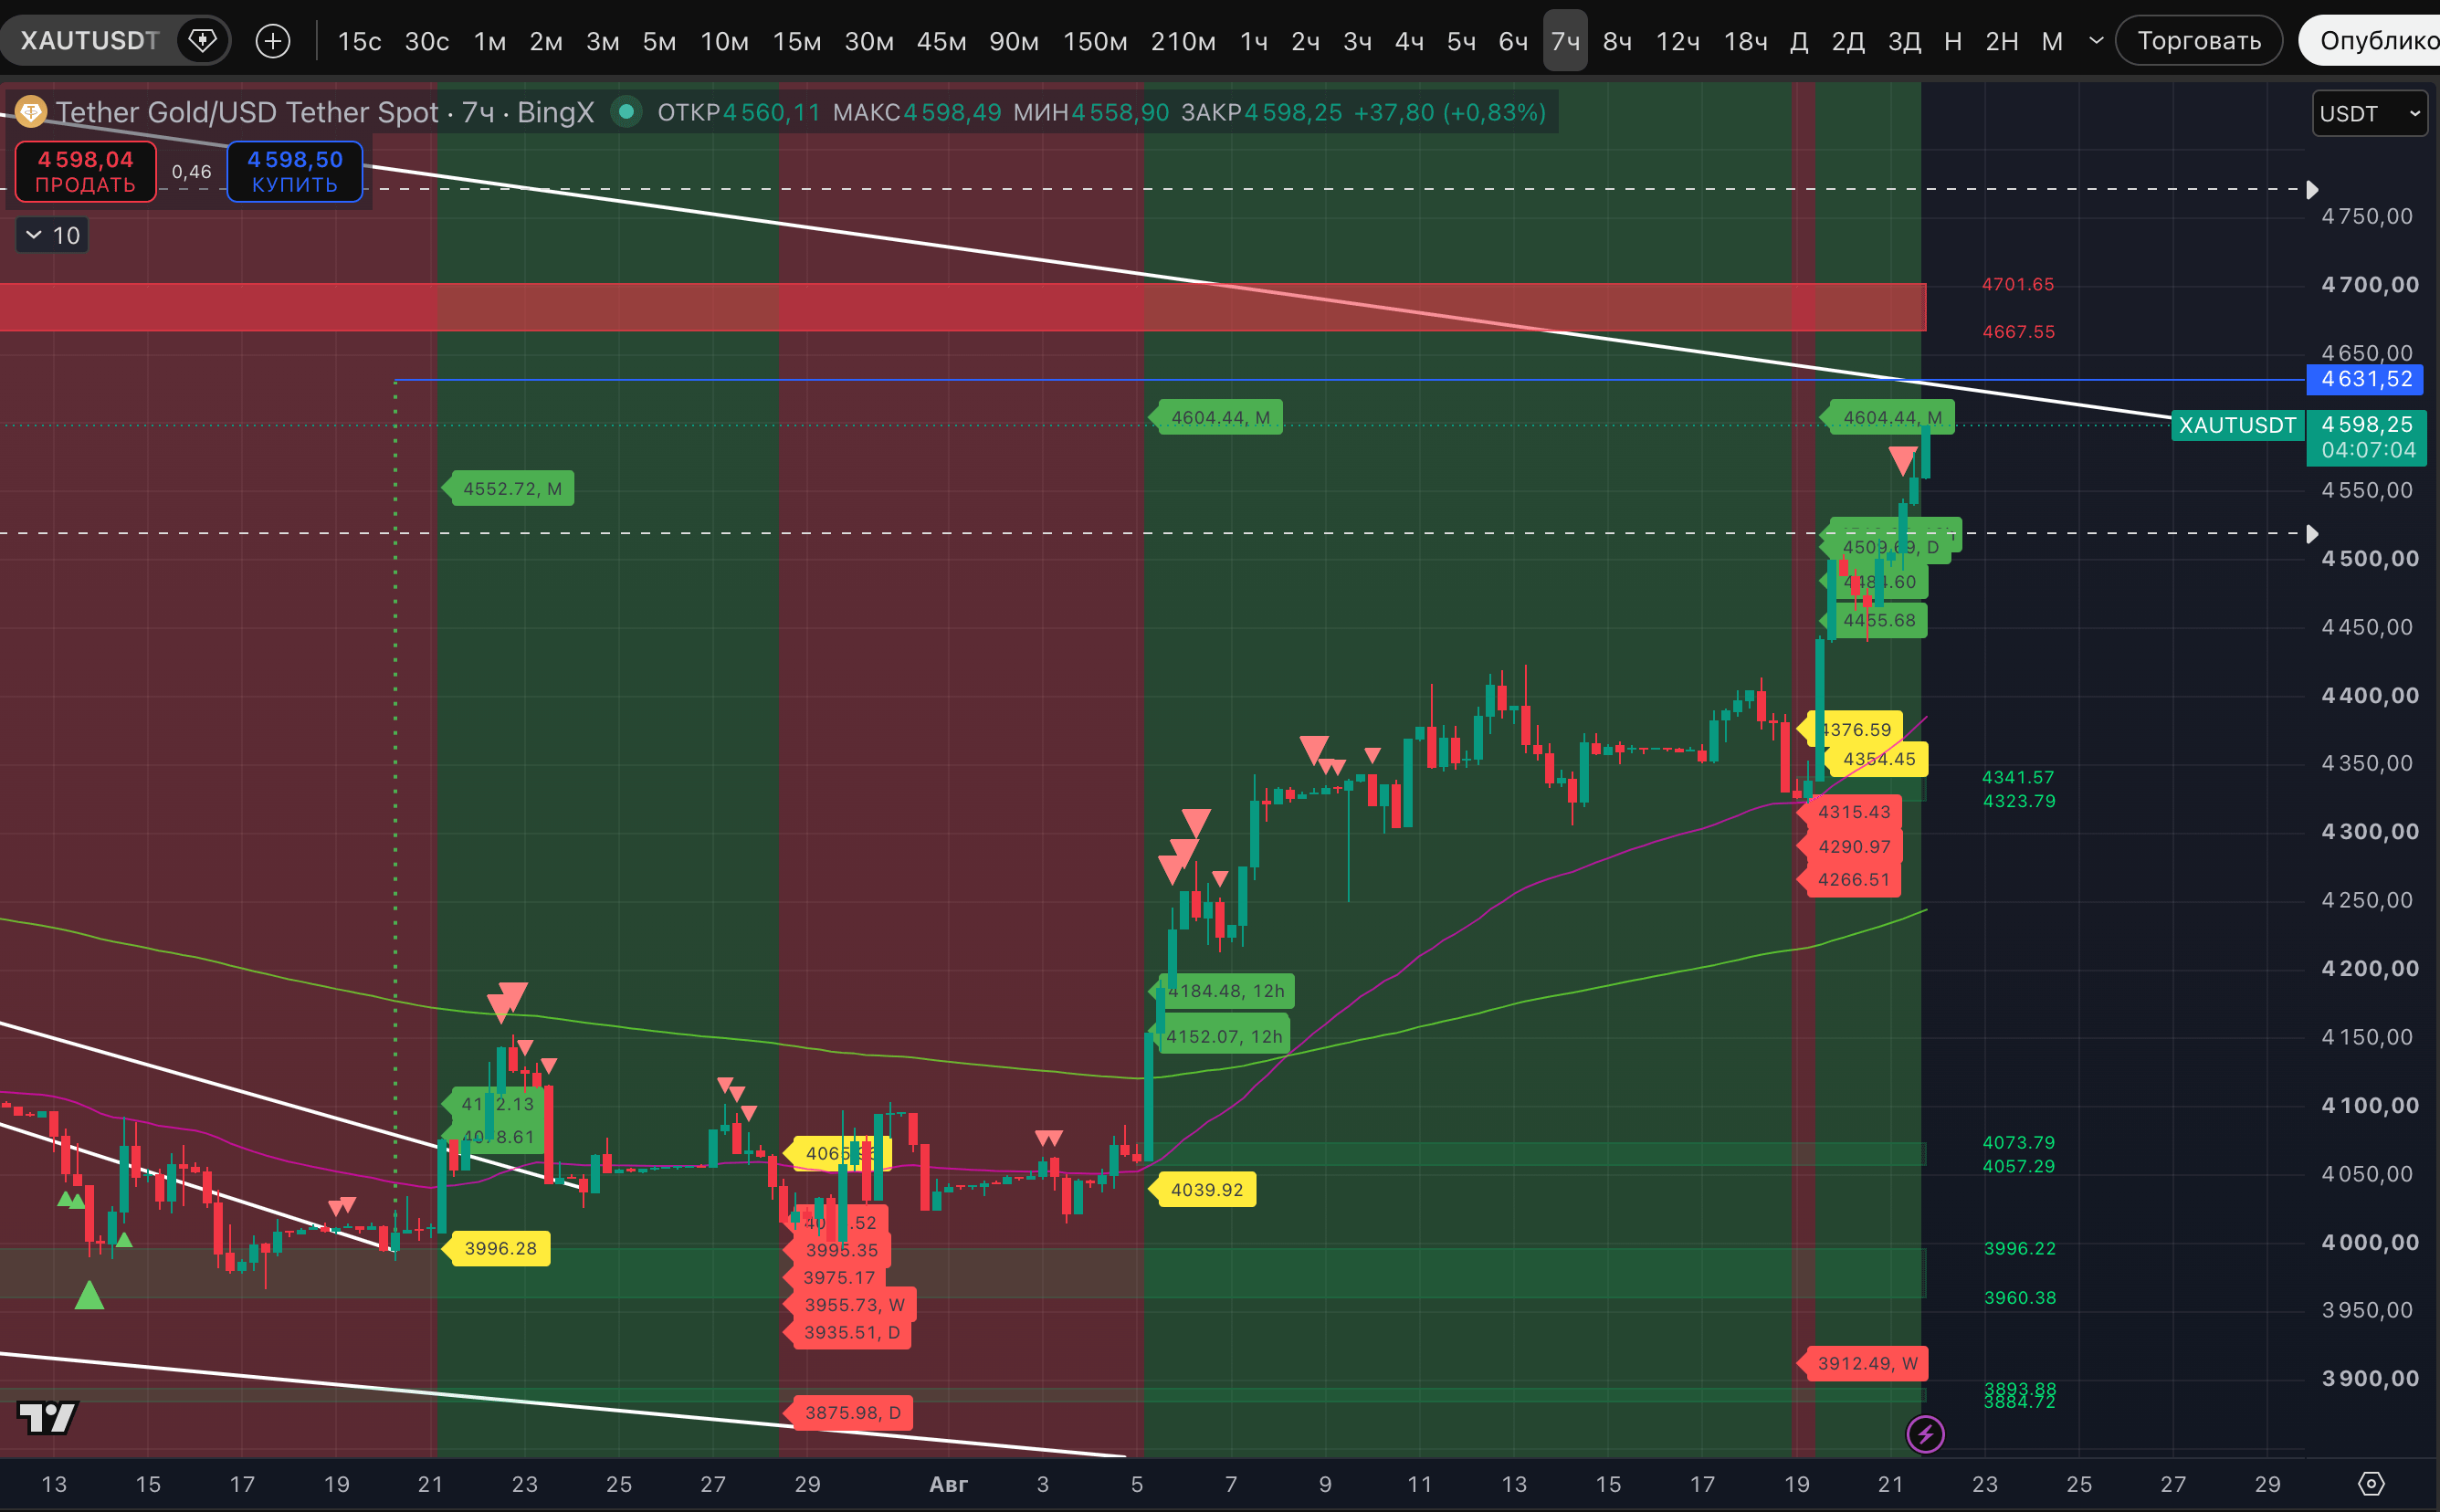
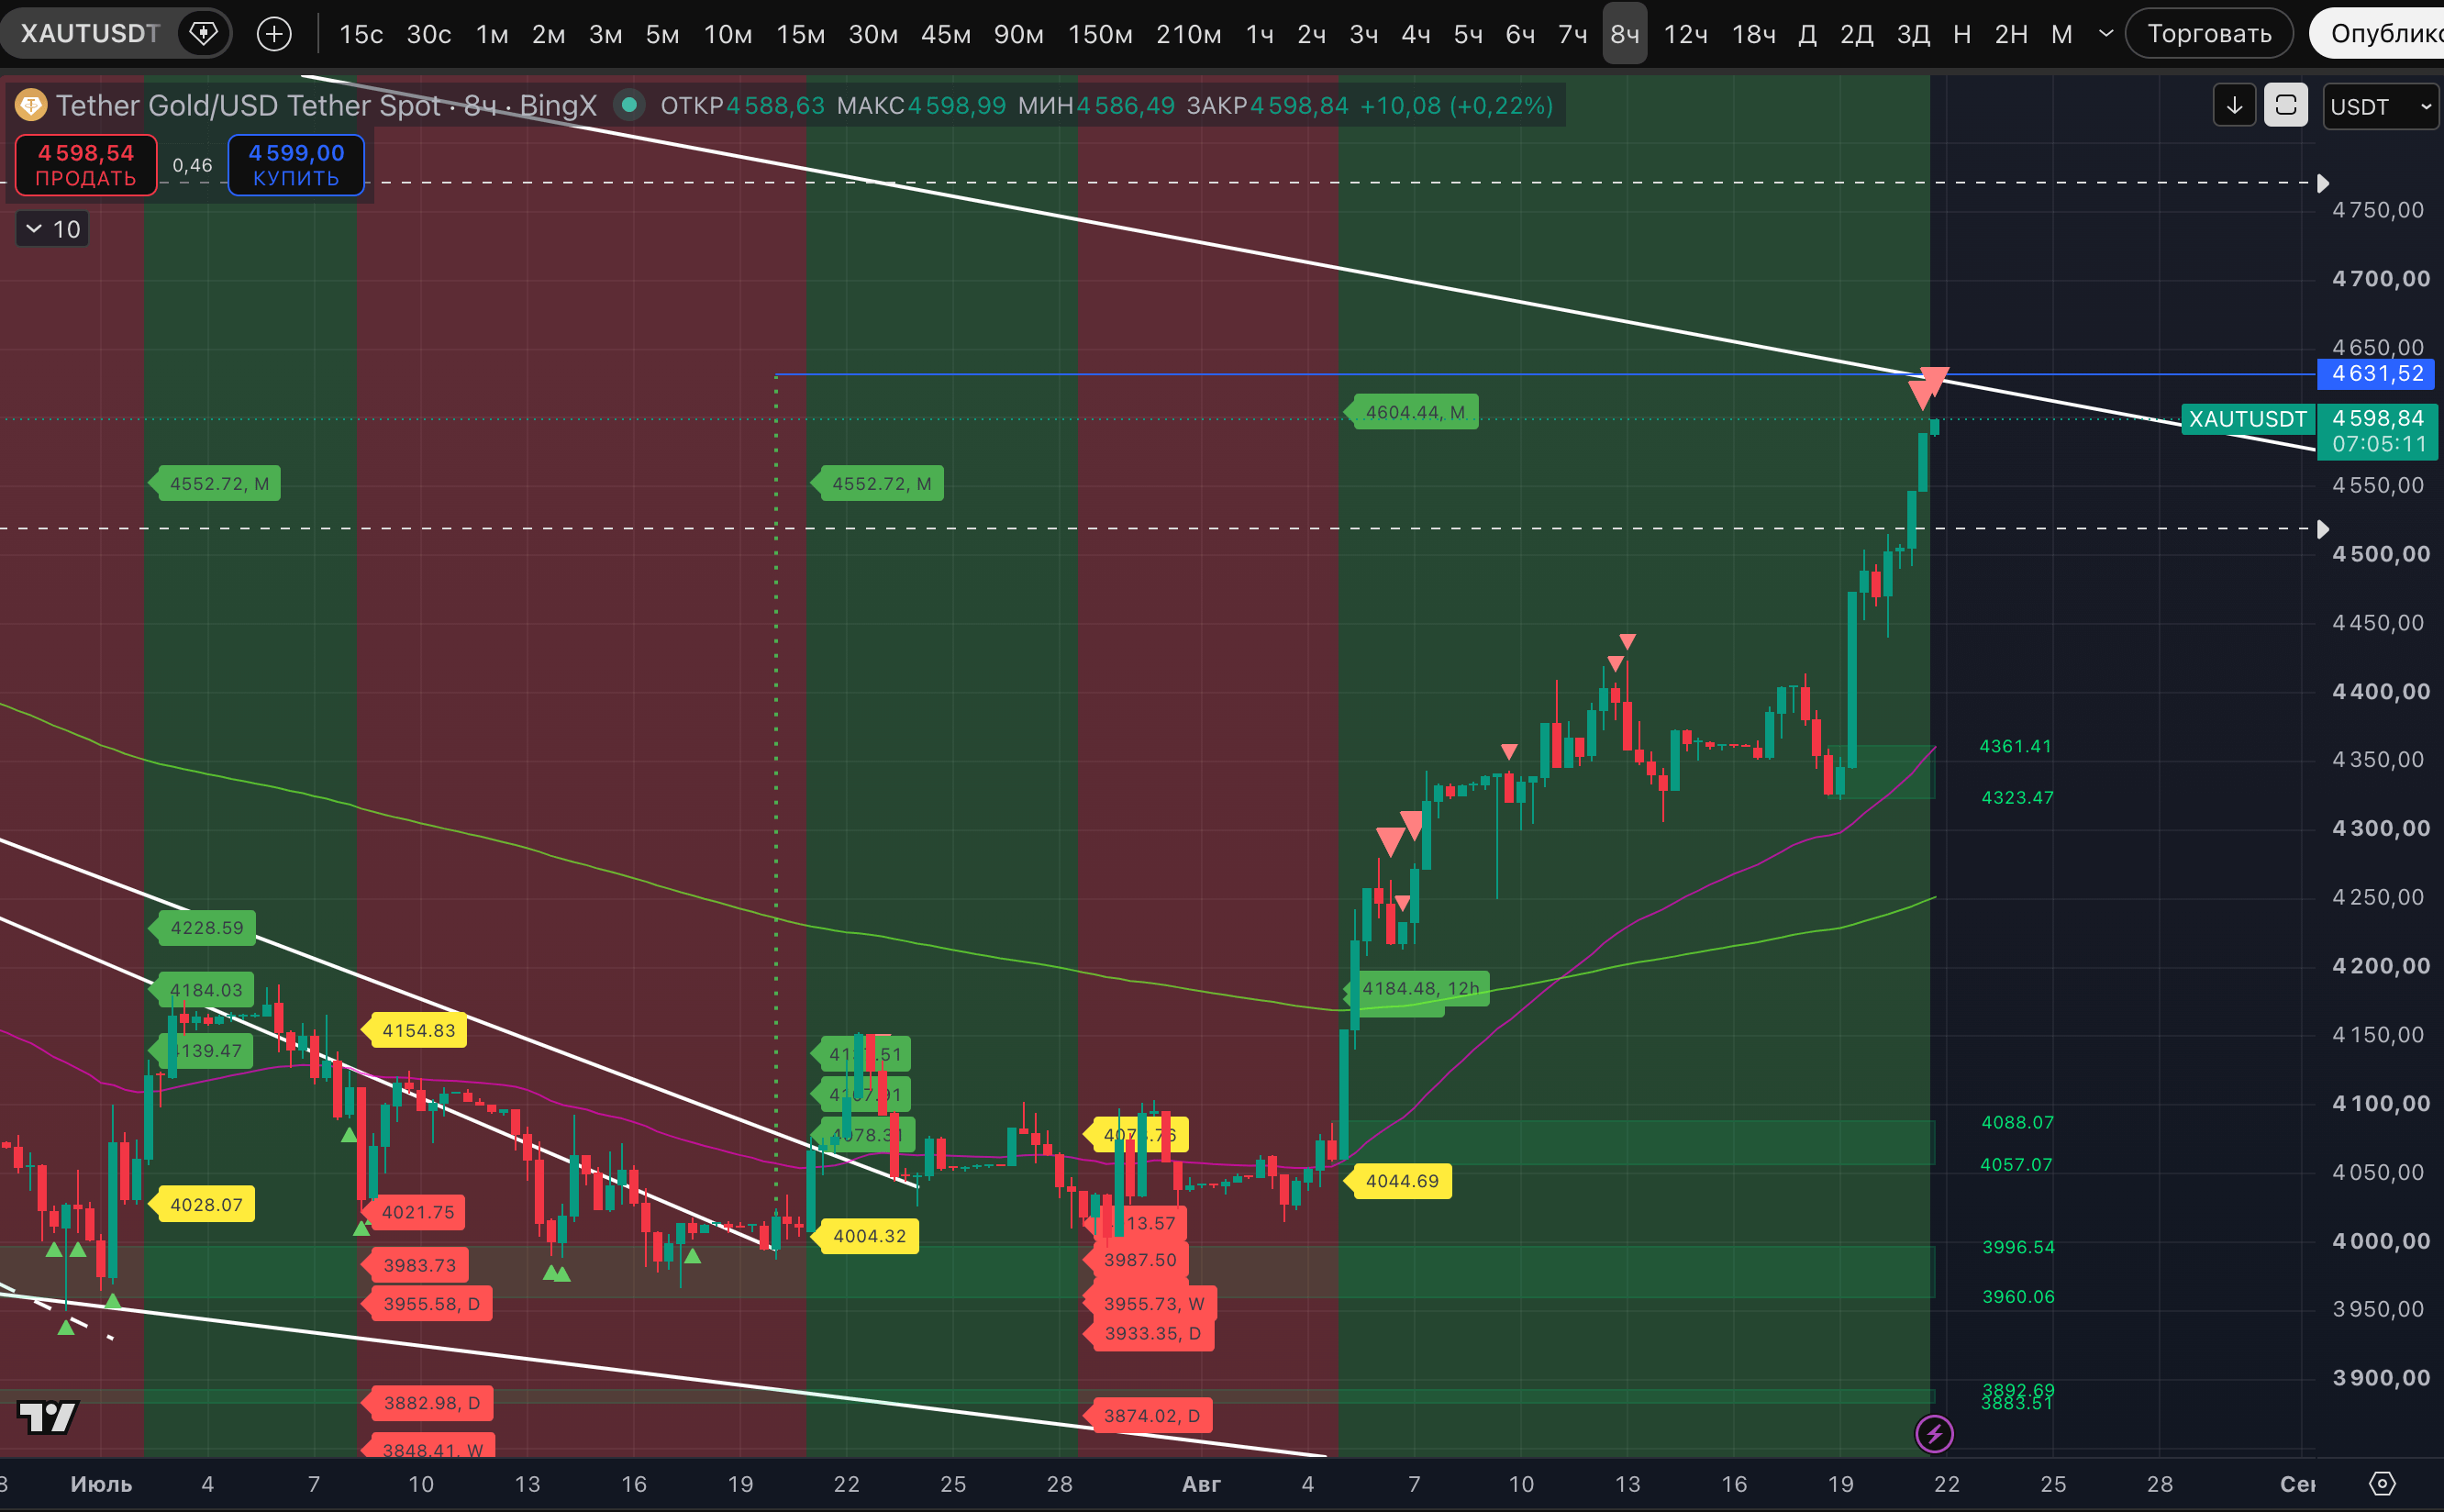
Meanwhile, gold moved up to the 4,600$ level as it picked up. Having broken through a whole series of signals toward a correction. We’re preparing to add to the short.
In the review of August 19, we wrote:
"...Back on July 22, we indicated that the price had exited the "Bullish wedge" more confidently, with the full target at 4,631$. And through the fulfillment of the marks for a potential high on the daily and 3-day timeframes, we continue to expect a move there..."
Back on the August 19 review, we were expecting the "Double Top" to play out, after which the uptrend would continue. But the buyers broke that scenario at the knee, and the rise continued without any pullbacks.
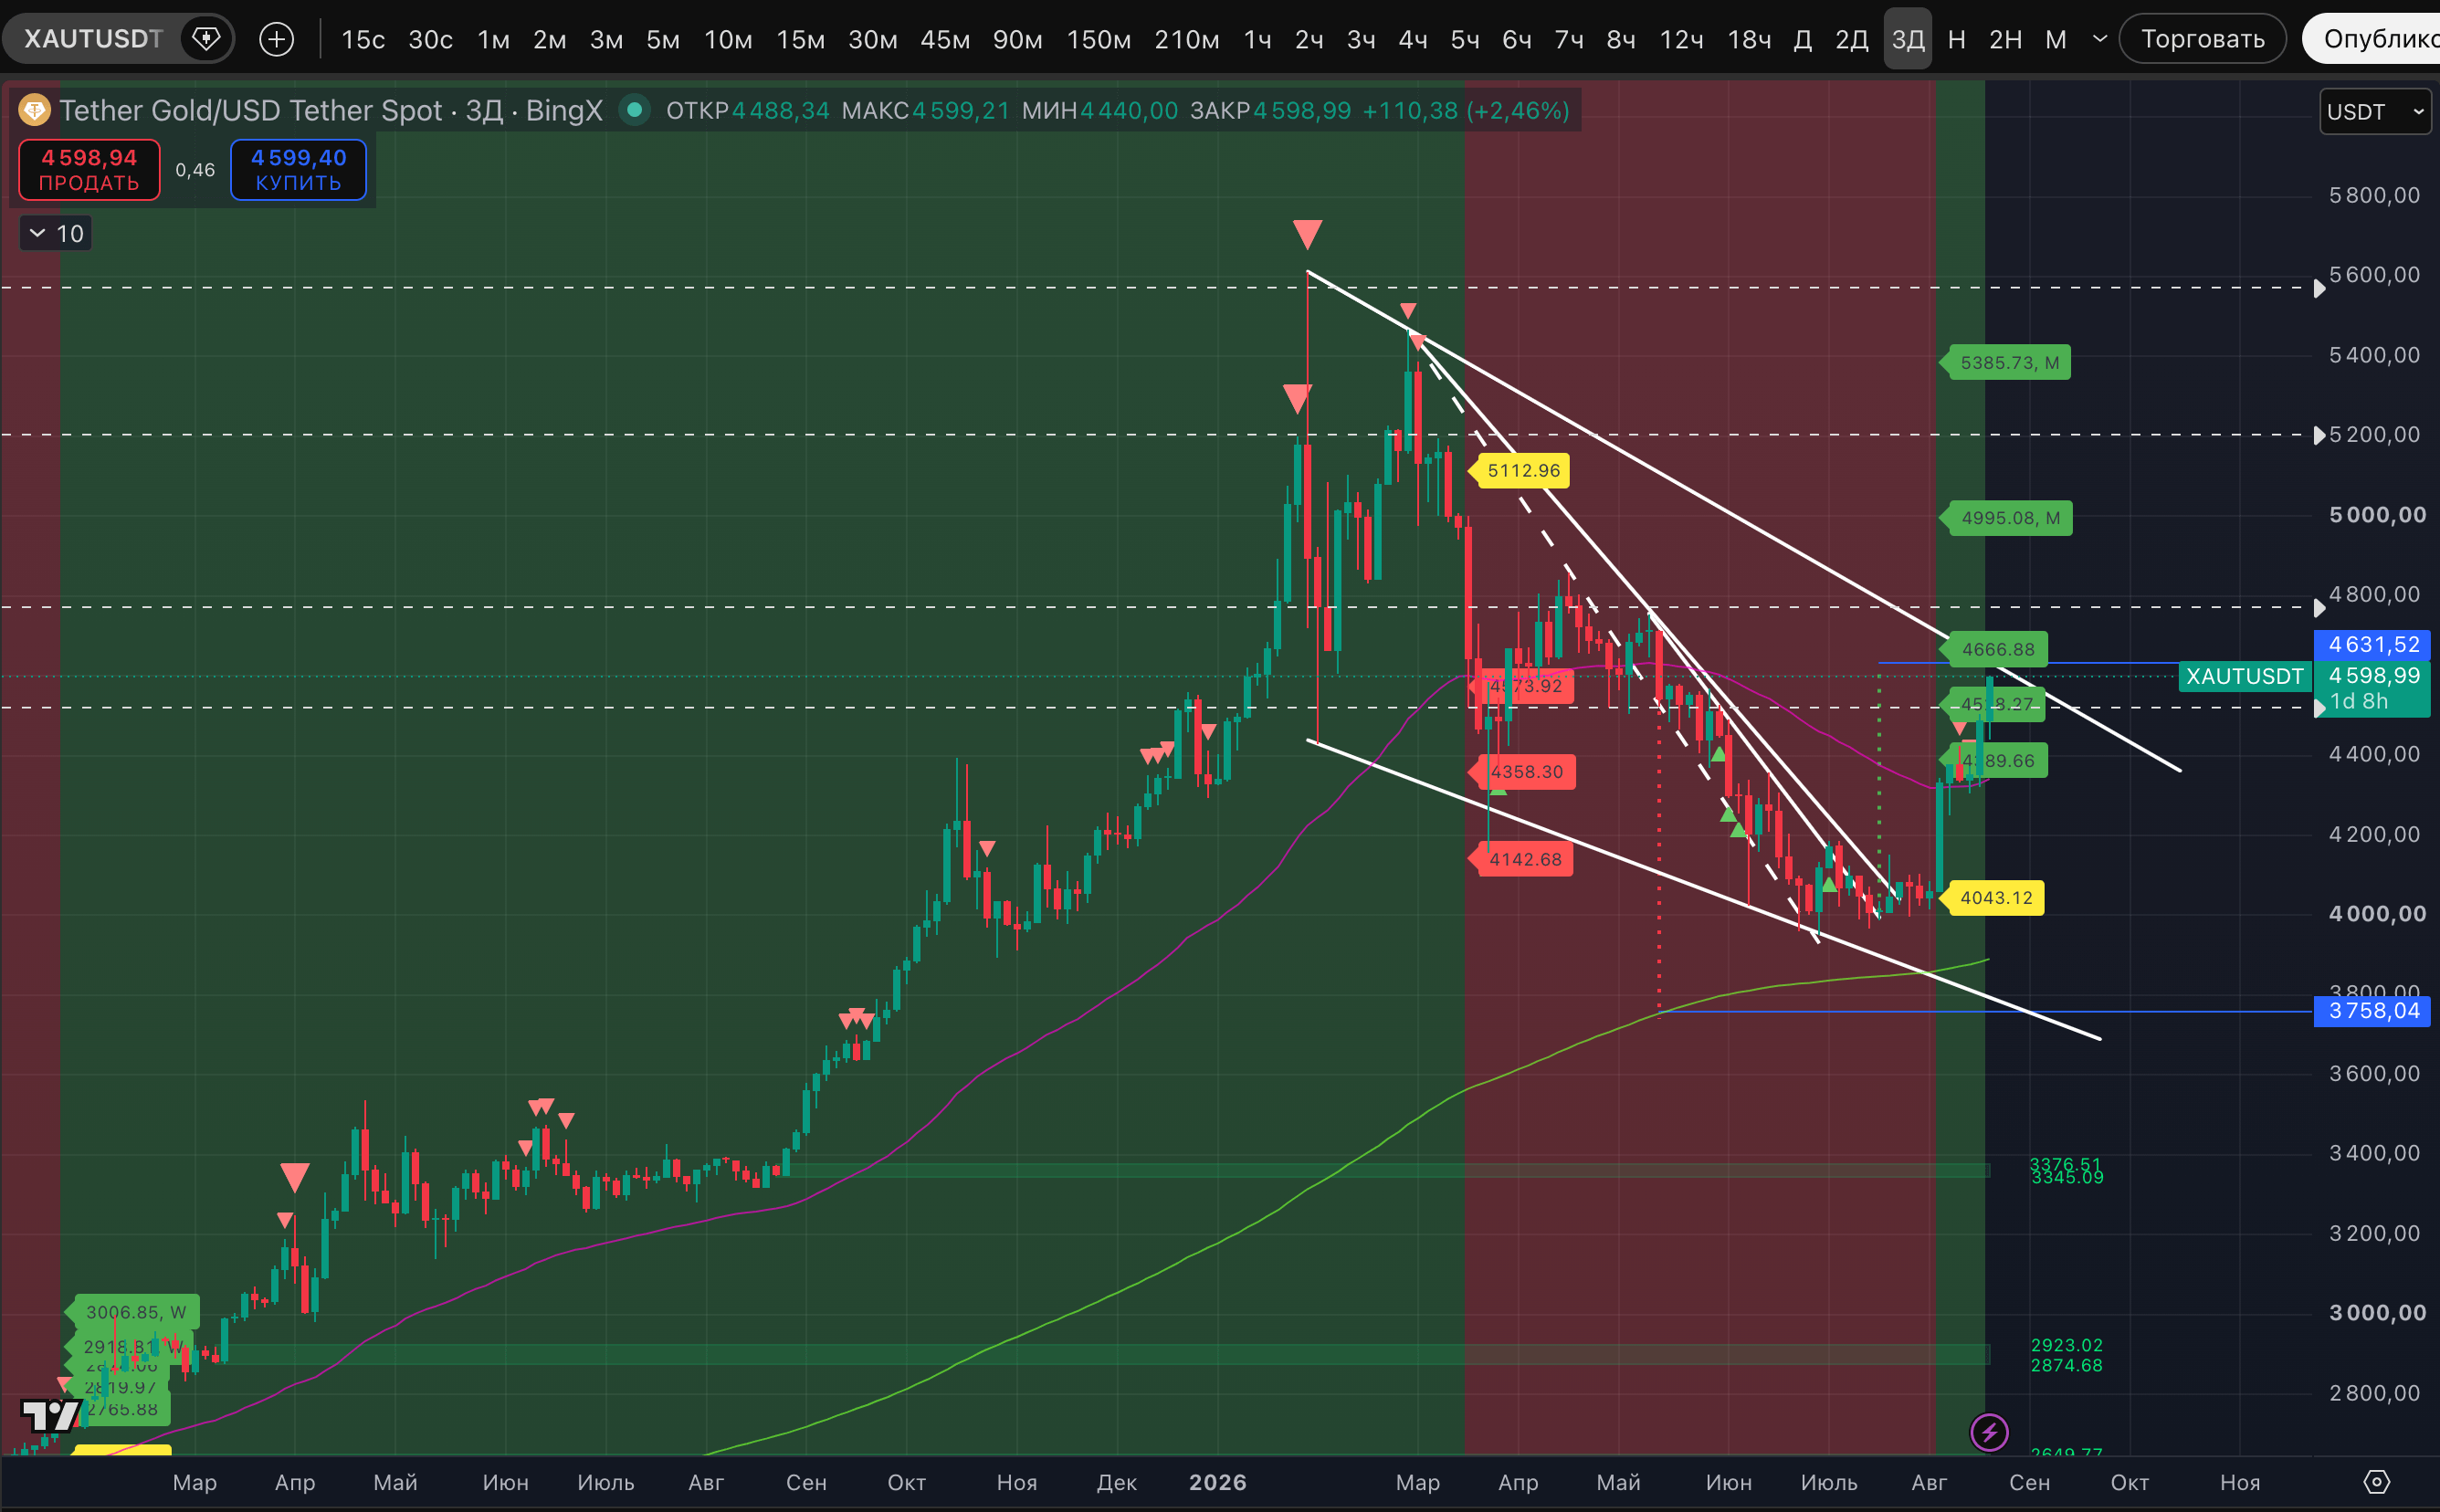
Over these days, starting from $4,358, the price has almost reached the target. That’s worrying, because at the level of $4,631 the global trend with an ATH runs. And if it gets broken, it would also complete the formation of a large "Bullish Wedge" with the target of a new ATH—somewhere in the $5,800 area. But until the ATH trendline is broken, there is no point in counting on it. The pattern is not formed yet.
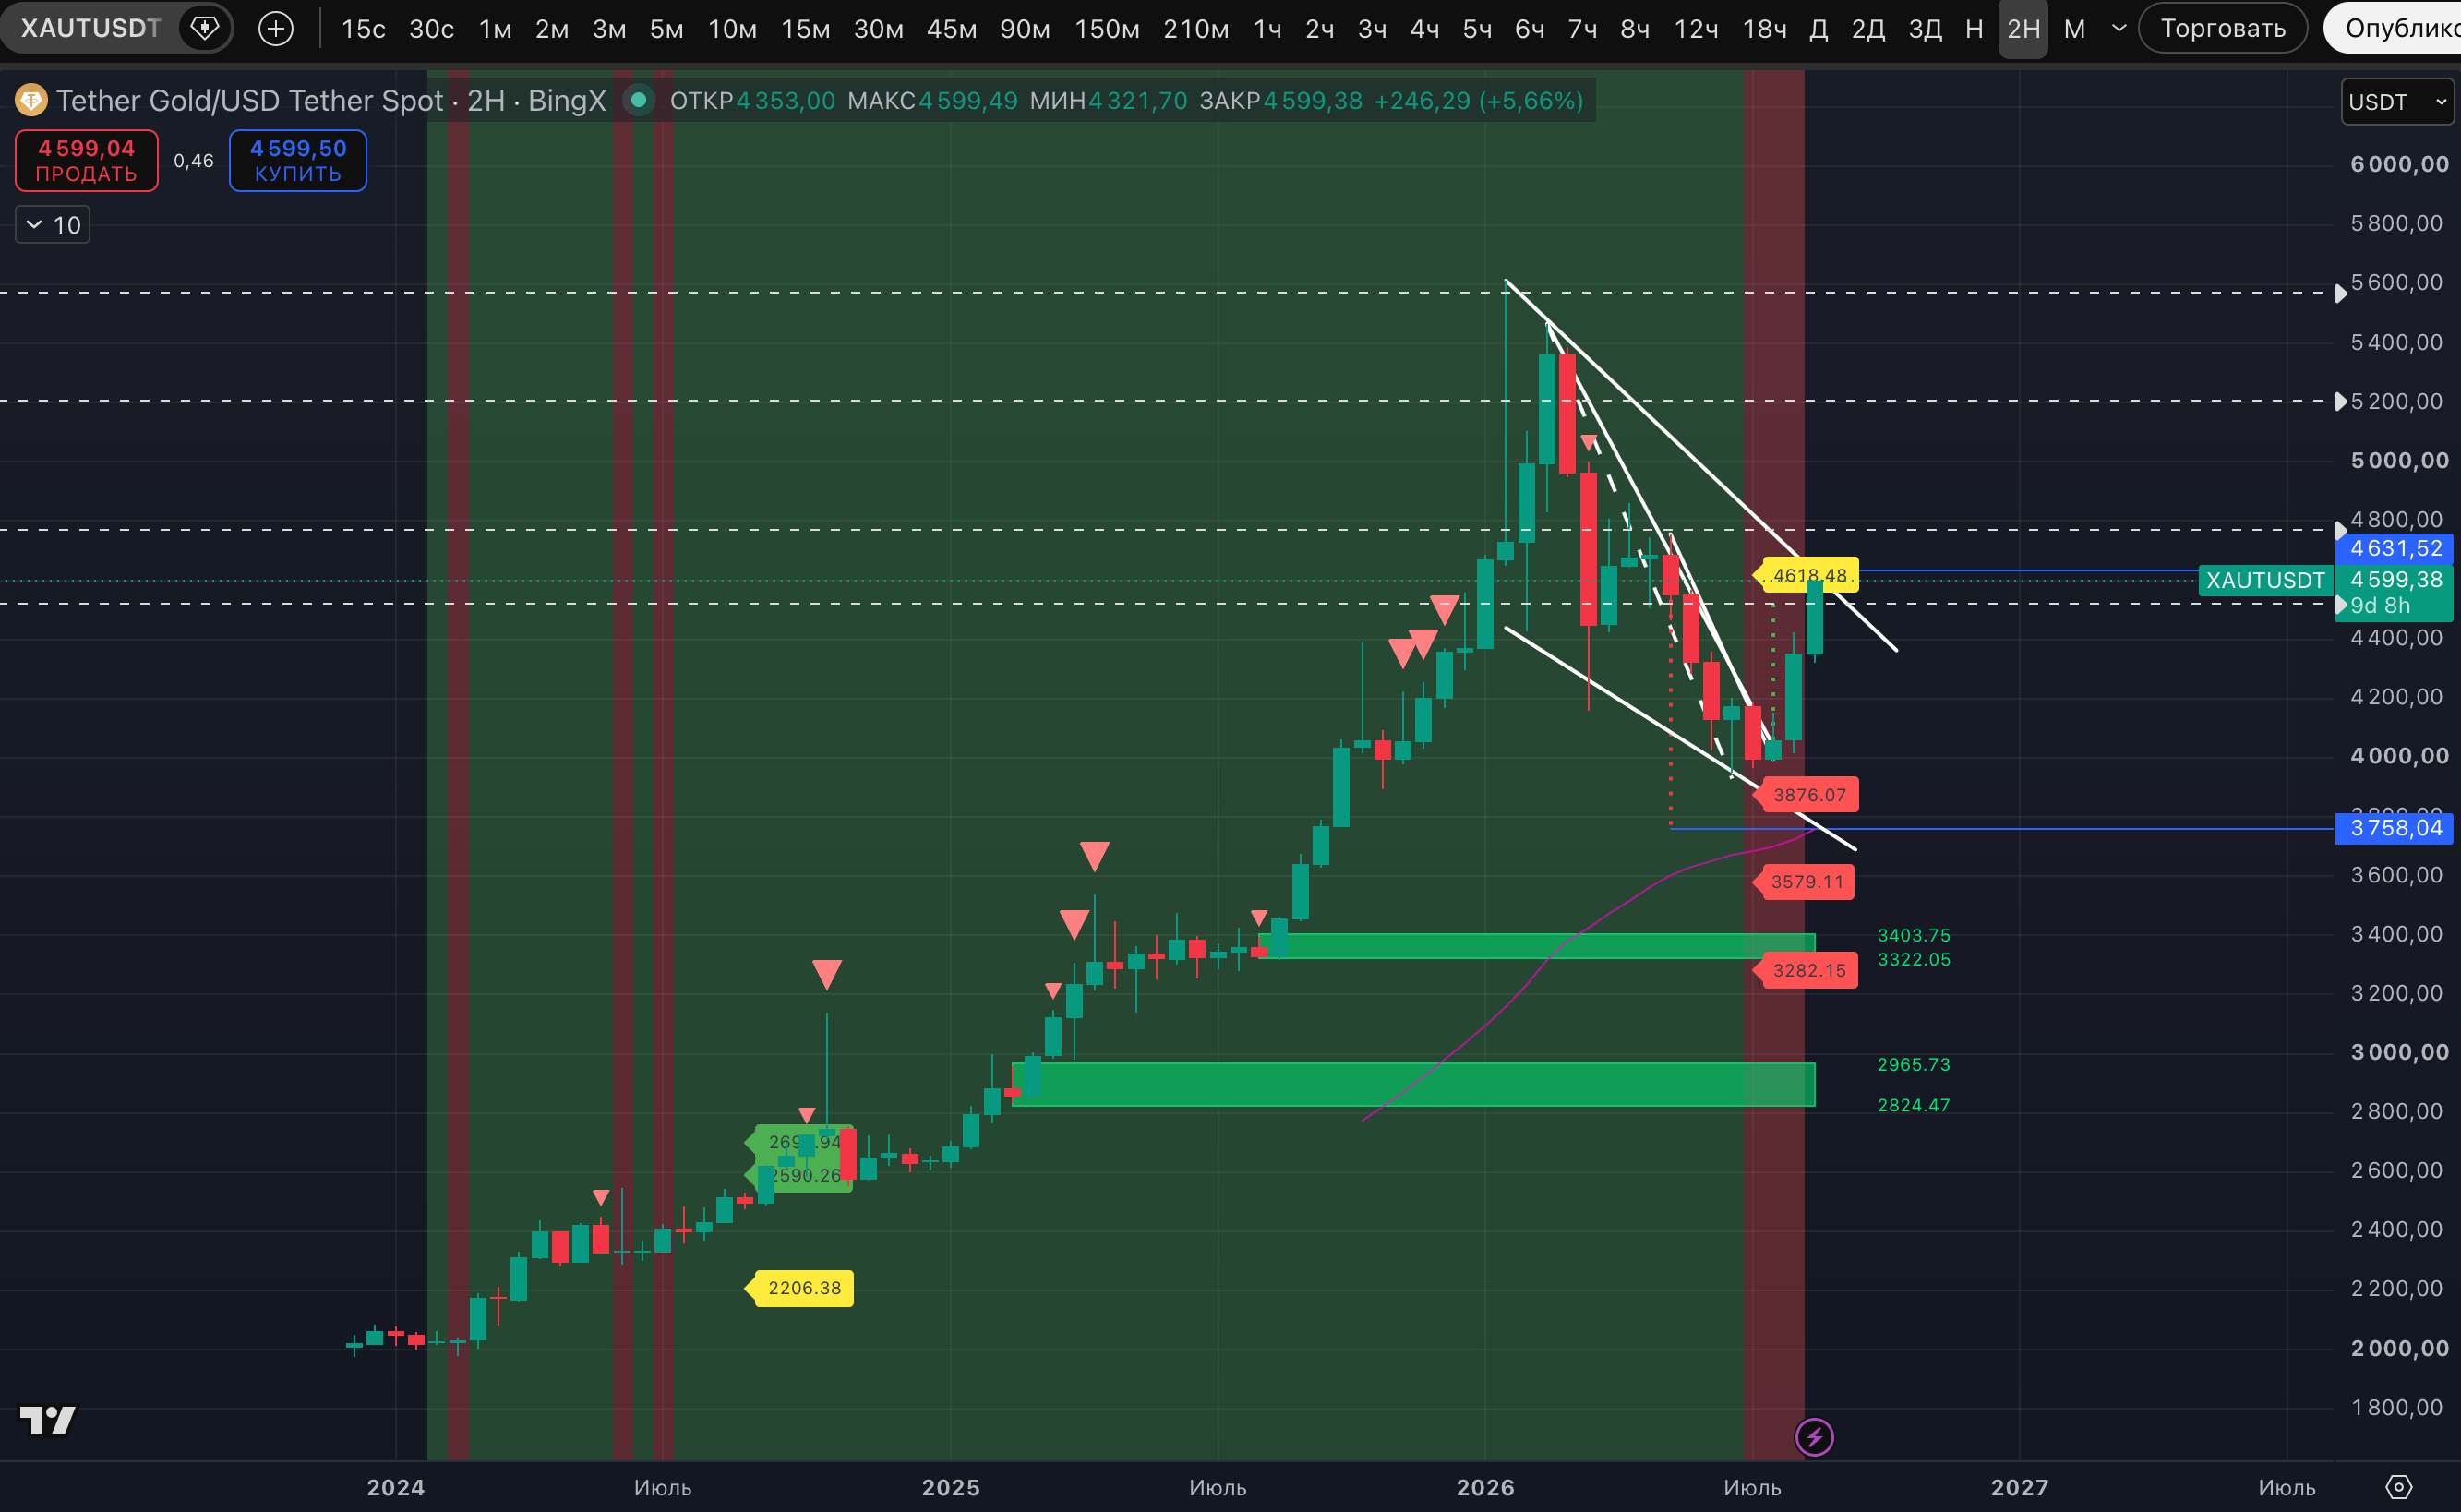
With this bullish momentum, everything seems to be going according to plan. We were expecting this pullback back on June 8, and at the start it dragged on; the asset initially formed a new low of $3,950 on June 30. And through the pullback and consolidation, a strong rise began already in August. The markers for the potential low on the weekly timeframe are working at full speed.
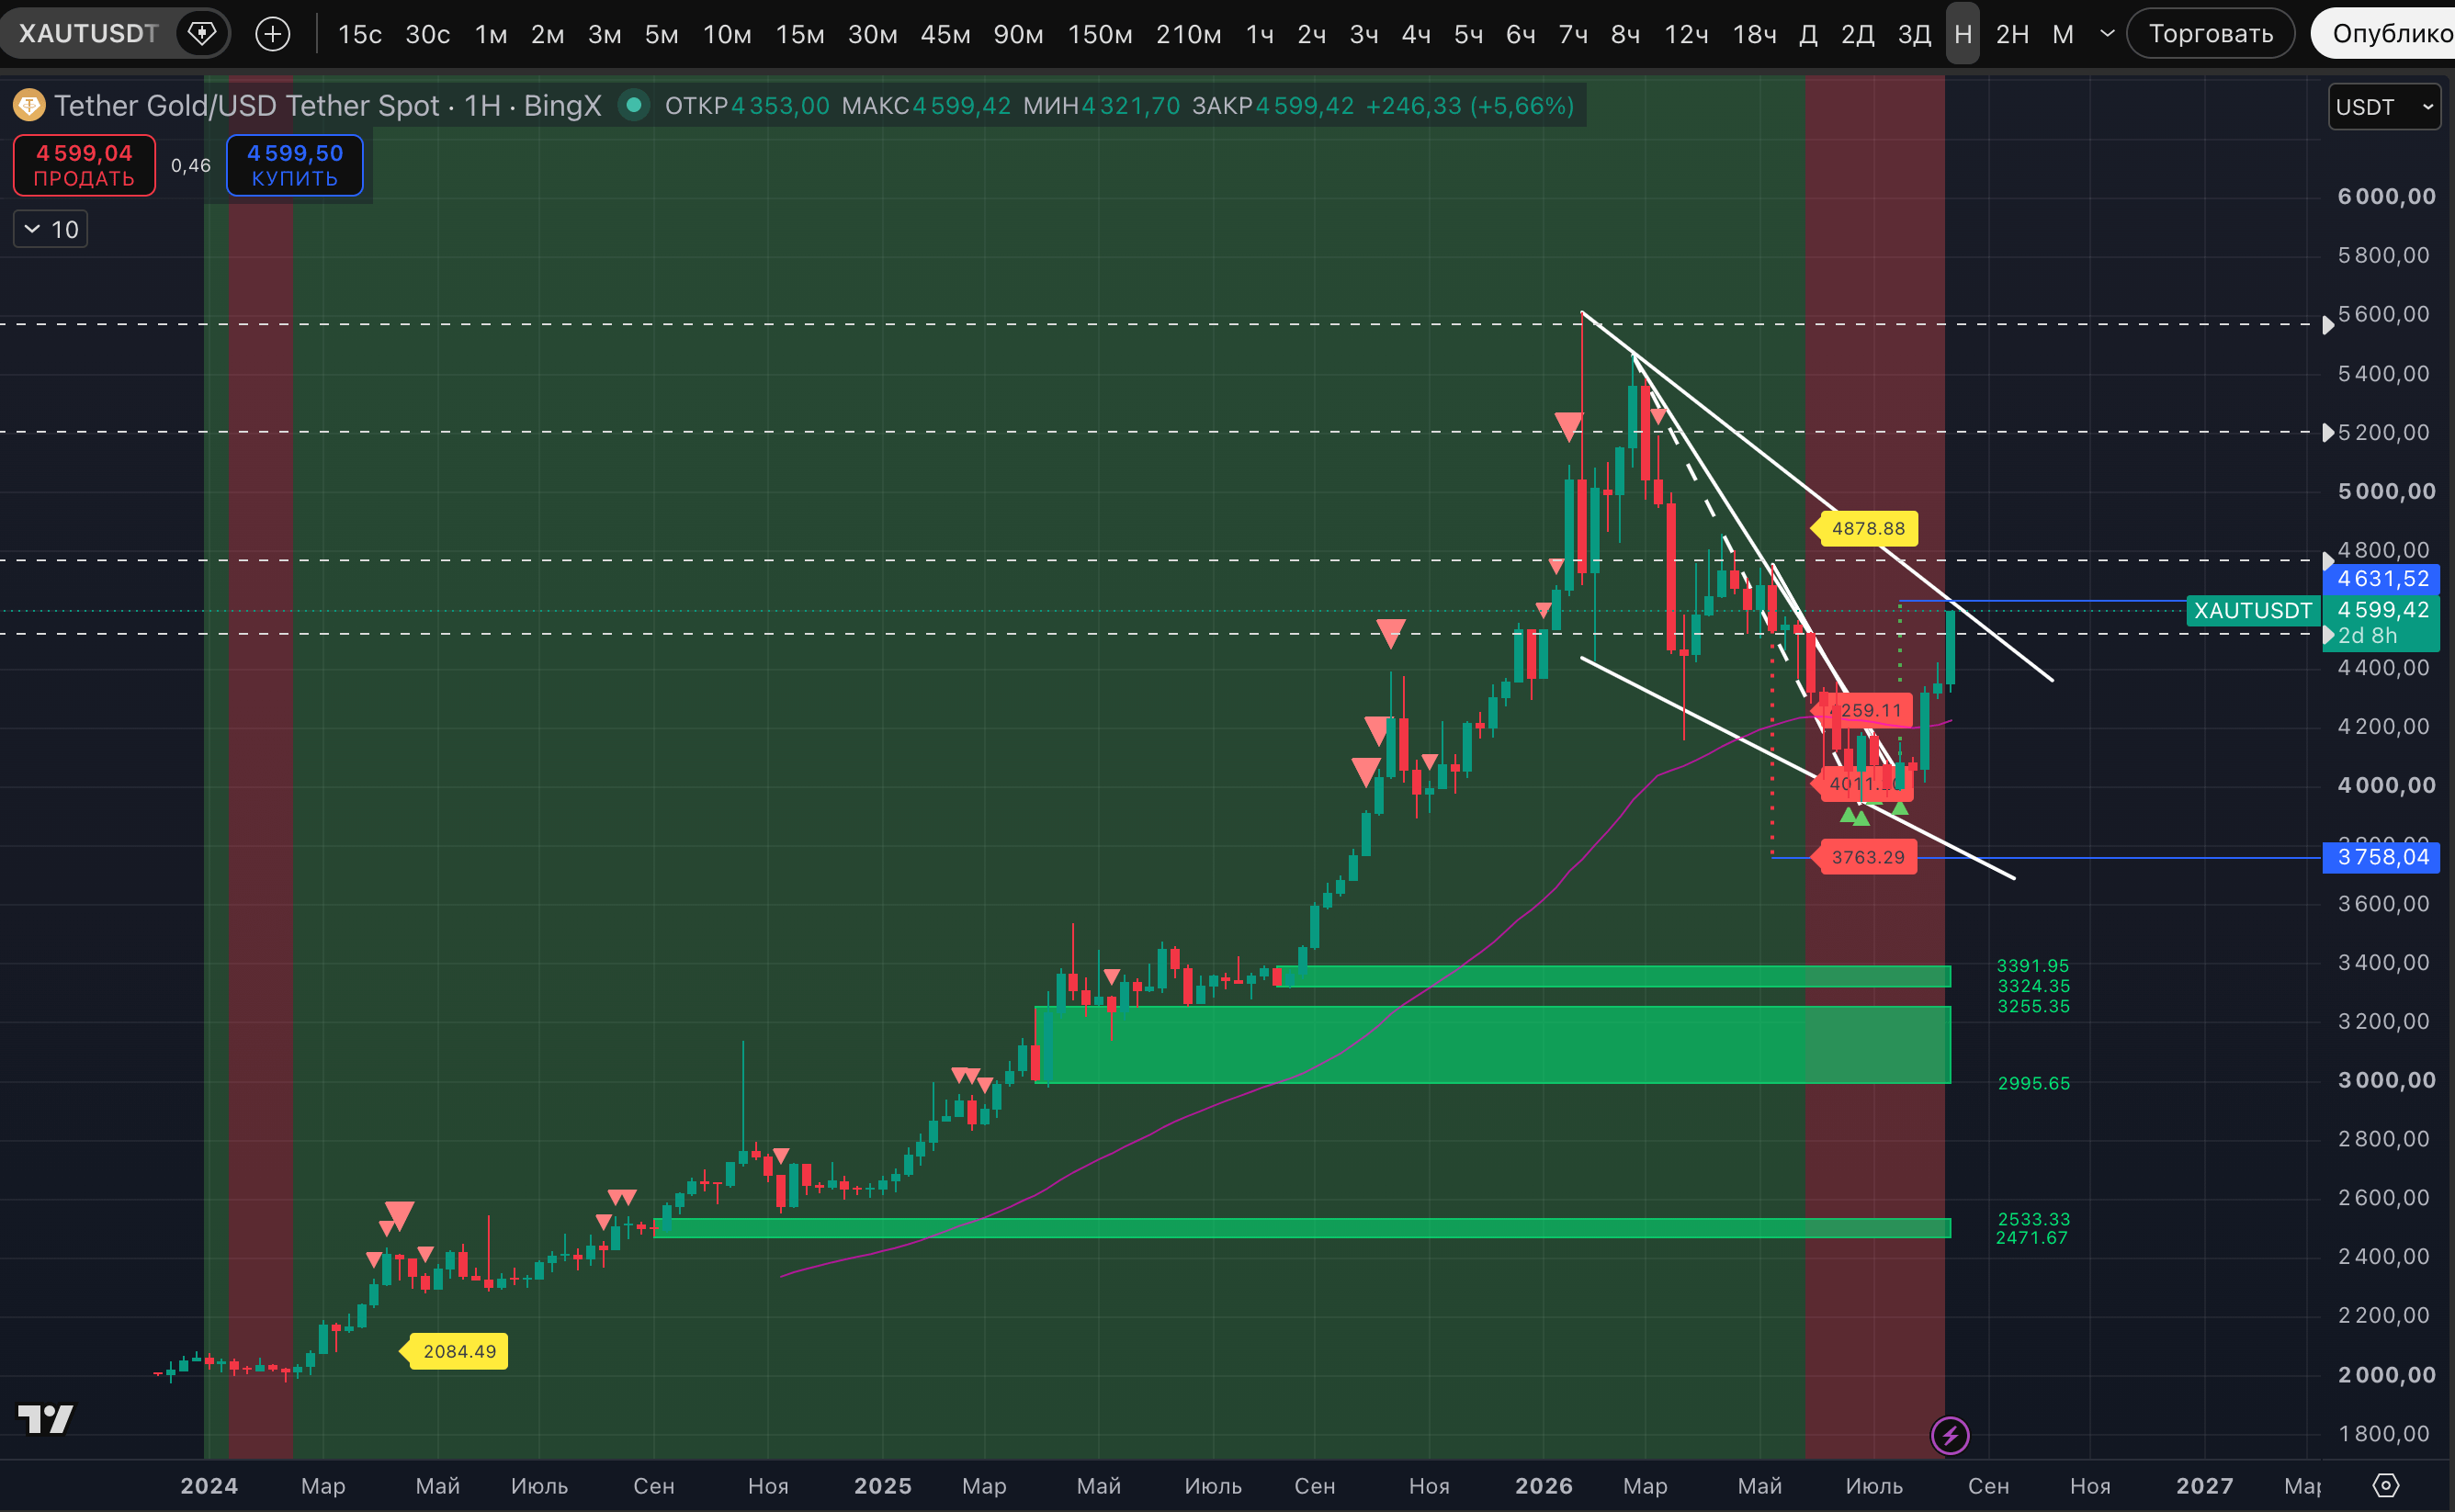
At the moment, the only concern is the strength of this rally and the threats to the higher-timeframe downtrends, whose signs have appeared.
What’s interesting is that although the asset has already risen by more than 10% recently, it showed its Strong signals on the 12-hour timeframe back on August 5-6. And in the end, it broke them. No new markers yet.
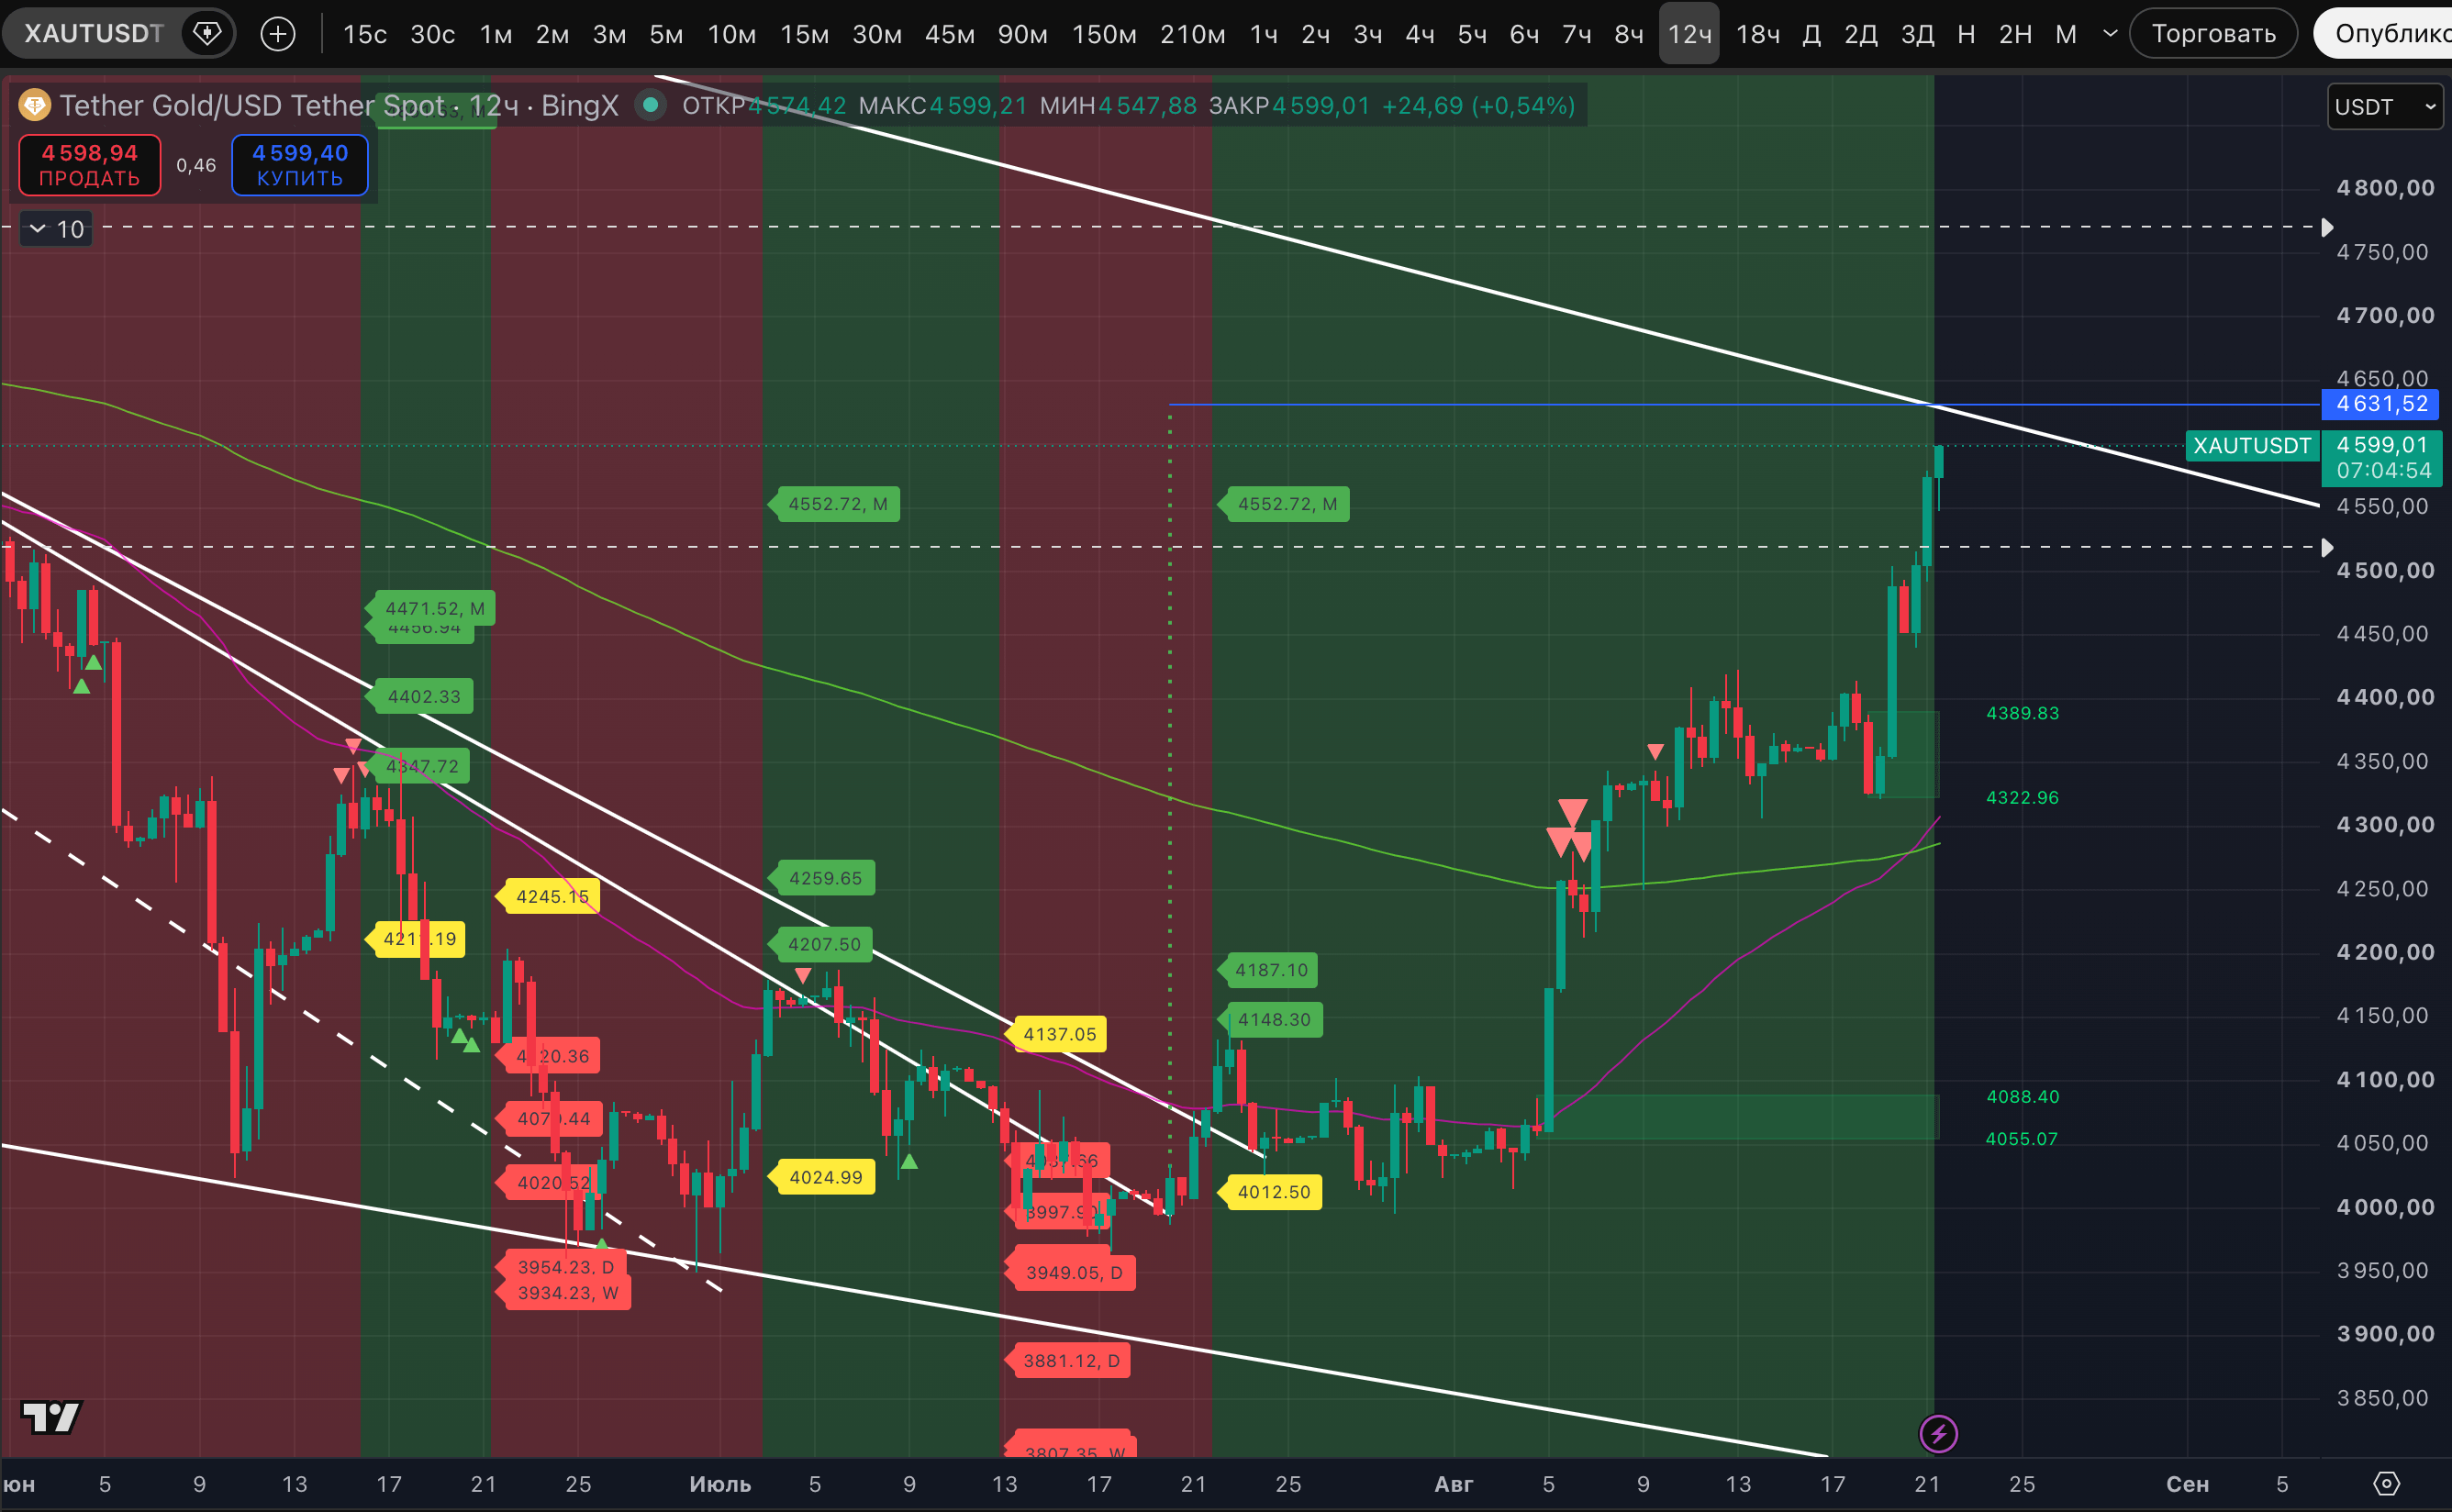
Also, the high markers on the 3-day timeframe have been broken.
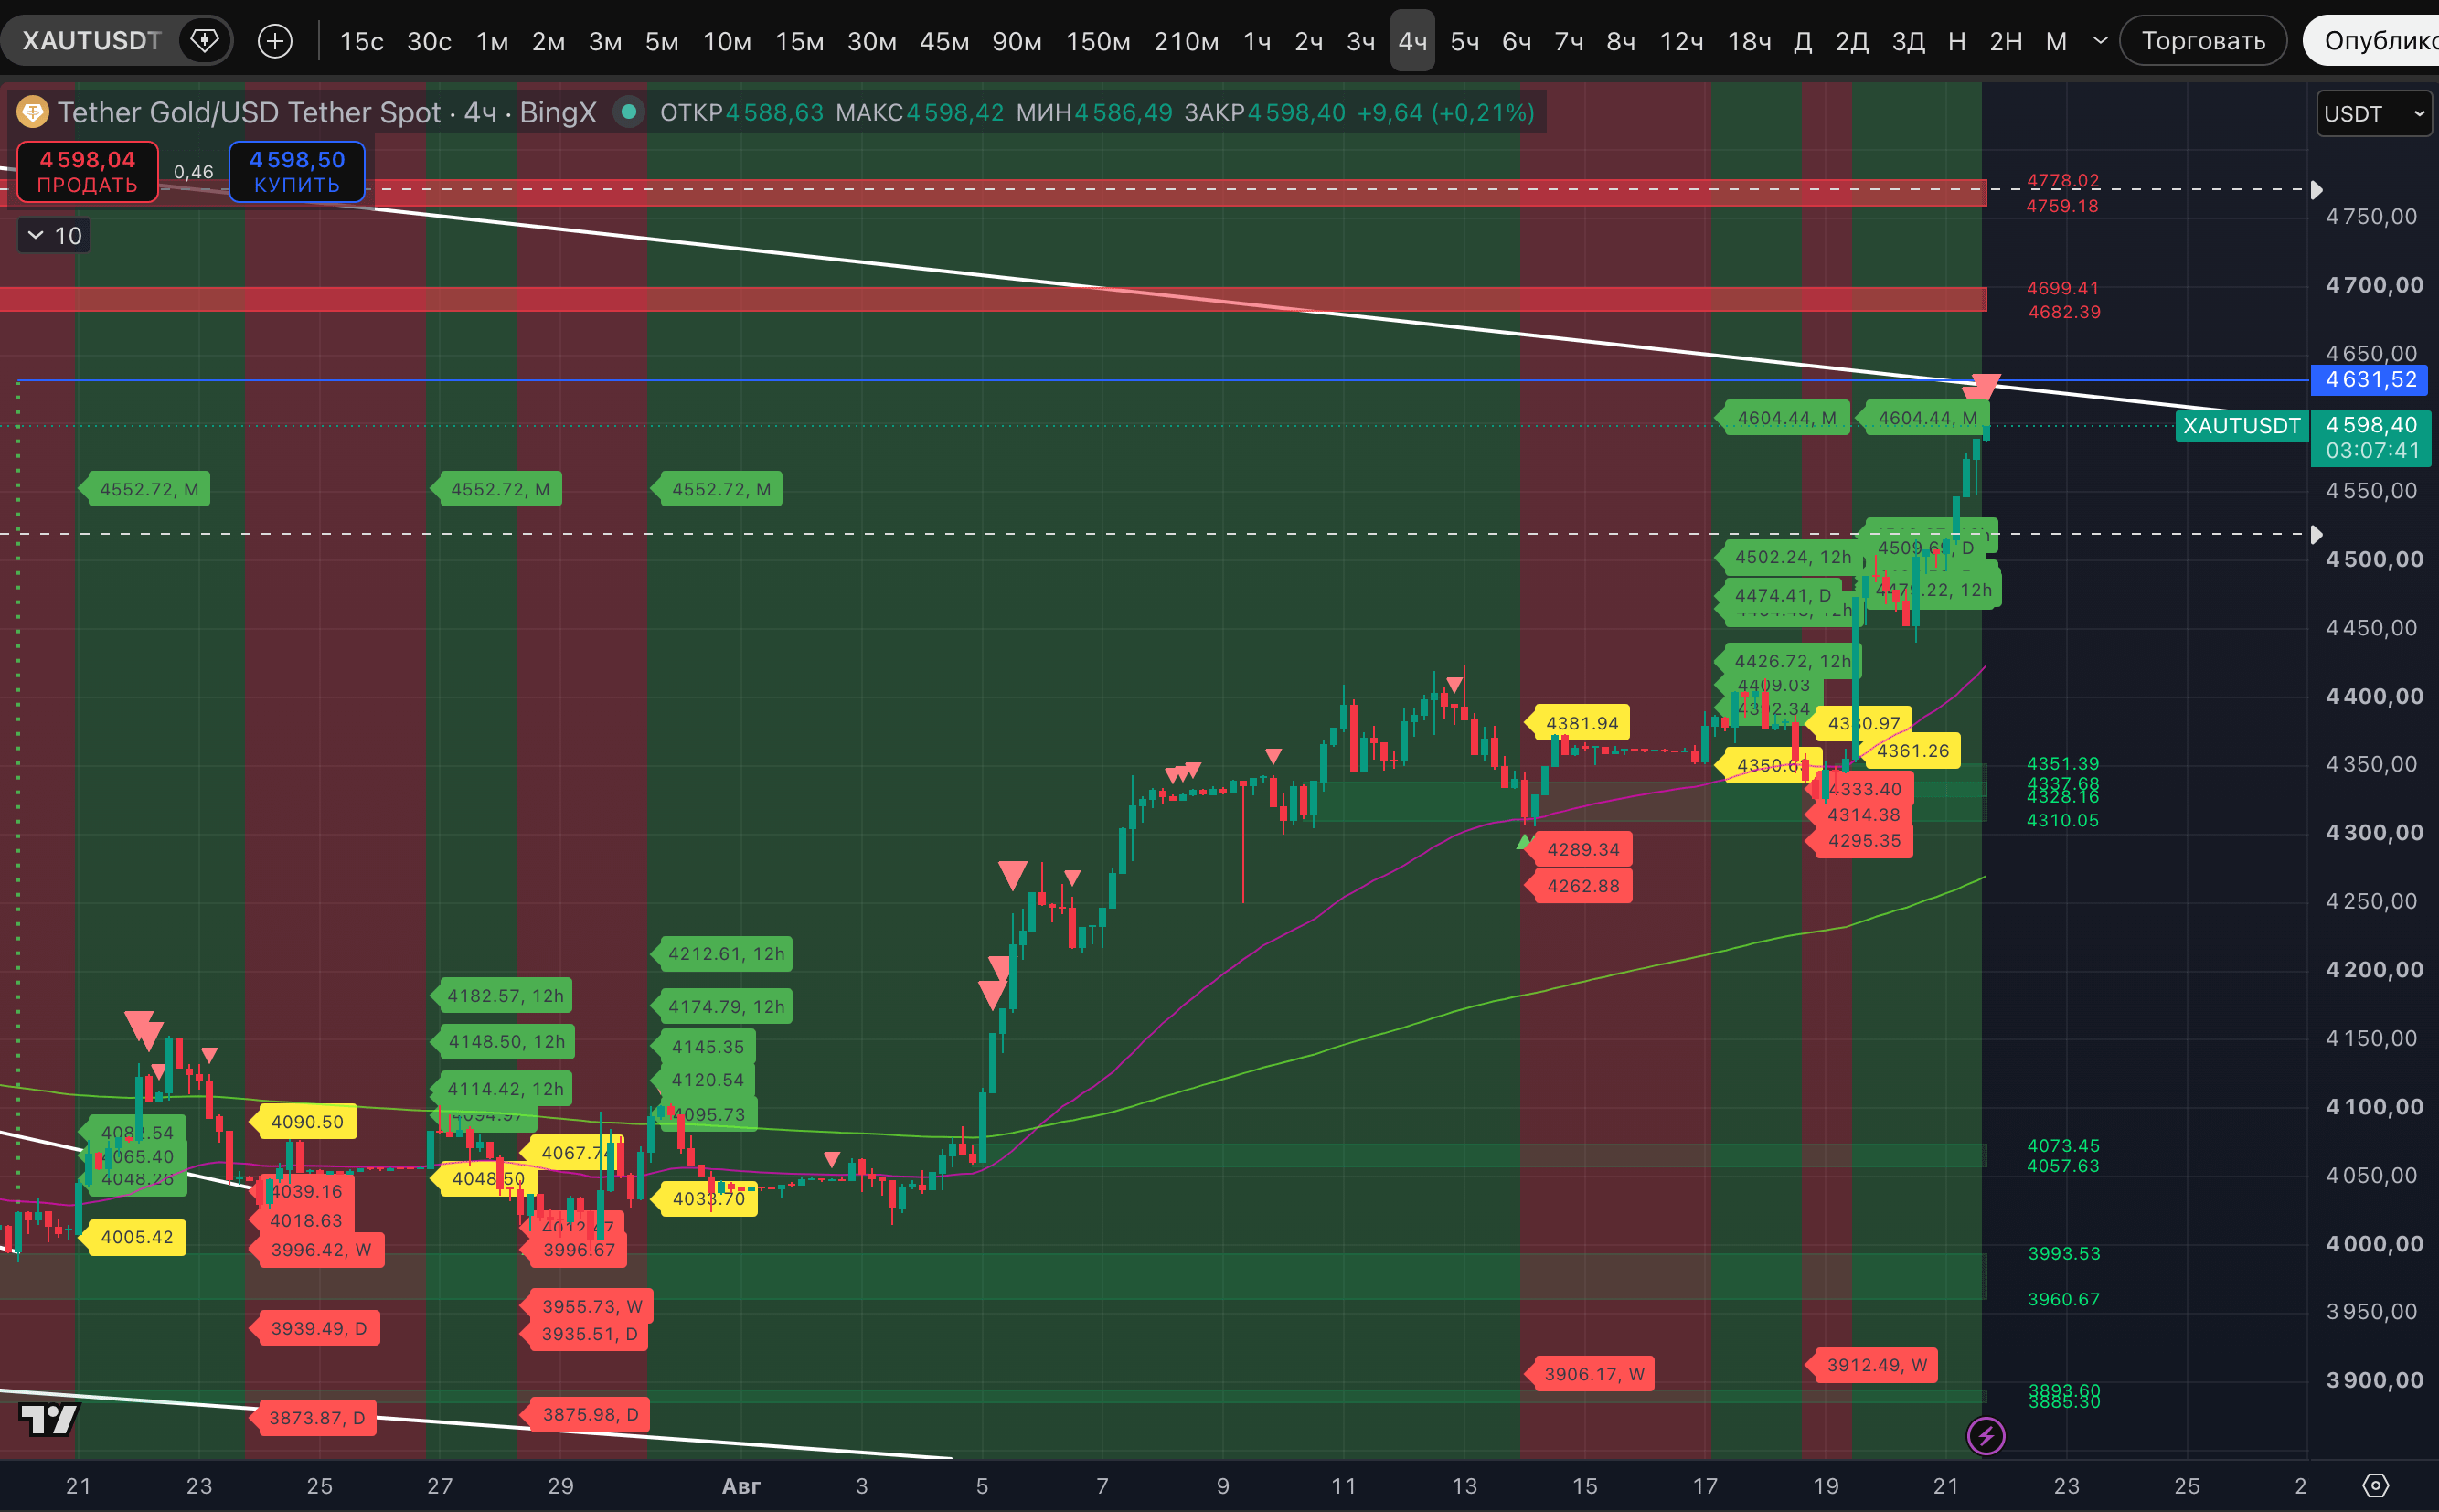
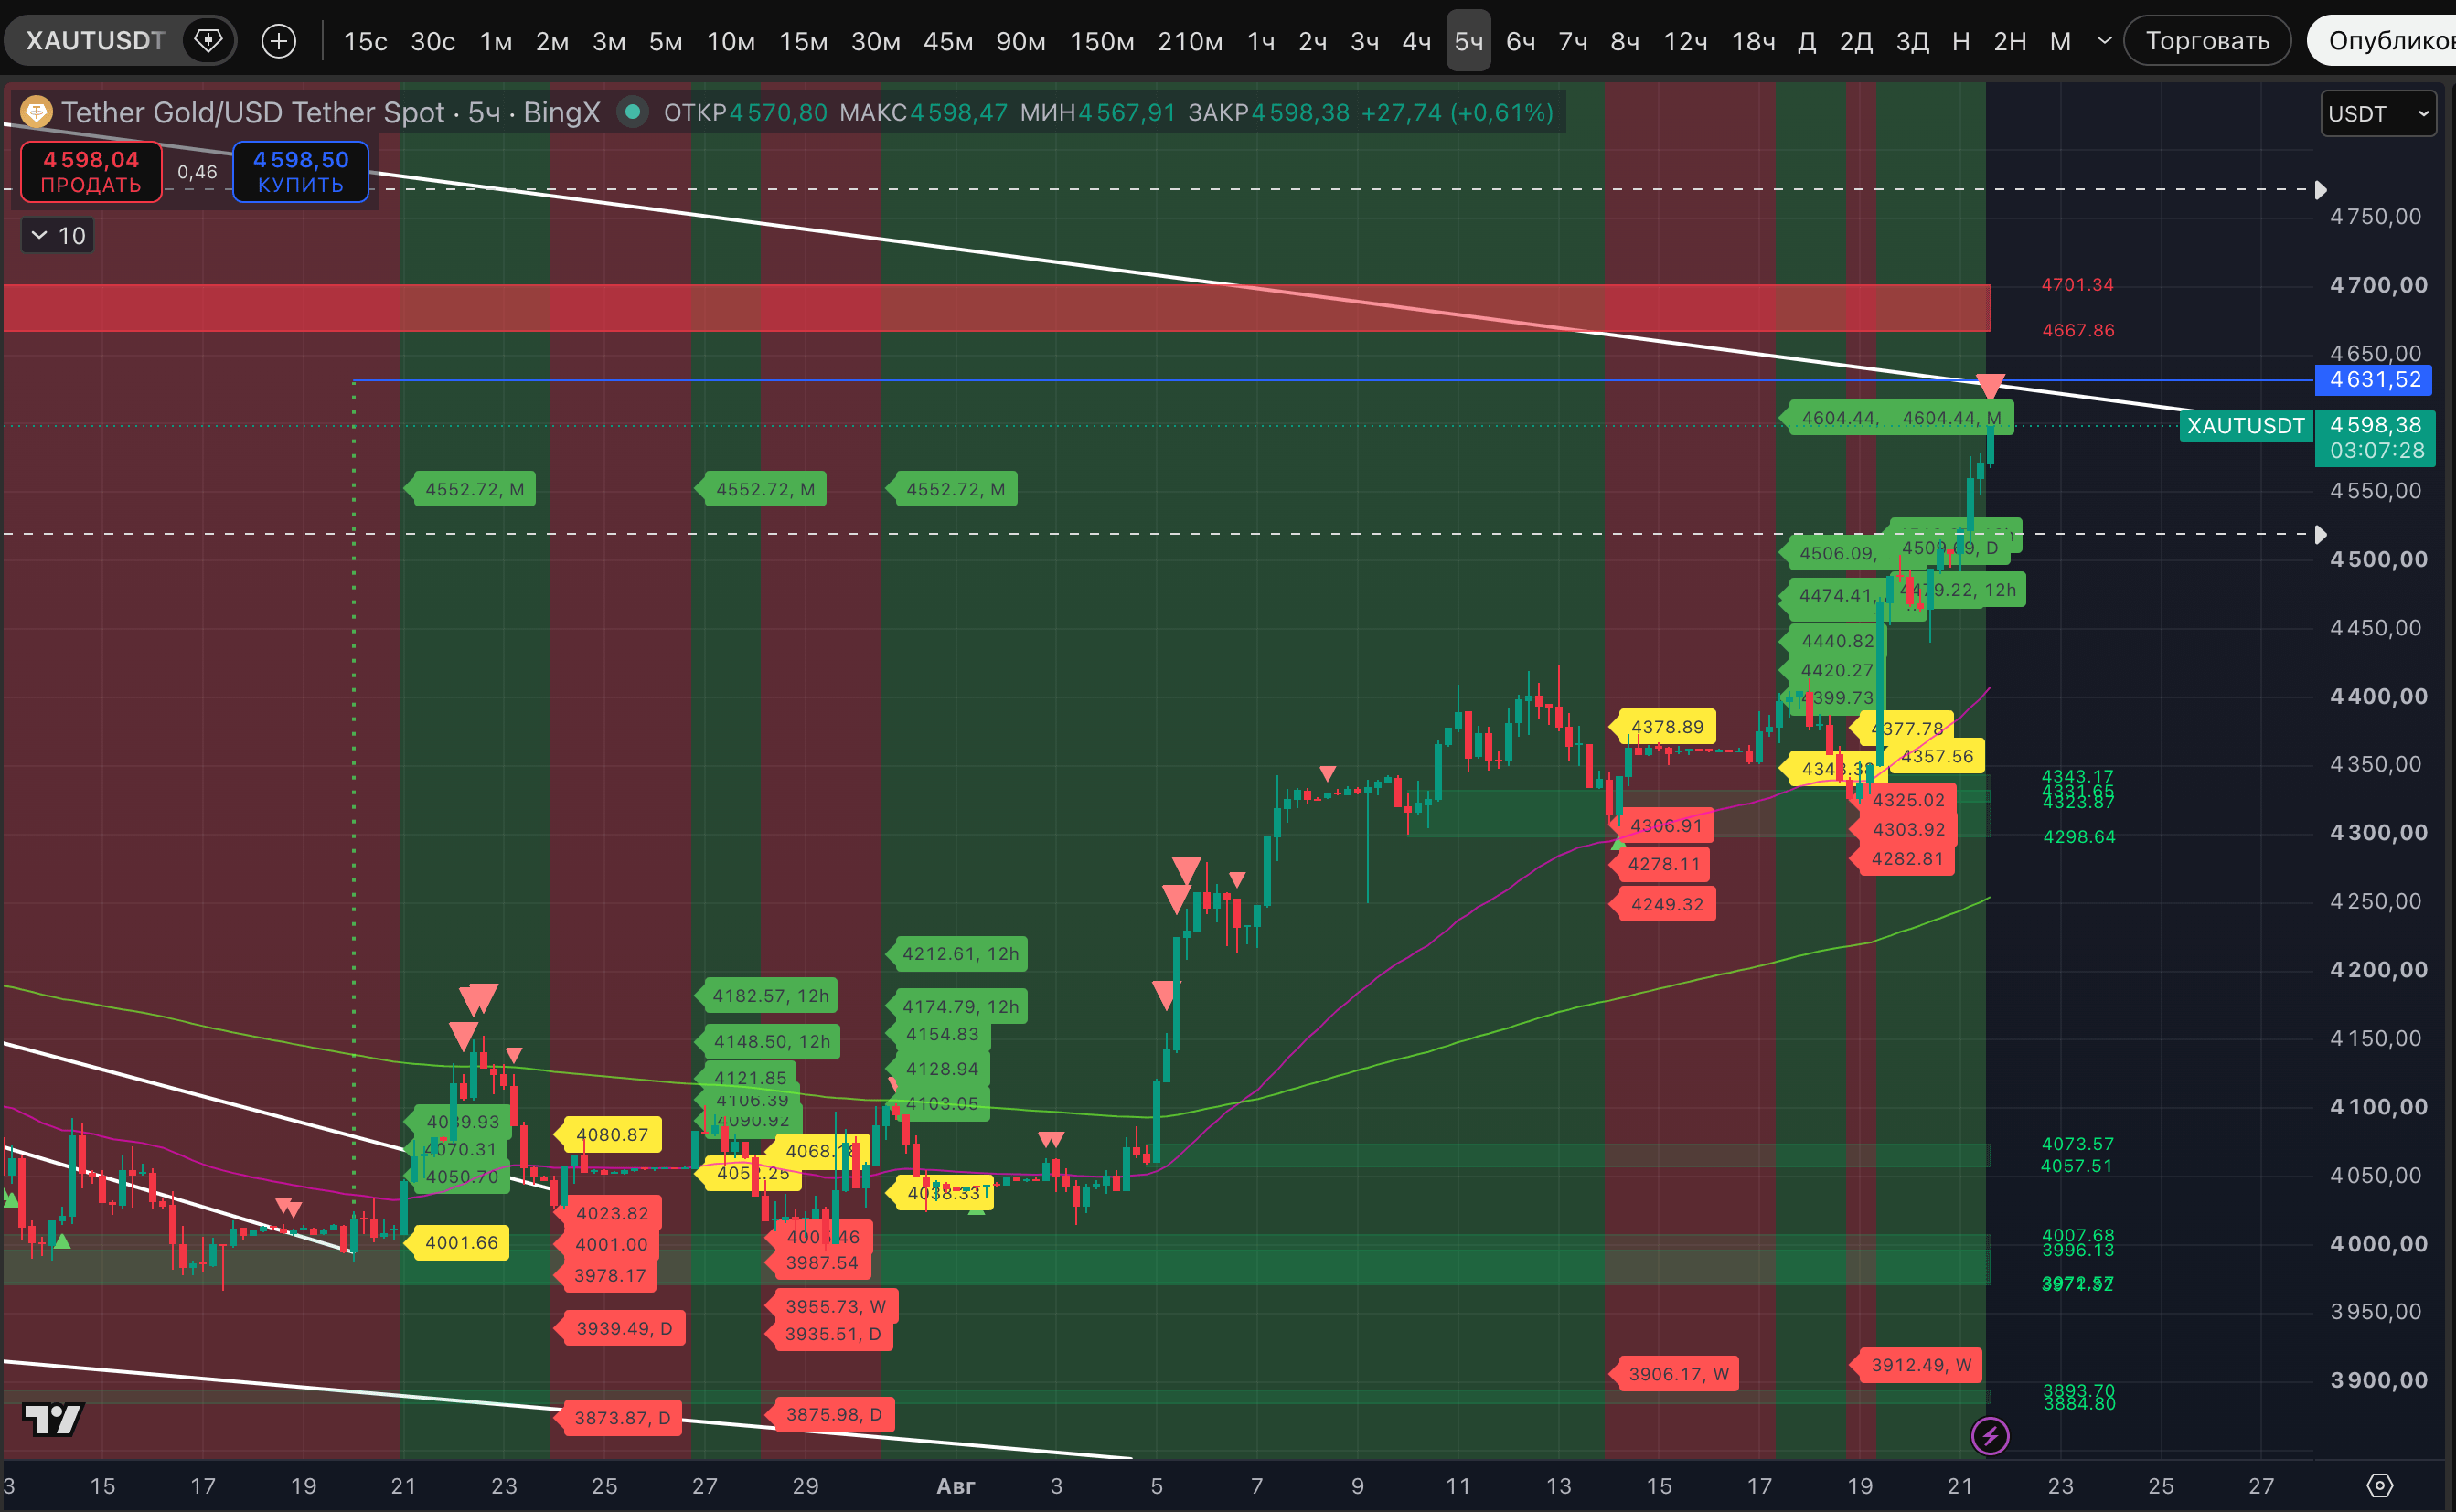
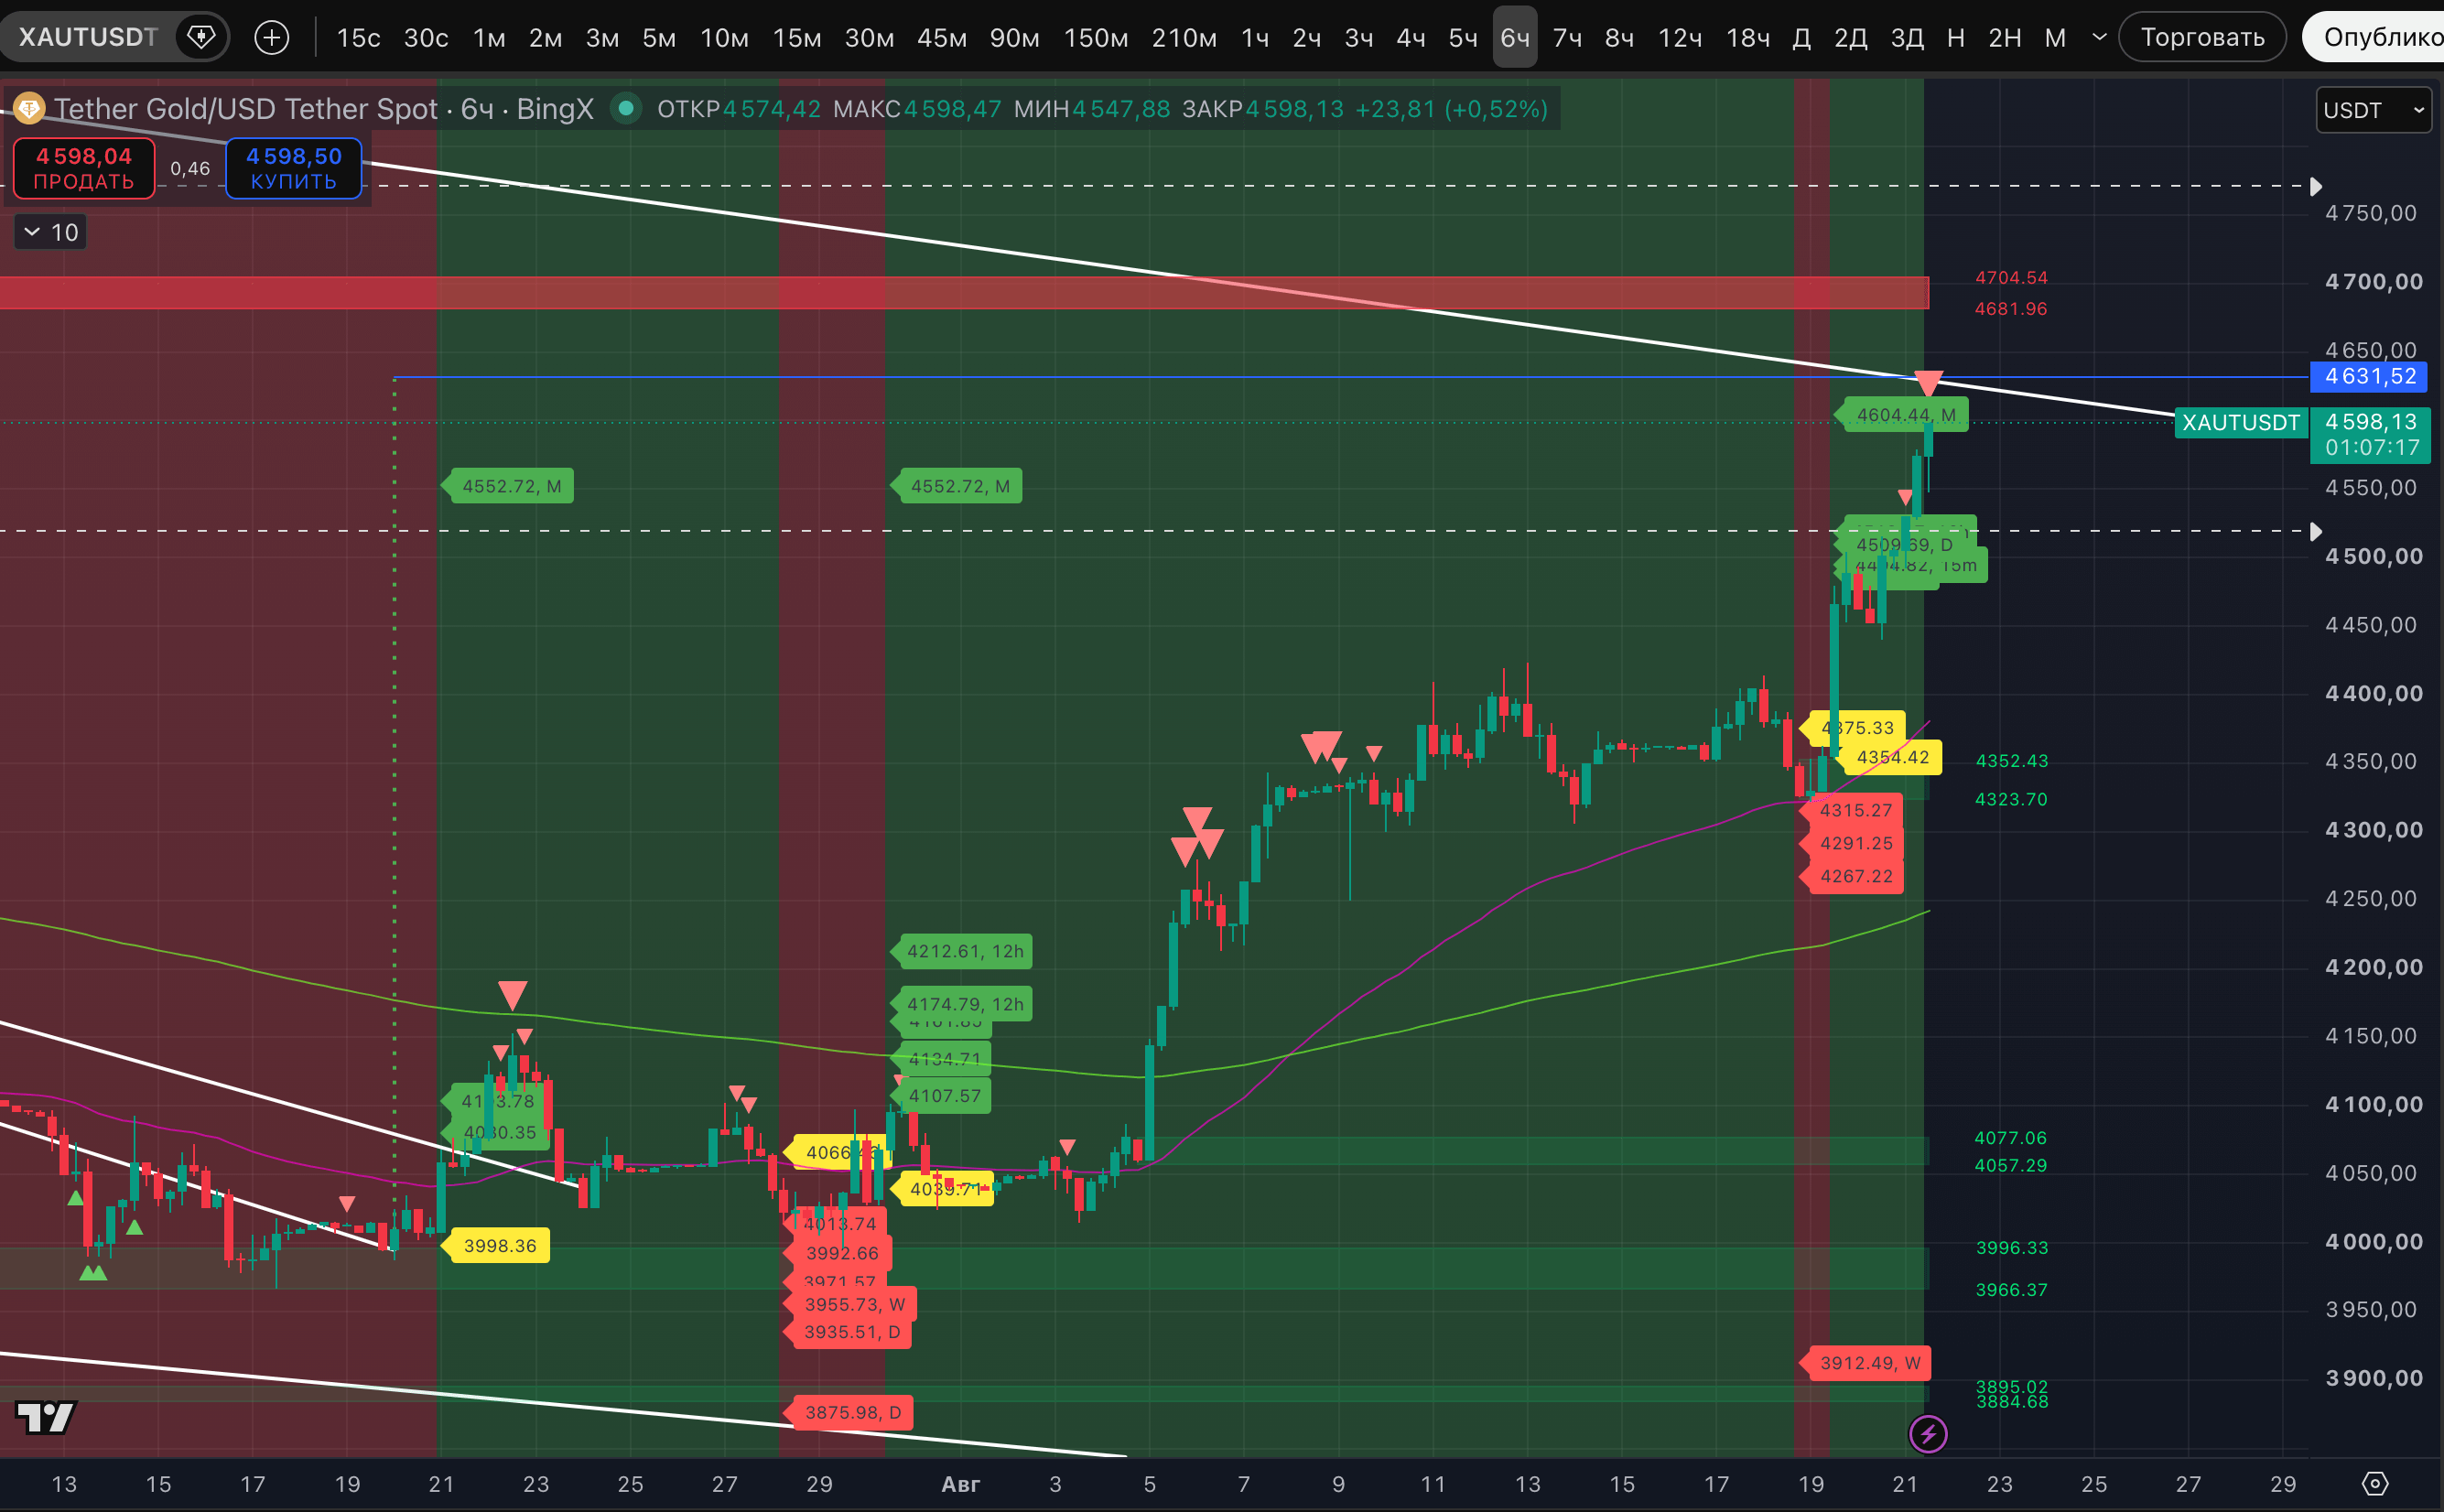
New Strong signals are building up, but on the lower timeframes, as you can see from the screenshots.
On June 22, we wrote:
"... We stick to our opinion: from these markers, the price is expected to go noticeably higher. We will repeat—within our expectations, this could quite well be a move toward the $4,878-$4,911 area. If the pullback is weaker and there are signals that it is ending, then the interesting zone for adding to the short for us will be $4,452-$4,592. This liquidity zone as resistance on the weekly timeframe is present on XAUT..."
And a month later, on July 22, we clarified the plans after the price first dropped into a sustained downtrend on the 2-week timeframe since December 2022:
"... Previously, we planned to add to the short on a pullback of the price toward the levels of a potential breakdown of the downtrends on the weekly timeframe (for XAUT it is $4,878, for XAU - $4,911).
- Now we are focusing on the likely price bounce toward the levels of a potential breakdown of the downtrends on the 2-week timeframe (for XAUT it is $4,618, for XAU - $4,638)..."
When the August pullback started, we made another clarification:
"... We are focusing on the likely price bounce toward the levels of a potential breakdown of the downtrends on the 2-week timeframe (for XAUT it is $4,618, for XAU - $4,638). It echoes the full target of the "Bullish Wedge." Also, on the daily timeframe there is a liquidity zone nearby that buyers will try to absorb. On #XAUT it is $4,481-$4,583. Therefore, for now we wait to see how the abundant Strong signal for a potential high plays out and whether buyers can "digest" it. We are not in a hurry to add to the short at the current price. Although the short, upon signs of weakness from the current level, now has arguments..."
We stick to our plan. The add-on will be soon. Basically, everything we are waiting for is the downtrend on the 5-minute timeframe. Big things begin small.
Reasons for concern will appear if the trendline breaks and if a sustained uptrend returns on the weekly timeframe.
Recall: our short position on #XAUT with 17x leverage was opened back on March 6 with a small amount due to the downtrend signal on the 12-hour timeframe. Then we added and increased the position threefold on April 20. And on April 29, on the break of yet another sustained downtrend on the daily timeframe, the third sell was made. As a result, the average entry price for the short is $4,735.17.
We laid out the full logic of the long-term gold short and explained it in a number of posts. Now, while the asset is in a downtrend on the weekly and 2-week timeframes, we assume that the long-term price growth that began in the 1980s has ended. If the downtrends start to break, then it will make sense to step back, take the current profit, and look from the sidelines. If the downtrend breaks on the 2-week timeframe - definitely.