
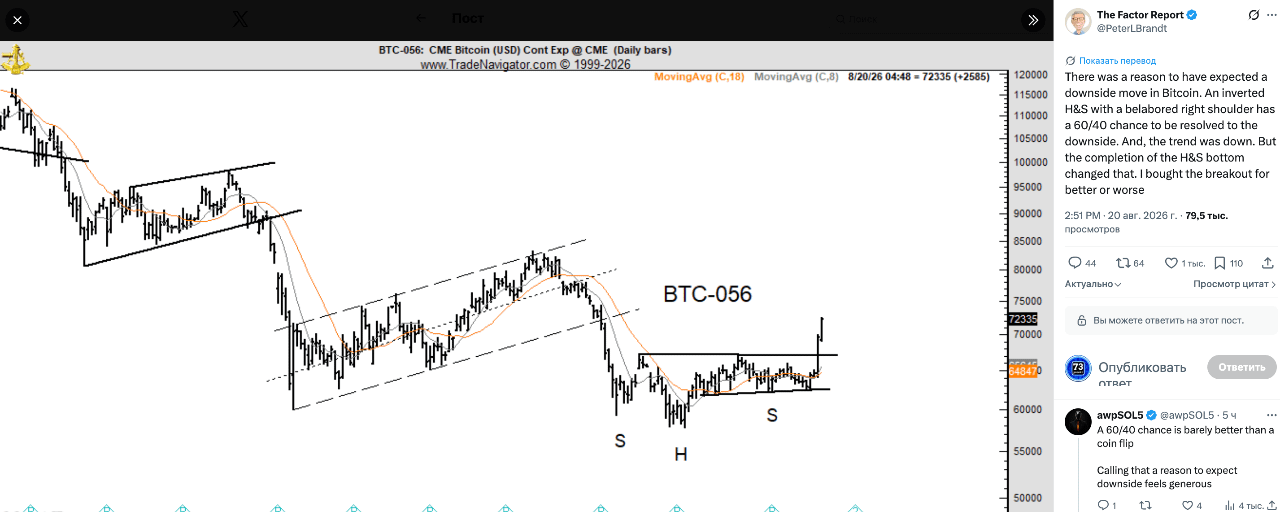

Renowned analyst Peter Brandt changed his position on BTC and bought a breakout to the upside.
Even in spring, he remained noticeably cautious about BTC. On May 13, Brandt wrote that a full bear-market bottom had NOT yet been confirmed. At the time, he was considering a move of #BTC within a possible bearish channel and allowing for further downside.
On 5 July, Brandt was considering selling part of his BTC to buy gold. Expecting that gold could outperform BTC.
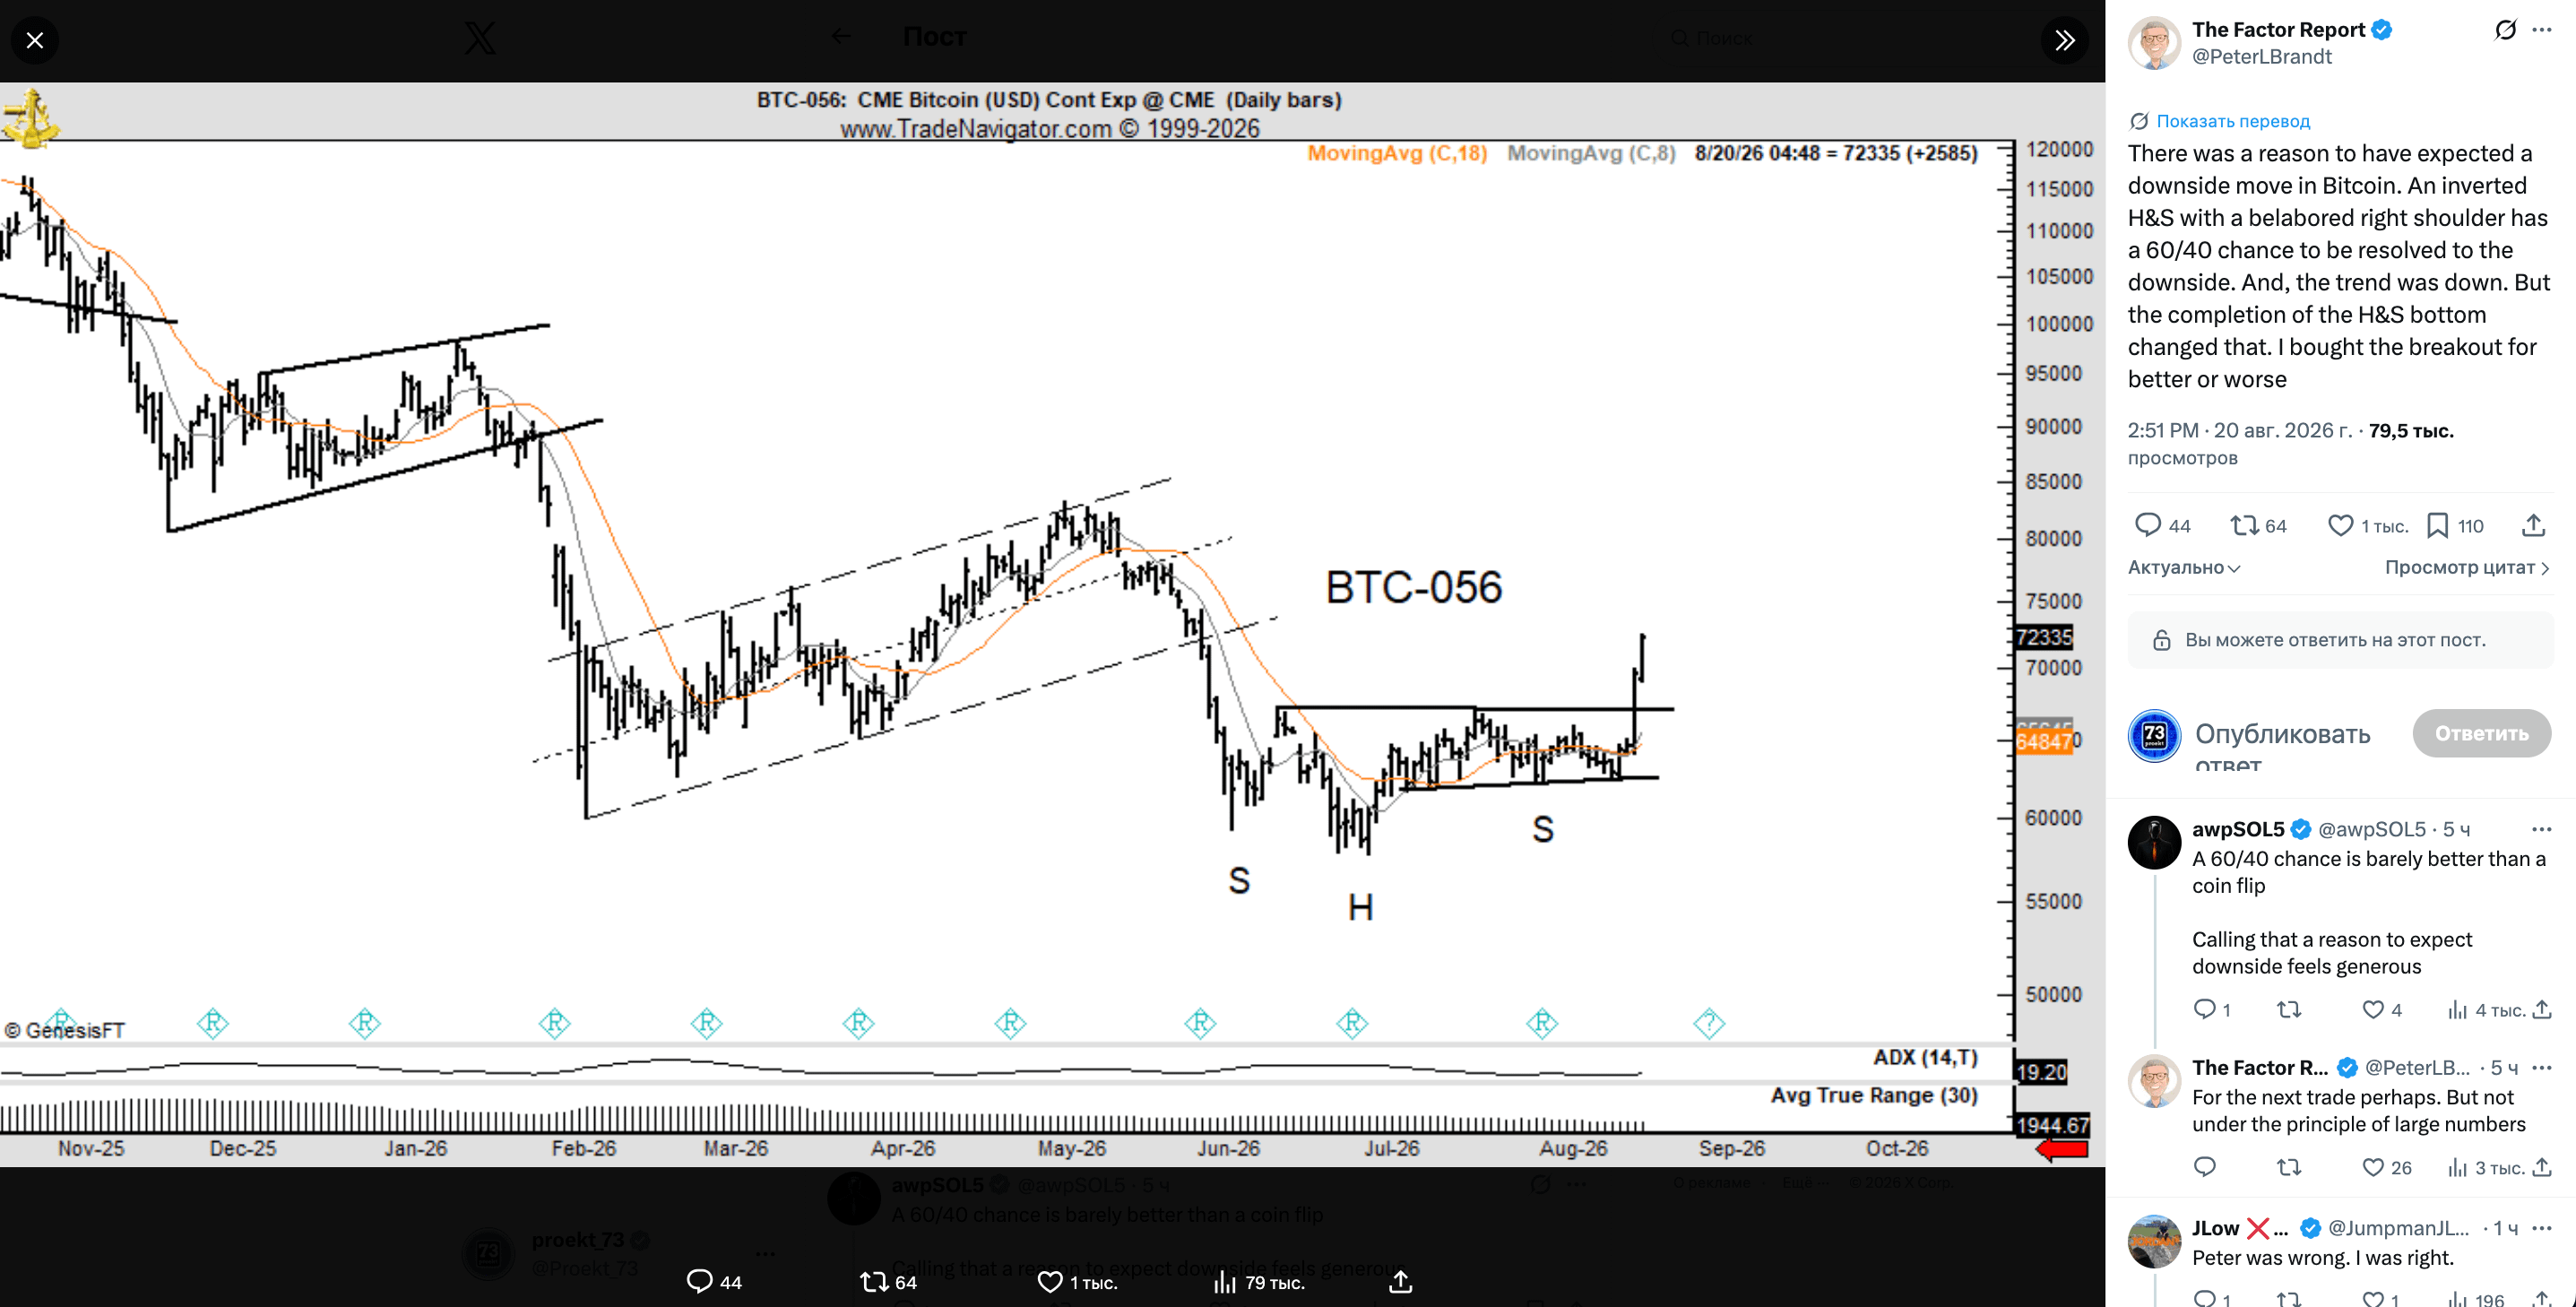
BUT now, in his opinion, the technical picture has changed. On the fresh chart, Brandt shows a formed inverted pattern "Head and Shoulders" and a breakout above its resistance line. After the breakout upward, BTC rose above $72,000.
Let us remind you that tonight we also wrote about pГiП on the #BTC chart, targeting the area around $76,218.
Brandt writes:
"There were grounds to expect a decline in BTC. The inverted \"head and shoulders\" with an extended right shoulder had about a 60/40 chance of resolving downward. Besides, the trend was bearish.
BUT the completion of the bottom formation \"head and shoulders\" changed the situation. I bought the breakout—for better or worse."
This is a noticeable shift in his viewpoint over the past few months. Although in the wording, you can see some doubts.
Right now, pГiП has already been partially played out, so it’s definitely not correct to call it a false one. The question is where the price will go next. Now the key question is whether #BTC can hold above the broken zone of approximately $68,000–$69,000. A return below it would call into question the full completion of the pattern, while holding above it would confirm the technical reversal.