
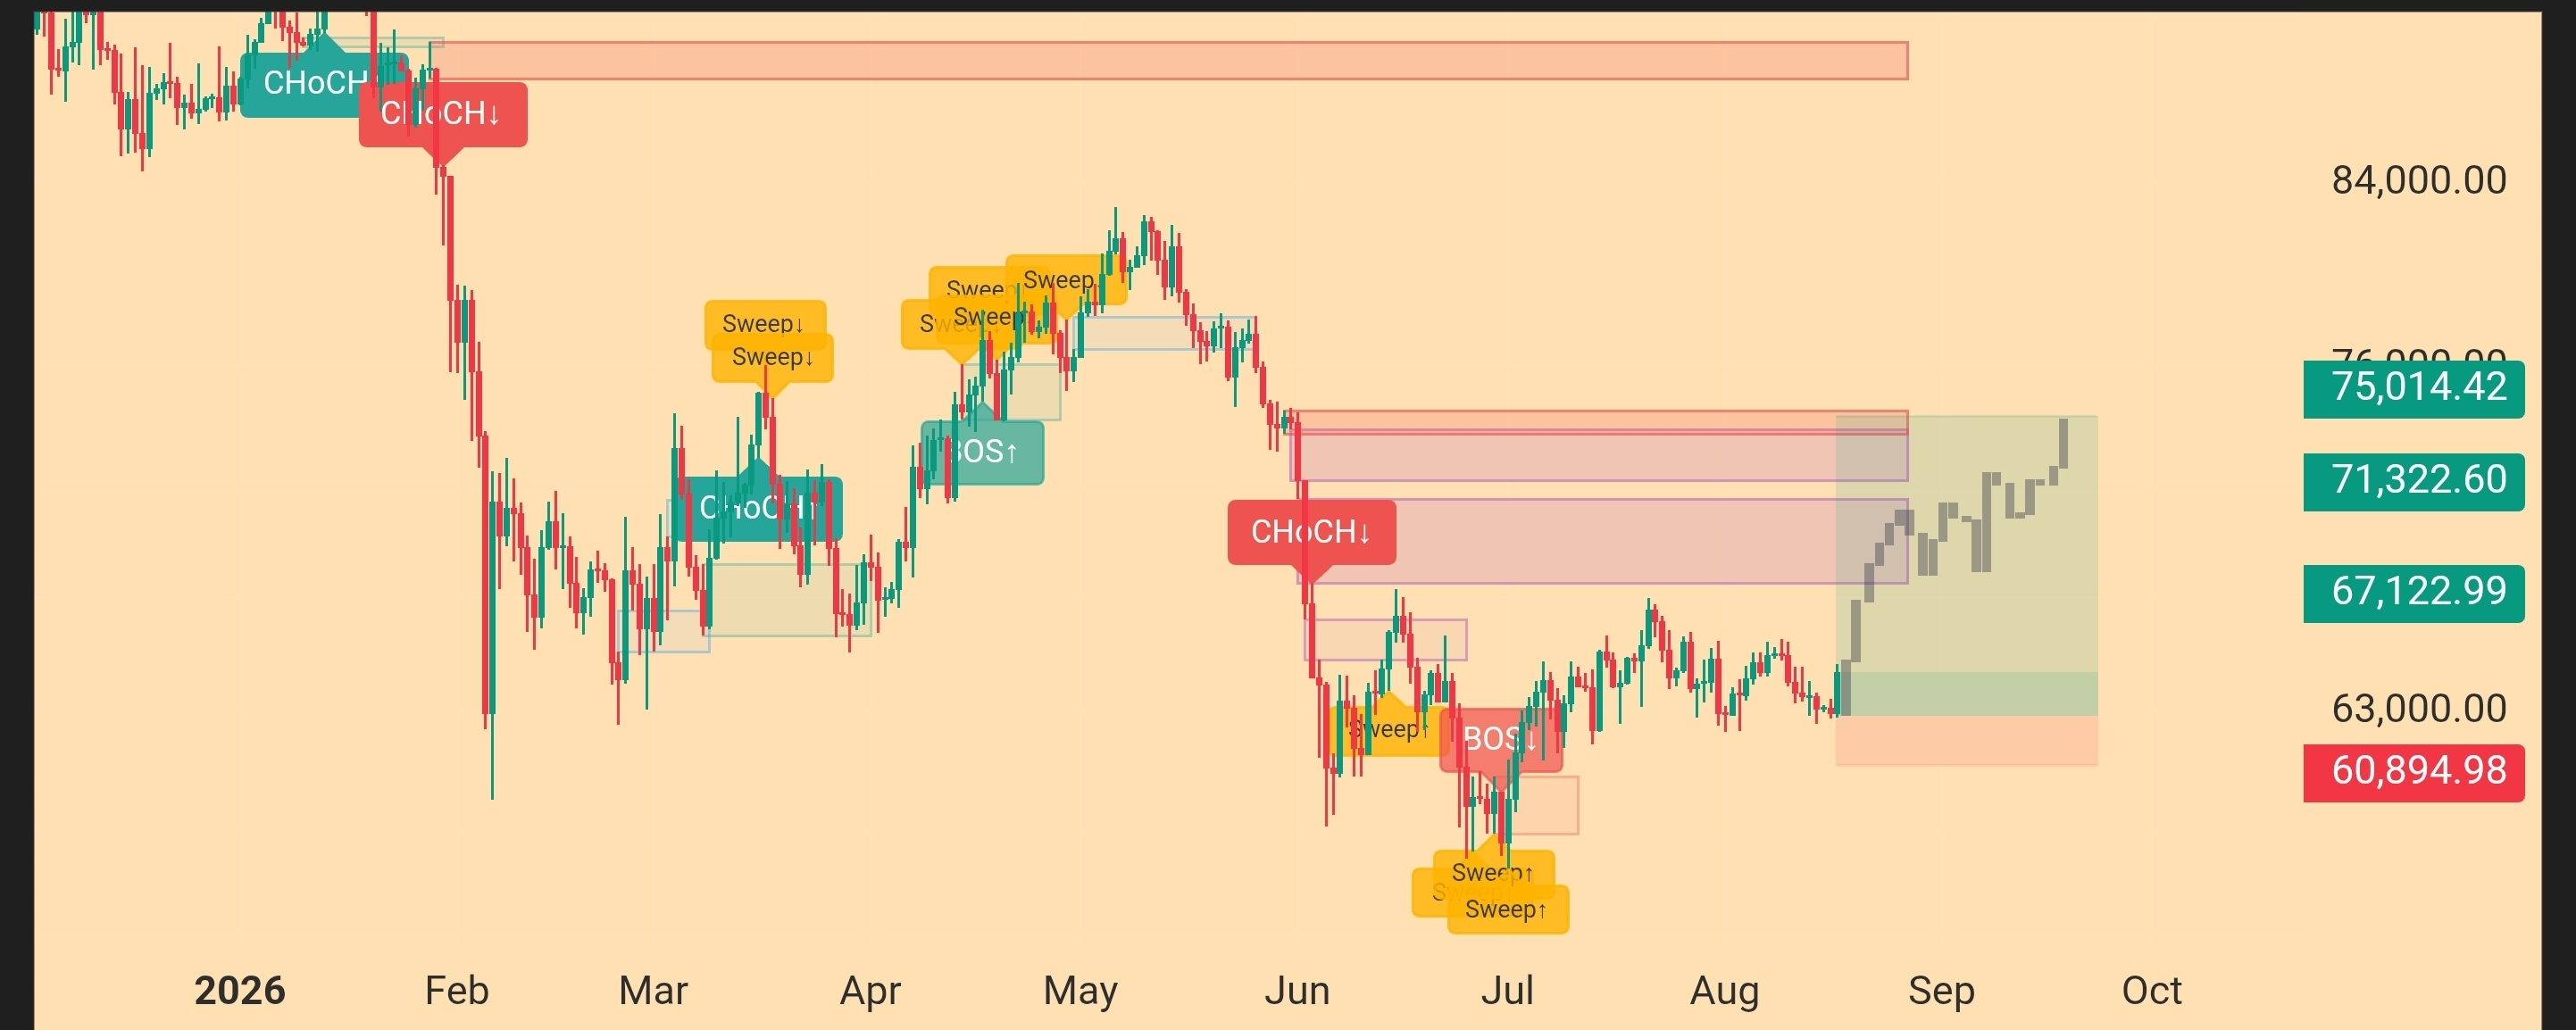

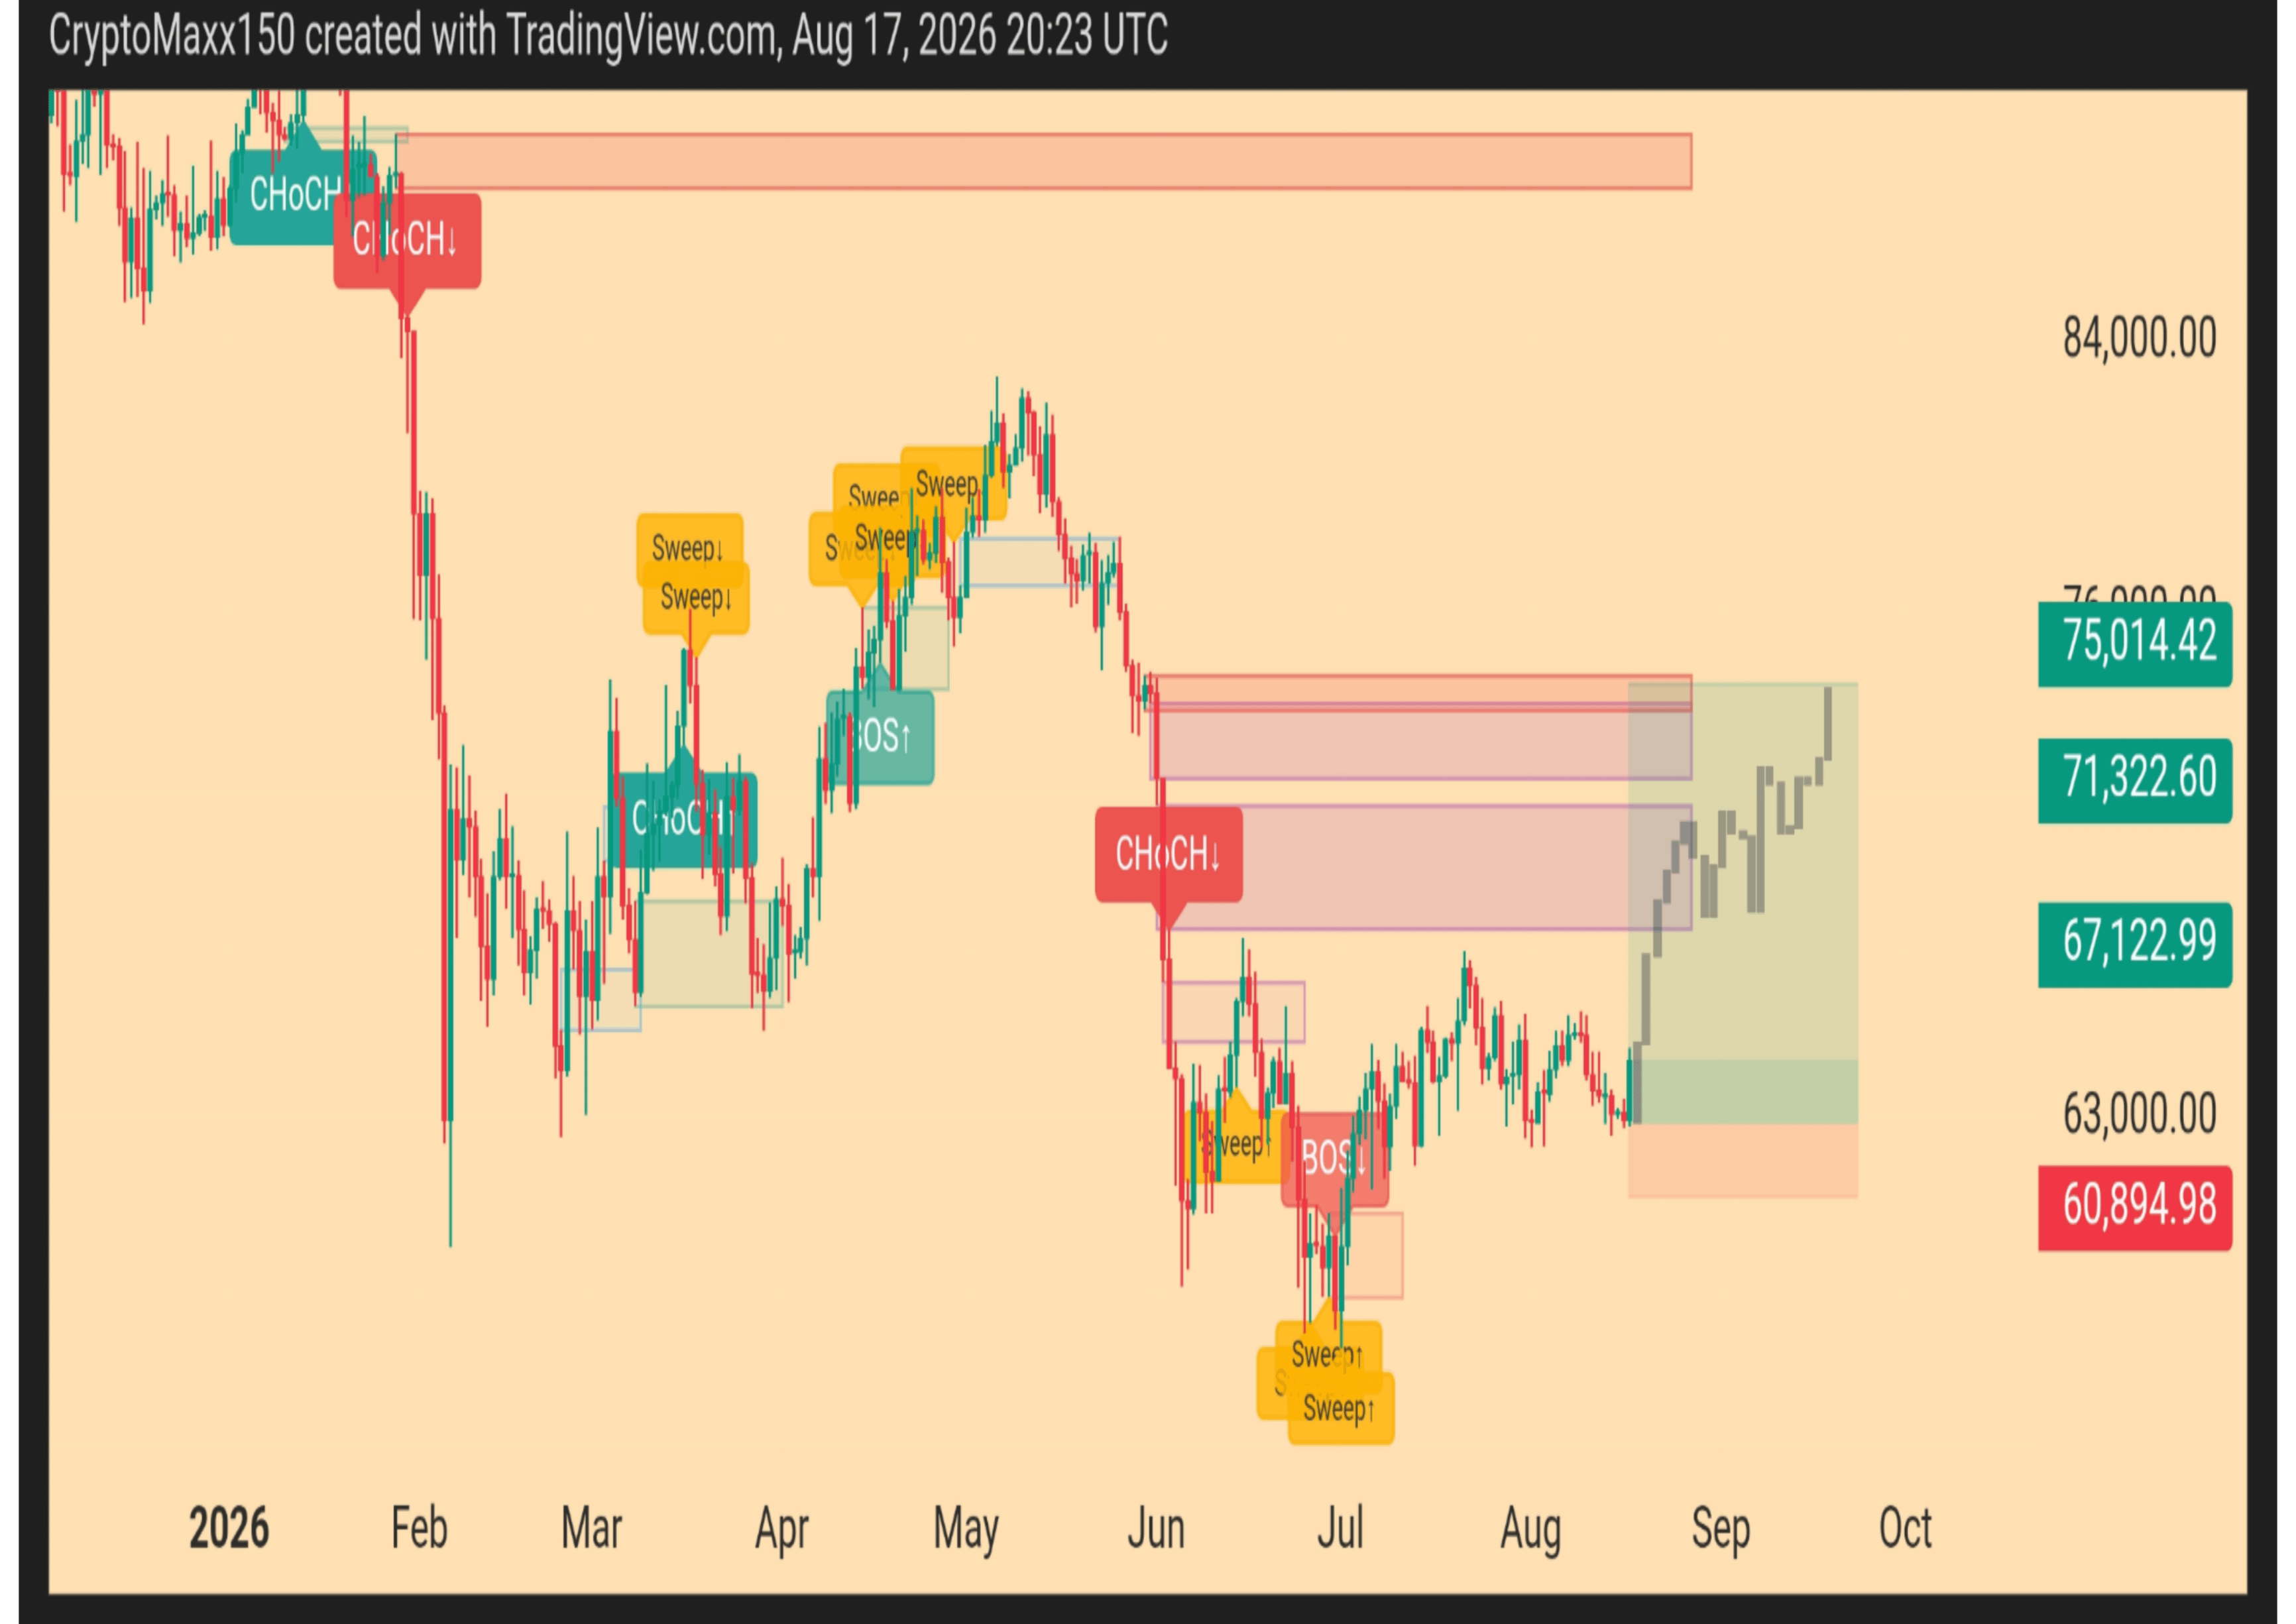
Far from the complexity of SMC terminology, the picture the indicator is currently drawing is simple:
During the last drop, price pulled liquidity below the lows more than once—these are the areas where many traders place stop-loss orders. After that, price began to stabilize and form a new structure around the $63,000 zone.
🔍 The indicator reads the scene as follows:
- Sweep = liquidity was pulled from below the lows.
- CHoCH = there has been a change in the behavior and structure of the market.
- BOS = a break in structure that confirms the price has transitioned from one phase to another.
- Right now we’re seeing price consolidation after the drop, with a possible scenario for reclaiming the higher levels.
🎯 The levels the system is watching:
67,123$ - the first important area in front of the price.
71,323$ - the second level, and entering here means getting close to a strong supply (resistance) zone.
75,014$ - the upper target of the current scenario.
The critical level at the bottom is:
🔴 60,895$
Breaking this zone and closing below it clearly weakens the current bullish scenario and forces us to re-evaluate the structure.
And the gray part you see on the chart is not a promise that the price will move exactly this way; rather, it’s the most likely price path the system is building based on liquidity and the current Market Structure: gradual upward movement, small corrections, then an attempt to reach liquidity and the higher supply zones.
💡 In simpler terms:
The indicator doesn't say: Buy because Bitcoin will go up.
it says:
The bottom liquidity has been cleaned out, and the price is still holding the consolidation zone. If the current structure continues, then the zones 67K → 71K → 75K become the next logical targets.
And the line between the bullish scenario and its failure right now is close to 60.9K.
