
张不烦
2.6k Posts

张不烦
 Square Verified+
有事请联系:公众号:南北交易随笔记。币安新老用户币手续费永久返还邀请码:BTC887。所有理解均来源于交易书籍📚、宏观经济学、人性、看别人不如多看书!
High-Frequency Trader
1.3 Years
465 Following
31.4K+ Followers
31.0K+ Liked
Posts
All
Quotes
Videos
Live
PINNED
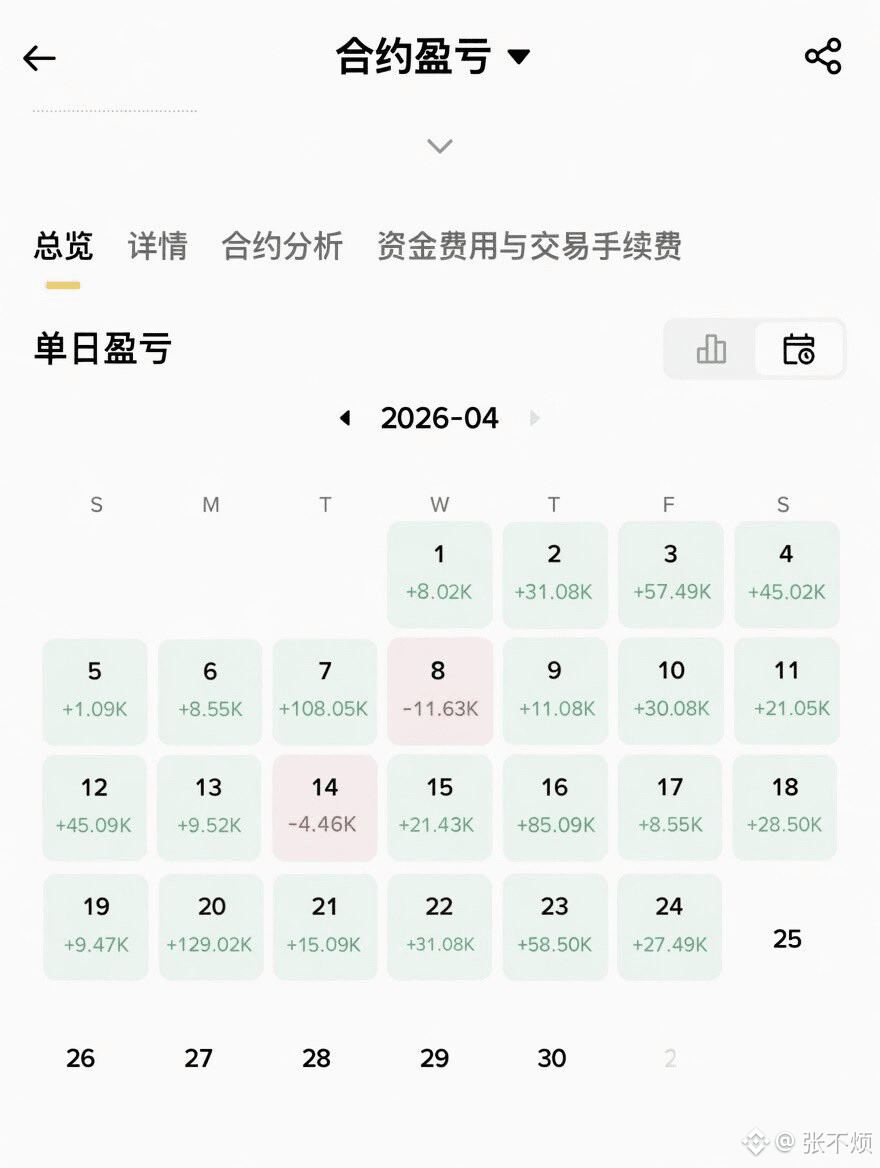
There’s a big boss in the strategy group # , so envious, watching my small holdings like three measly coins.

(Second pancake) $ETH My view:
First, let’s put the market structure in plain language.
The 2529 level above has already capped price twice, and it’s obvious someone is selling there. It’s not the kind of level you can just tap lightly and break through. If you want to push higher toward 2537 and then 2567, volume needs to pick up first, and price must stay above 2514; otherwise, it’s just false hope.
If you want to go long, focus on one thing: volume has to follow, and 2514 must not be lost easily. If that level holds, there’s still a chance for upside, first looking at 2537, then 2567.
If you want to short, don’t just stubbornly fight the trend right away. You can try shorting near 2537, but if price directly moves above 2567 and holds there, don’t force it—step aside when you should.
There is also a bearish path: if 2490 gets hit lower with volume and the rebound fails to recover, short-term momentum weakens. Then price may move down in a sequence: 2460, then 2415, then 2407.
If you want to buy the pullback cheaply, you can lightly try long near 2460, but don’t go all in. Once 2415 breaks, leave quickly.
Further down on the left side, 2388 can be used for a very small long entry, with a stop loss at 2354. This is a test position, not a heavy bet on reversal.
Structurally, it looks like a range right now: resistance at 2529, the middle axis at 2480, and support at 2430. If price effectively holds above 2480, the odds of an upside breakout increase a bit; if it falls below 2480, the hourly chart may form an M top, and then it could test 2430 or even lower.
Overhead resistance: 2514, 2537, 2567
Below support: 2490, 2460, 2415
In one sentence: watch which breaks first, 2514 or 2480—don’t start by guessing the top or the bottom.
First, let’s put the market structure in plain language.
The 2529 level above has already capped price twice, and it’s obvious someone is selling there. It’s not the kind of level you can just tap lightly and break through. If you want to push higher toward 2537 and then 2567, volume needs to pick up first, and price must stay above 2514; otherwise, it’s just false hope.
If you want to go long, focus on one thing: volume has to follow, and 2514 must not be lost easily. If that level holds, there’s still a chance for upside, first looking at 2537, then 2567.
If you want to short, don’t just stubbornly fight the trend right away. You can try shorting near 2537, but if price directly moves above 2567 and holds there, don’t force it—step aside when you should.
There is also a bearish path: if 2490 gets hit lower with volume and the rebound fails to recover, short-term momentum weakens. Then price may move down in a sequence: 2460, then 2415, then 2407.
If you want to buy the pullback cheaply, you can lightly try long near 2460, but don’t go all in. Once 2415 breaks, leave quickly.
Further down on the left side, 2388 can be used for a very small long entry, with a stop loss at 2354. This is a test position, not a heavy bet on reversal.
Structurally, it looks like a range right now: resistance at 2529, the middle axis at 2480, and support at 2430. If price effectively holds above 2480, the odds of an upside breakout increase a bit; if it falls below 2480, the hourly chart may form an M top, and then it could test 2430 or even lower.
Overhead resistance: 2514, 2537, 2567
Below support: 2490, 2460, 2415
In one sentence: watch which breaks first, 2514 or 2480—don’t start by guessing the top or the bottom.


(Big pancake) $BTC My view:
At the moment, it’s still just a short-term pause within the bulls; this is not a turn to weakness. On the chart, there’s an arc base with a cup-and-handle overlay. The arc is pointing upward toward 81,500, and you can treat the handle as the current channel. Today, it’s likely to just range within that channel and wait for direction. If it rises and then consolidates halfway for a few days, that’s completely normal—don’t scare yourself.
If you want to go long, wait for a breakout with volume that pushes through 81,500, then join on the right side. If you’re more aggressive, you can enter a little earlier. If the 1-hour chart holds steadily above 81,500, first look at 82,800, then 84,400.
If you want to short, wait for a breakdown with volume that breaks 80,450. After that, if the retest bounces but fails to reclaim it, then short again on the right side. If the 4-hour chart truly breaks 80,450, then the next levels below are 79,200 and 77,800.
For pullbacks: as long as it doesn’t break 80,400, it’s just high-level back-and-forth churning—your range is between 81,500 and 80,400. If 80,400 breaks with volume and directly gets smashed through, there’s no “fuel” under the big red candle—then the drop will be faster than the rise. Long positions should exit quickly; reduce risk and cut if you need to.
Overhead resistance: 81,500, 82,800, 84,400.
Support below: 80,400, 79,200, 77,800.
ETH: watch 2485 as defense. If it gets back above 2510, then chase longs; if 2500 breaks, the short-term bearish move is back on the table. For BTC, it’s still bull-side consolidation: if 81,500 breaks, look for 82,800. If 80,400 is lost, then switch back to short.
Act only when there’s volume at the key levels. If defense breaks, withdraw—don’t go against the trend. Only the money in your hand counts as yours.
At the moment, it’s still just a short-term pause within the bulls; this is not a turn to weakness. On the chart, there’s an arc base with a cup-and-handle overlay. The arc is pointing upward toward 81,500, and you can treat the handle as the current channel. Today, it’s likely to just range within that channel and wait for direction. If it rises and then consolidates halfway for a few days, that’s completely normal—don’t scare yourself.
If you want to go long, wait for a breakout with volume that pushes through 81,500, then join on the right side. If you’re more aggressive, you can enter a little earlier. If the 1-hour chart holds steadily above 81,500, first look at 82,800, then 84,400.
If you want to short, wait for a breakdown with volume that breaks 80,450. After that, if the retest bounces but fails to reclaim it, then short again on the right side. If the 4-hour chart truly breaks 80,450, then the next levels below are 79,200 and 77,800.
For pullbacks: as long as it doesn’t break 80,400, it’s just high-level back-and-forth churning—your range is between 81,500 and 80,400. If 80,400 breaks with volume and directly gets smashed through, there’s no “fuel” under the big red candle—then the drop will be faster than the rise. Long positions should exit quickly; reduce risk and cut if you need to.
Overhead resistance: 81,500, 82,800, 84,400.
Support below: 80,400, 79,200, 77,800.
ETH: watch 2485 as defense. If it gets back above 2510, then chase longs; if 2500 breaks, the short-term bearish move is back on the table. For BTC, it’s still bull-side consolidation: if 81,500 breaks, look for 82,800. If 80,400 is lost, then switch back to short.
Act only when there’s volume at the key levels. If defense breaks, withdraw—don’t go against the trend. Only the money in your hand counts as yours.
(Bing Cake 2) $ETH My take:
Overall, it’s still being pressed down by that line above. Any rebound is just a breather, not a real turn to strength. On the hourly chart, each recent high and low is lower than the last. If you want a proper upward push, first you need to chew through 2420. Break
2420, and there will be room to move toward 2485. If you can’t take it down, then expect it to range between 2420 and 2360, going back and forth.
Right now, I’m watching 2400. If it holds above on increased volume, go long on the right side; if it falls back, cut losses. If 2370 breaks on increased volume, then directly chase a short.
Up above, you can short as a counter around 2455; if it breaks 2495, stop out.
On the left side, place a long order at 2255 in advance, and stop out below 2220.
For the 4-hour chart: if it loses 2355, then look down toward 2310 and 2280.
Overall, it’s still being pressed down by that line above. Any rebound is just a breather, not a real turn to strength. On the hourly chart, each recent high and low is lower than the last. If you want a proper upward push, first you need to chew through 2420. Break
2420, and there will be room to move toward 2485. If you can’t take it down, then expect it to range between 2420 and 2360, going back and forth.
Right now, I’m watching 2400. If it holds above on increased volume, go long on the right side; if it falls back, cut losses. If 2370 breaks on increased volume, then directly chase a short.
Up above, you can short as a counter around 2455; if it breaks 2495, stop out.
On the left side, place a long order at 2255 in advance, and stop out below 2220.
For the 4-hour chart: if it loses 2355, then look down toward 2310 and 2280.
Drinking until dawn for three consecutive days…

(Bingbing) $ETH My take:
First, the conclusion: the trend is extremely soft; the channel broke too early. Right now it’s just grinding after the drop—don’t treat it as a bottom.
Watch one level first: **2482**.
If it can bounce up to here, then there’s something to talk about; if it can’t reach it, then any rebound is just an exit opportunity.
If 2482 doesn’t hold, but 2432 is still standing, most likely it will drift downward slowly—don’t expect a violent sell-off.
If 2432 also breaks, then it’s basically time to look at 2374.
Operations in simple terms:
When you can go long: if volume confirms and price holds above 2447, you can chase a bit along with it. First look at 2486, then 2515. Don’t skimp on the stop loss—set it.
When you can go short: if 2425 gets slammed down with heavy volume and the rebound lacks strength, you can short. Keep your stop loss well-defined. On the 4-hour chart, if it breaks below 2412 again, then the targets shift to 2386 and 2341.
If you’re thinking of buying the dip cheaply: near 2375 you can place a small order to test the waters first. If 2341 breaks, don’t stubbornly hold—get out quickly.
Want to short from higher levels: you can try a short near 2515. If it pushes through 2539, then acknowledge the mistake—don’t stubbornly hold on.
More left-side idea: 2360 can be used to set up a long position first. If 2313 breaks, cut it immediately.
There are three resistance levels: 2447, 2486, 2515.
There are also three support levels: 2425, 2386, 2341.
In one sentence: don’t rush to bottom-fish now—first see whether it can reclaim 2482. Once it reclaims it, then talk about direction; if it can’t, treat it as a rebound to reduce positions.
First, the conclusion: the trend is extremely soft; the channel broke too early. Right now it’s just grinding after the drop—don’t treat it as a bottom.
Watch one level first: **2482**.
If it can bounce up to here, then there’s something to talk about; if it can’t reach it, then any rebound is just an exit opportunity.
If 2482 doesn’t hold, but 2432 is still standing, most likely it will drift downward slowly—don’t expect a violent sell-off.
If 2432 also breaks, then it’s basically time to look at 2374.
Operations in simple terms:
When you can go long: if volume confirms and price holds above 2447, you can chase a bit along with it. First look at 2486, then 2515. Don’t skimp on the stop loss—set it.
When you can go short: if 2425 gets slammed down with heavy volume and the rebound lacks strength, you can short. Keep your stop loss well-defined. On the 4-hour chart, if it breaks below 2412 again, then the targets shift to 2386 and 2341.
If you’re thinking of buying the dip cheaply: near 2375 you can place a small order to test the waters first. If 2341 breaks, don’t stubbornly hold—get out quickly.
Want to short from higher levels: you can try a short near 2515. If it pushes through 2539, then acknowledge the mistake—don’t stubbornly hold on.
More left-side idea: 2360 can be used to set up a long position first. If 2313 breaks, cut it immediately.
There are three resistance levels: 2447, 2486, 2515.
There are also three support levels: 2425, 2386, 2341.
In one sentence: don’t rush to bottom-fish now—first see whether it can reclaim 2482. Once it reclaims it, then talk about direction; if it can’t, treat it as a rebound to reduce positions.
(Two pancakes) $ETH My view:
The triangular pattern has already broken, and the price once dropped through 2440. Now it depends on whether it will fake a breakdown and whether it can reclaim that level.
If it can reclaim the triangle, the slow grind down could pause and the rebound can be watched around 2535. If it can’t reclaim it, then it will likely continue to test 2440. If this level also can’t hold, then it basically needs to run toward 2350.
One reminder: the recent upswing volume is really poor, and it’s not following the trendline either—just dithering. Don’t get lured into it; there’s not much trading value.
For going long: wait for a volume-backed breakout above 2471 before chasing; if it gets reclaimed, place a stop-loss and exit if needed. If the 1-hour chart holds above 2471, the upside is 2500 to 2540.
For going short: if 2440 breaks down on strong volume, chase the short. Make sure your stop-loss is set properly. If the 4-hour chart breaks 2440, then look for 2385 down to 2340.
Pullback play: when 2385 confirms support, you can take a small long position. If it breaks below 2355, exit.
Short at higher levels: around 2560 you can consider a short; if price breaks above 2590, stop out.
Left-side opportunity: buy around 2320; stop-loss if it drops below 2285.
The triangular pattern has already broken, and the price once dropped through 2440. Now it depends on whether it will fake a breakdown and whether it can reclaim that level.
If it can reclaim the triangle, the slow grind down could pause and the rebound can be watched around 2535. If it can’t reclaim it, then it will likely continue to test 2440. If this level also can’t hold, then it basically needs to run toward 2350.
One reminder: the recent upswing volume is really poor, and it’s not following the trendline either—just dithering. Don’t get lured into it; there’s not much trading value.
For going long: wait for a volume-backed breakout above 2471 before chasing; if it gets reclaimed, place a stop-loss and exit if needed. If the 1-hour chart holds above 2471, the upside is 2500 to 2540.
For going short: if 2440 breaks down on strong volume, chase the short. Make sure your stop-loss is set properly. If the 4-hour chart breaks 2440, then look for 2385 down to 2340.
Pullback play: when 2385 confirms support, you can take a small long position. If it breaks below 2355, exit.
Short at higher levels: around 2560 you can consider a short; if price breaks above 2590, stop out.
Left-side opportunity: buy around 2320; stop-loss if it drops below 2285.
The one-hour chart just bumped upward a bit; it’s still hard to tell whether it’s real or not. The key is to steadily move past 2486—if it can’t, all the effort will be for nothing. Only when it actually holds above 2486 will there be a chance to eye the prior high around 2550.
The lower 2372 was hit too many times and has become as fragile as paper. If the market keeps oscillating back and forth without making a new high, and then it turns back to step on 2372 again, it will most likely leak downward.
From the indicators, the bulls don’t seem to have enough strength to regain control. To turn it around, you can only wait for the main players to force a pull. If they don’t, a breakdown could happen at any time.
In terms of execution:
For going long: if price pushes through 2474 on increased volume, you can ride the move. Once it holds, then watch the range from 2507 to 2550.
For going short: if price drops below 2442 on increased volume, you can chase the short. If the four-hour chart breaks 2442, then focus on 2388–2340.
Volume is the iron rule—don’t force a move without volume, and make sure your stop-loss is set properly.
On the daily chart, 2401 is the lifeline. As long as it’s defended, things are basically fine. If the close directly breaks below 2401, then it enters a daily-level pullback. Only if it nails and holds above 2401 will there be a chance to test the resistance level above.
The lower 2372 was hit too many times and has become as fragile as paper. If the market keeps oscillating back and forth without making a new high, and then it turns back to step on 2372 again, it will most likely leak downward.
From the indicators, the bulls don’t seem to have enough strength to regain control. To turn it around, you can only wait for the main players to force a pull. If they don’t, a breakdown could happen at any time.
In terms of execution:
For going long: if price pushes through 2474 on increased volume, you can ride the move. Once it holds, then watch the range from 2507 to 2550.
For going short: if price drops below 2442 on increased volume, you can chase the short. If the four-hour chart breaks 2442, then focus on 2388–2340.
Volume is the iron rule—don’t force a move without volume, and make sure your stop-loss is set properly.
On the daily chart, 2401 is the lifeline. As long as it’s defended, things are basically fine. If the close directly breaks below 2401, then it enters a daily-level pullback. Only if it nails and holds above 2401 will there be a chance to test the resistance level above.
(Second biscuit) $ETH My thoughts on what I’m looking at:
It went pretty smoothly and broke through 1885 and 1899, and the highest I touched was around 1935 where there’s resistance nearby. But then it couldn’t hold even after driving in two needles—this suggests there’s still pressure above. So if you’re long, you need to proactively reduce a bit. After that, the pullback to 1899 also didn’t hold. Most likely it still needs to lean toward 1875.
The key level is 1878: as long as it doesn’t break, the long-side structure is still intact. If it really breaks down, the next thing to watch is around 1850—by then, basically all of the earlier gains will have been given back.
If you want to go long, wait for a volume-backed move to stand above 1915, then enter. If price comes back, use that as your stop-loss trigger. If the 1-hour chart can hold above 1915, then above we can look toward 1940, and then 1960.
If you want to go short, wait for a volume-backed breakdown below 1890 to chase the short; tighten the stop-loss. If the 4-hour chart breaks 1890, then first look at 1860, and next down toward 1820.
For left-side dip-buyers: when it pulls back to 1855 and you confirm it’s being supported, you can consider going long. If it breaks and fails, exit if it breaks below 1820.
At a slightly lower level, you can place a buy order around 1800; if it breaks below 1770, stop-loss.
For shorting from the high side: around 1957 is a place to consider. If it breaks above 1980, stop-loss.
Resistance levels above: 1915, 1935, 1960
Support levels below: 1890, 1860, 1820
It went pretty smoothly and broke through 1885 and 1899, and the highest I touched was around 1935 where there’s resistance nearby. But then it couldn’t hold even after driving in two needles—this suggests there’s still pressure above. So if you’re long, you need to proactively reduce a bit. After that, the pullback to 1899 also didn’t hold. Most likely it still needs to lean toward 1875.
The key level is 1878: as long as it doesn’t break, the long-side structure is still intact. If it really breaks down, the next thing to watch is around 1850—by then, basically all of the earlier gains will have been given back.
If you want to go long, wait for a volume-backed move to stand above 1915, then enter. If price comes back, use that as your stop-loss trigger. If the 1-hour chart can hold above 1915, then above we can look toward 1940, and then 1960.
If you want to go short, wait for a volume-backed breakdown below 1890 to chase the short; tighten the stop-loss. If the 4-hour chart breaks 1890, then first look at 1860, and next down toward 1820.
For left-side dip-buyers: when it pulls back to 1855 and you confirm it’s being supported, you can consider going long. If it breaks and fails, exit if it breaks below 1820.
At a slightly lower level, you can place a buy order around 1800; if it breaks below 1770, stop-loss.
For shorting from the high side: around 1957 is a place to consider. If it breaks above 1980, stop-loss.
Resistance levels above: 1915, 1935, 1960
Support levels below: 1890, 1860, 1820
)Two coins)$ETH my thoughts
This thing is still the same old story—it just keeps wavering around in that channel, with no real independent momentum. If you want it to really get going, you have to push through 1875 and break the upper channel line in one go, then only after it holds can you look toward 1900. Right now it keeps being capped by 1875 and can’t break out; below it, 1845 can’t be smashed through either, so just keep grinding in this squeeze. In plain terms, it’s waiting for the bigger “bun” to finish a wave first, then it will slowly follow up to catch up for that bite—there’s no point rushing.
To go long: if volume pushes through 1880, you can chase directly. If it falls back, get out quickly. On the hourly chart, as long as it holds above 1880, first look at 1915, then 1935.
For a short: keep an eye on 1855. If it breaks down with volume, flip and chase the short. Don’t forget to place your stop-loss. If a 4-hour candle can’t reclaim back above 1855, then the move below is straight toward 1820, and possibly 1800.
For a more cautious low buy: wait for a pullback to around 1820 and then enter once it stabilizes. If 1800 breaks, don’t hesitate—just run.
For shorting at higher levels: around 1935 is a decent spot. When it gets there, you can try. If it breaks 1960, you need to撤.
Limit orders on the left side can place a long near 1800 for a low-probability pickup; if it instead plunges straight to 1750, then just accept it.
Overhead resistance levels: 1880、1915、1935 Support levels below: 1855、1825、1800
This thing is still the same old story—it just keeps wavering around in that channel, with no real independent momentum. If you want it to really get going, you have to push through 1875 and break the upper channel line in one go, then only after it holds can you look toward 1900. Right now it keeps being capped by 1875 and can’t break out; below it, 1845 can’t be smashed through either, so just keep grinding in this squeeze. In plain terms, it’s waiting for the bigger “bun” to finish a wave first, then it will slowly follow up to catch up for that bite—there’s no point rushing.
To go long: if volume pushes through 1880, you can chase directly. If it falls back, get out quickly. On the hourly chart, as long as it holds above 1880, first look at 1915, then 1935.
For a short: keep an eye on 1855. If it breaks down with volume, flip and chase the short. Don’t forget to place your stop-loss. If a 4-hour candle can’t reclaim back above 1855, then the move below is straight toward 1820, and possibly 1800.
For a more cautious low buy: wait for a pullback to around 1820 and then enter once it stabilizes. If 1800 breaks, don’t hesitate—just run.
For shorting at higher levels: around 1935 is a decent spot. When it gets there, you can try. If it breaks 1960, you need to撤.
Limit orders on the left side can place a long near 1800 for a low-probability pickup; if it instead plunges straight to 1750, then just accept it.
Overhead resistance levels: 1880、1915、1935 Support levels below: 1855、1825、1800
8+1, right?

(bǐng) $ETH My view:
The most critical level is 1895—that’s the lower edge of the flag pattern. Price needs to climb back above this line to truly stabilize; only then can we talk about a rebound. If it can’t go up, it will keep being pressed down. The next step would be to test 1820.
If moving downward, then if 1820 can hold, price can range around there to build some strength before trying to surge up again. If 1820 can’t hold, then 1800 will be exposed directly. 1800 is the final line in the sand—once it breaks, the whole structure is basically ruined, and the bulls have to concede.
If you want to go long, focus on 1885: break above it with volume and follow the move; if it pulls back, exit. If the hourly chart holds above 1885, then look up to 1915, and from there potentially 1940.
For shorting: if there is an effective breakdown below 1850, follow it. Don’t be stingy with the stop-loss. When the 4-hour chart breaks 1850, aim straight down at 1820, then 1800.
If it retraces to 1820 and can still hold, you can consider going long again. Once 1800 breaks, just leave without hesitation.
For short orders at the high end, you can place them around 1950; if it breaks 1990, cut the loss.
For left-side positioning: set a long at 1770; if it breaks 1740, exit.
Overhead resistance levels: 1885, 1915, 1945
Support levels below: 1855, 1820, 1800
The most critical level is 1895—that’s the lower edge of the flag pattern. Price needs to climb back above this line to truly stabilize; only then can we talk about a rebound. If it can’t go up, it will keep being pressed down. The next step would be to test 1820.
If moving downward, then if 1820 can hold, price can range around there to build some strength before trying to surge up again. If 1820 can’t hold, then 1800 will be exposed directly. 1800 is the final line in the sand—once it breaks, the whole structure is basically ruined, and the bulls have to concede.
If you want to go long, focus on 1885: break above it with volume and follow the move; if it pulls back, exit. If the hourly chart holds above 1885, then look up to 1915, and from there potentially 1940.
For shorting: if there is an effective breakdown below 1850, follow it. Don’t be stingy with the stop-loss. When the 4-hour chart breaks 1850, aim straight down at 1820, then 1800.
If it retraces to 1820 and can still hold, you can consider going long again. Once 1800 breaks, just leave without hesitation.
For short orders at the high end, you can place them around 1950; if it breaks 1990, cut the loss.
For left-side positioning: set a long at 1770; if it breaks 1740, exit.
Overhead resistance levels: 1885, 1915, 1945
Support levels below: 1855, 1820, 1800
(Bing 2) $ETH My view:
Overall, it’s still a bullish structure. The underlying uptrend line is indeed quite firm. However, some fatigue is starting to show—each rebound’s high is being pushed down little by little, indicating there isn’t enough strength for a clear advance. If this pullback can’t break above the previous high, then on the next pullback the probability of breaking the trend line could reach 80%.
To keep moving upward, you’ll need to force your way through and break the previous high. Otherwise, once the trend line breaks, the market will likely need to test 1850 and possibly even lower.
Long signals: When volume increases and price holds above 1930, go after it from the right side. First watch 1960, then push toward 1980. If it falls back below 1930, exit.
Short signals: If there’s heavy volume and price breaks down through 1895, directly pursue the short. Keep the stop-loss tight. On the 4-hour chart, if it breaks 1895, the same approach applies; targets are 1850 → 1815.
Safer low-buy: Pull back to around 1850. If you confirm it’s being held, take a small position. If it breaks 1810, accept the outcome and exit.
Short at the high: Around 1980, you can place a sell order. If it breaks above 2020, stop out and leave.
Left-side “defensive” order: Place a long around 1800 as protection against a downward spike. If it drops below 1760, exit immediately.
Key reminder: It looks strong on the surface, but the structure is actually getting weaker. Until the direction is clear, follow the price from the right side based on levels—don’t guess early and race to get in.
Resistance above: 1927, 1950, 1980
Support below: 1900, 1855, 1810
Overall, it’s still a bullish structure. The underlying uptrend line is indeed quite firm. However, some fatigue is starting to show—each rebound’s high is being pushed down little by little, indicating there isn’t enough strength for a clear advance. If this pullback can’t break above the previous high, then on the next pullback the probability of breaking the trend line could reach 80%.
To keep moving upward, you’ll need to force your way through and break the previous high. Otherwise, once the trend line breaks, the market will likely need to test 1850 and possibly even lower.
Long signals: When volume increases and price holds above 1930, go after it from the right side. First watch 1960, then push toward 1980. If it falls back below 1930, exit.
Short signals: If there’s heavy volume and price breaks down through 1895, directly pursue the short. Keep the stop-loss tight. On the 4-hour chart, if it breaks 1895, the same approach applies; targets are 1850 → 1815.
Safer low-buy: Pull back to around 1850. If you confirm it’s being held, take a small position. If it breaks 1810, accept the outcome and exit.
Short at the high: Around 1980, you can place a sell order. If it breaks above 2020, stop out and leave.
Left-side “defensive” order: Place a long around 1800 as protection against a downward spike. If it drops below 1760, exit immediately.
Key reminder: It looks strong on the surface, but the structure is actually getting weaker. Until the direction is clear, follow the price from the right side based on levels—don’t guess early and race to get in.
Resistance above: 1927, 1950, 1980
Support below: 1900, 1855, 1810
Log in to explore more content