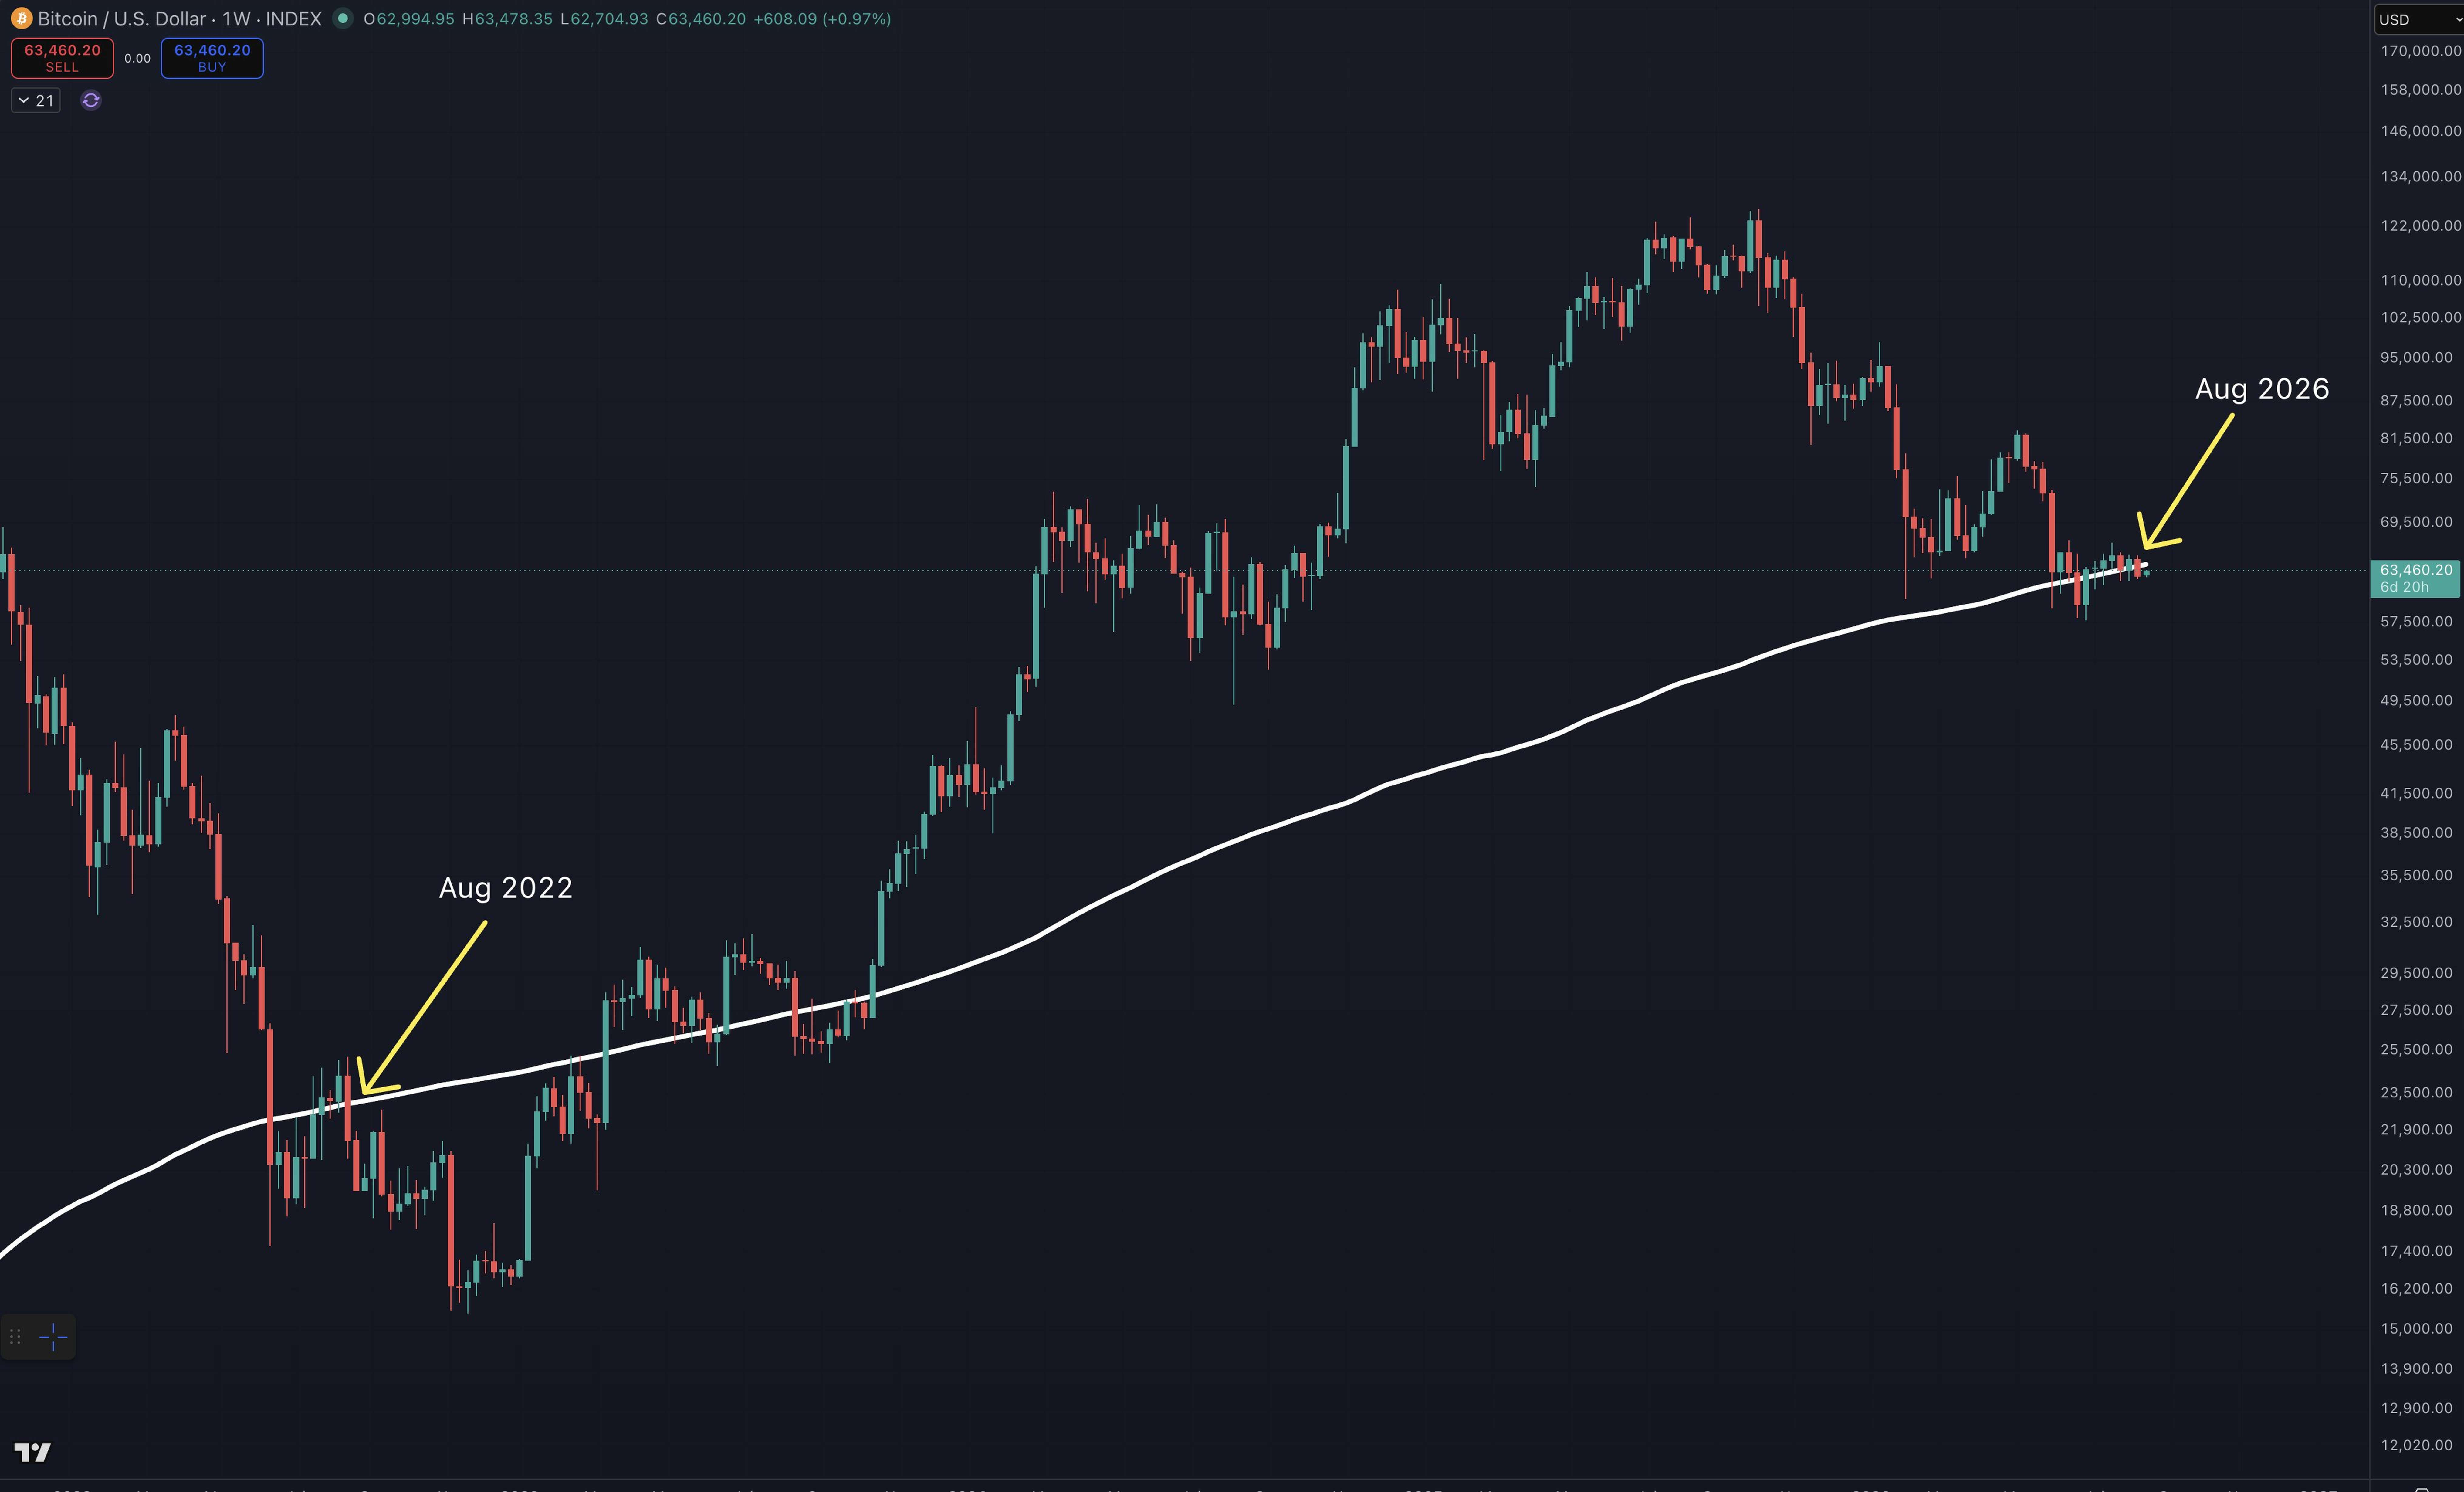
This weekly Bitcoin chart has already closed below the 200-week moving average. The reference is the 200-week simple moving average—based on weekly K-line closes, not the daily chart. The chart doesn’t print the moving-average level; Cointelegraph marked it at $64,216 using TradingView. The new week opened near $63,000, and the recent range has been $57,700 to $67,300. On the evening of August 16, Cowen posted this weekly chart and marked both August 2022 and August 2026 on that same line.
It dipped once near the summer lows, but then it managed to come back and stand above it. This week, it has received the line again below it. After Sunday’s close, Bitstamp briefly touched $63,655 but still hovered right around the line. This is the line around the roughly four-year average—don’t confuse it with shorter moving averages.
$BTC
#比特币 #weekly