ETH (Ethereum) Daily Technical Analysis | 2026.01.28
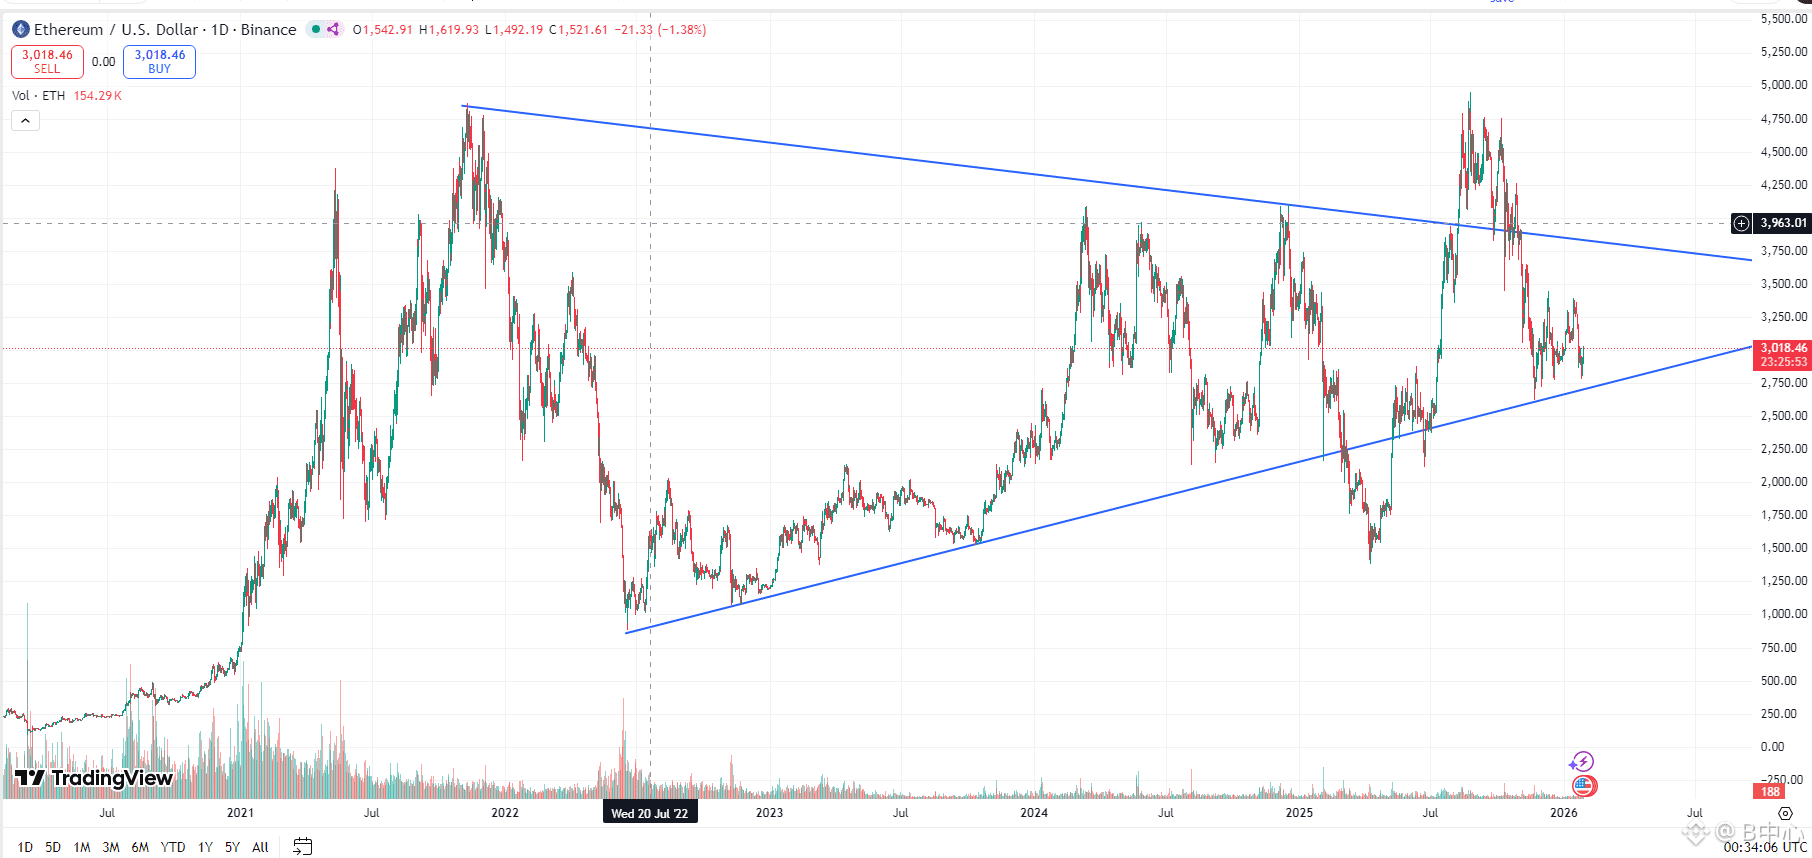
From the daily chart you provided, Ethereum is currently at the terminal area of a large converging triangle. The upper trend line comes from the long-term downward trend line since the 2021 peak, while the lower trend line is formed by the upward trend line created by the low points of the 2022 bear market. The price is repeatedly compressing within the triangle, and both time and space are approaching the critical point for choosing a direction.
In the short term, after failing to rally above $4,000, ETH quickly retreated, indicating that the long-term downward trend line's pressure is still effective. The current price is consolidating around $3,000, which is a typical "pre-direction accumulation" range, rather than an emotional crash. Structurally, the pullback has not violated the higher low points since 2024, and the bullish structure has not been broken.
The key lies in the $2,800–$2,900 area, which is the resonance support of the triangle's lower edge and the previous dense trading area. If it effectively breaks below, ETH may look for mid-term support at $2,400–$2,500; conversely, as long as this area is held and it rises back above $3,300–$3,400, it conditions to challenge the long-term pressure zone of $3,900–$4,100 again.
Key levels:
Support levels: $2,900 / $2,500
Resistance levels: $3,400 / $4,100
In summary: Ethereum is at the end of a long-term triangular convergence, $3,000 is the watershed for bulls and bears, and it will trend either up or down.
From the daily chart you provided, Ethereum is currently at the terminal area of a large converging triangle. The upper trend line comes from the long-term downward trend line since the 2021 peak, while the lower trend line is formed by the upward trend line created by the low points of the 2022 bear market. The price is repeatedly compressing within the triangle, and both time and space are approaching the critical point for choosing a direction.
In the short term, after failing to rally above $4,000, ETH quickly retreated, indicating that the long-term downward trend line's pressure is still effective. The current price is consolidating around $3,000, which is a typical "pre-direction accumulation" range, rather than an emotional crash. Structurally, the pullback has not violated the higher low points since 2024, and the bullish structure has not been broken.
The key lies in the $2,800–$2,900 area, which is the resonance support of the triangle's lower edge and the previous dense trading area. If it effectively breaks below, ETH may look for mid-term support at $2,400–$2,500; conversely, as long as this area is held and it rises back above $3,300–$3,400, it conditions to challenge the long-term pressure zone of $3,900–$4,100 again.
Key levels:
Support levels: $2,900 / $2,500
Resistance levels: $3,400 / $4,100
In summary: Ethereum is at the end of a long-term triangular convergence, $3,000 is the watershed for bulls and bears, and it will trend either up or down.