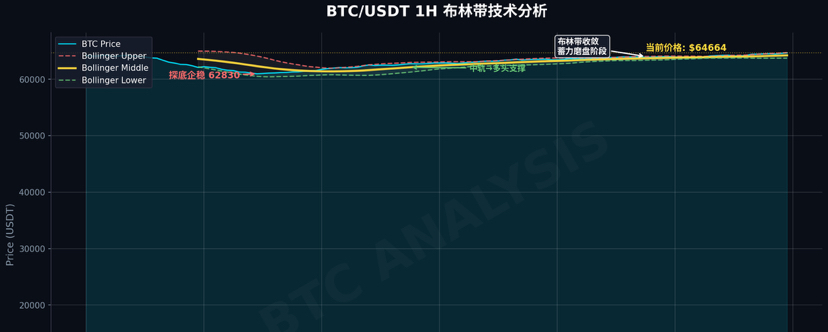
As of August 17, 2026, Bitcoin is trading near the $65,000 level. Its market capitalization remains around $1.3 trillion. The 24-hour trading volume has increased to approximately $14.08 billion, up 15.45% from the previous week, indicating that market activity is gradually picking up. From the one-hour timeframe technical perspective, Bitcoin previously pulled back to $62,830, completed a bottoming process, and then launched a corrective rebound. Price has been steadily trading above the Bollinger Band middle line. The former resistance level has effectively flipped roles, and the middle band has turned into a short-term support for the bulls. Currently, the Bollinger Bands overall are in a contracting formation, suggesting the market is still in an accumulation/consolidation phase and has not yet broken out into a strongly directional rally. Taking into account macro variables such as ETF fund flows, the Federal Reserve’s monetary policy, and the (CLARITY Act), the short-term bullish structure remains intact. Buy-side support below is firm. From a strategy standpoint, the low-long (buy on dips) approach remains unchanged.
I. Market Overview: Stabilization Signals After a Low-Volume Pullback
In mid-August 2026, Bitcoin’s market performance shows a typical pattern of “sharp selloffs followed by slow rises.” Since Bitcoin touched its all-time high of $126,209 in October 2025, it has undergone a deep correction lasting nearly ten months, with the maximum drawdown close to 50%. The current price has retreated to around $64,999. From a weekly timeframe perspective, the price is still trading below the downtrend line extending from the high point. The 20-week moving average is at $69,445, and the 200-week moving average is at $68,468—layered moving-average resistance sits above. This means a complete medium- to long-term trend reversal is not something that can happen overnight.
However, when switching the perspective to the one-hour timeframe, the information on the screen is clearly more positive. After the price quickly dipped to the $62,830 area at the beginning of August, it was immediately met with buy-side support, forming a stabilization candlestick with a long lower wick. This position aligns precisely with the upper edge of the prior dense trading range between $62,500 and $64,000, creating a short-term watershed for bulls and bears. Even more worth noting, during this dip, trading volume did not show panic-like expansion, suggesting that bearish momentum has already exhausted and selling pressure near key support has been effectively absorbed. 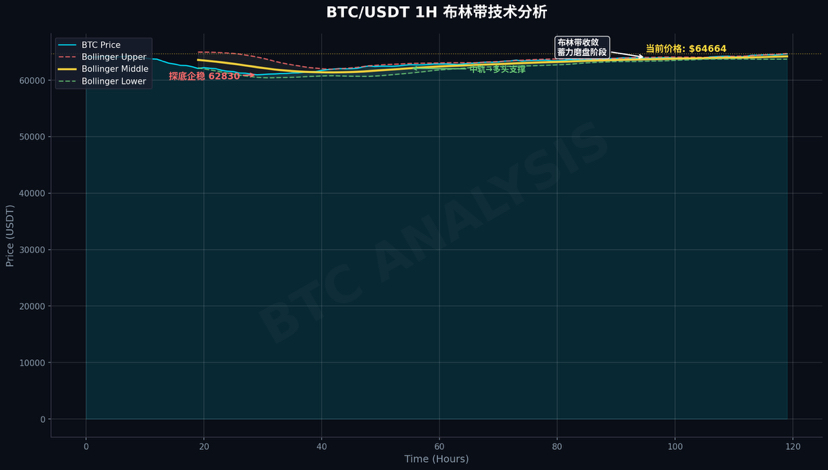
II. Bollinger Band Breakdown: Middle-Rail Support Conversion and Convergence Build-Up
Bollinger Bands, a classic tool for judging market strength, provide very clear guidance on the current one-hour chart. After Bitcoin formed a local bottom at $62,830, the price quickly rebounded and firmly reclaimed the Bollinger Band middle rail. Before this, the middle rail had always played the role of dynamic resistance—whenever price bounced back to it, selling pressure would suppress it and pull it back. This time, the middle rail has completed a critical role shift from “resistance” to “support.” This is the key signal that the short-term trend has turned from weak to strong.
From intraday performance, the small pullbacks that occur repeatedly come to a halt near the middle rail; they have not managed to form an effective breakdown. This clearly shows that the buy-side follow-through below is very solid. Long-side funds have demonstrated a strong defensive willingness at this level—they are unwilling to let the price easily fall back into a weak area. Meanwhile, the upper and lower rails of the Bollinger Bands are gradually narrowing, and the band-width indicator is running at low levels—this is a typical convergence build-up pattern. Based on historical experience, after the Bollinger Bands have fully converged, they are often accompanied by a directional breakout. The current price is already gradually approaching the upper Bollinger Band rail. Although it has not yet formed an effective breakout, the longs are continuously testing overhead resistance. This “grinding” process is essentially digesting trapped positions and accumulating breakout momentum.
III. Key Levels: A Battle Map of Support and Resistance
From a more macro, technical structural perspective, Bitcoin’s trading range has already been repeatedly confirmed by the market. Below $62,500 is the immediate floor—this level has been tested multiple times since August, and each time it has attracted large buy orders to step in. If this position is lost, the next key line of defense will move down to the $60,000 integer level, which is a psychologically recognized support line for the market. A break below it could trigger a deeper pullback, with targets pointing to the $57,500 area at the June lows.
On the upside, the $65,000 to $65,500 range forms the most direct resistance band for now, which is also where recent attempts have repeatedly failed. Higher up, $66,500 is a more critical testing point—Bitcoin previously faced strong sell pressure there. The truly convincing signal of a trend reversal is when price breaks through and holds above the $70,000 level with a breakout accompanied by increased volume, while also reclaiming the 100-day exponential moving average (around $67,600) and the 200-day exponential moving average (around $73,300). On the weekly timeframe, the $68,468 200-week moving average and the $69,445 20-week moving average form a dual pressure barrier. Only by breaking through this area can the market open up space toward higher targets.
IV. Macro Variables: ETF Fund Inflows and Policy Expectations
Beyond the technical side, fund flows and macro policy are shaping the market’s underlying logic. U.S. spot Bitcoin ETFs recorded approximately $464 million in net inflows over the first 10 trading days before August. During the first week of August, net inflows were achieved for five consecutive trading days, with the total exceeding $750 million—its strongest single-week performance since mid-April 2026. Even more notably, Arkham Intelligence’s on-chain tracking data shows that throughout August, none of the Bitcoin ETFs experienced net selling. BlackRock’s IBIT fund has continued to lead the inflows, and Franklin Templeton also returned to the market to buy Bitcoin after more than 30 days of inactivity. This kind of sustained institutional accumulation stands in sharp contrast to the $5.4 billion net outflows accumulated in the first half of 2026, suggesting that “smart money” is repositioning and rebuilding at lower levels.
On the macro policy front, the U.S. Federal Reserve is currently keeping the interest-rate range unchanged at 3.5% to 3.75%. Goldman Sachs and Morgan Stanley both expect that rates will remain at current levels throughout 2026, with a potential start of an easing cycle only in 2027. Although a high-rate environment exerts overall pressure on risk assets, the market has already priced this expectation in fully. The truly worth watching policy variable is the (CLARITY Act) (HR 3633). The bill passed in the U.S. House of Representatives in July 2025 with 294 votes in favor and 134 against, but the Senate vote has been postponed to the autumn. If the bill ultimately becomes law, it will provide a clear regulatory classification framework for digital assets, clarifying the jurisdictional boundaries between the CFTC and the SEC, which would be a substantive positive for the industry’s long-term development. In addition, Mastercard’s $1.8 billion acquisition of stablecoin infrastructure provider BVNK also signals that traditional financial giants are accelerating their embrace of the crypto payments ecosystem, injecting additional confidence into the market.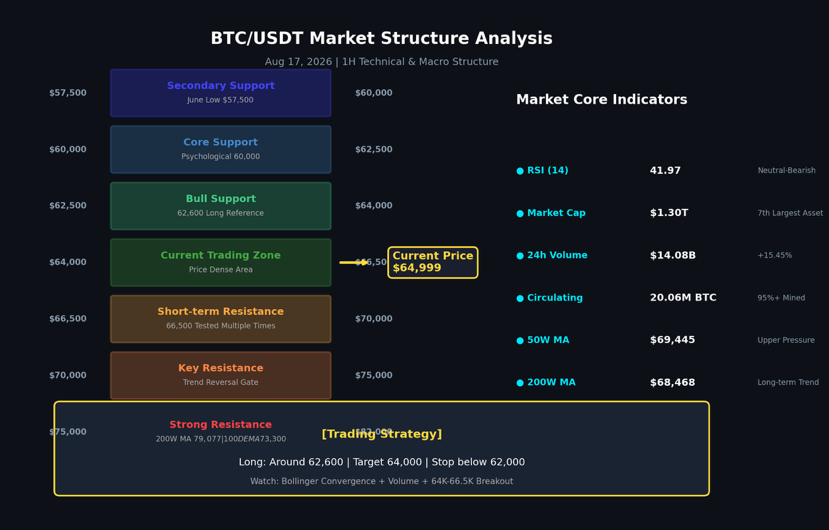
V. Trading Strategy: Hold the Long Side and Wait Patiently
Taking together the technical signals from the one-hour Bollinger Bands and the macro-level funding and policy variables, the market’s core logic has not fundamentally changed. The long-side structure in the $62,500 to $64,000 area has already been sufficiently confirmed, and after the Bollinger Bands converge, the direction choice is highly likely to be upward.
Specific trading suggestions: Set up long positions around $62,600, with targets toward $64,000. Place your defensive level below $62,000. The core rationale for this strategy is that $62,600 sits at a resonance point where the Bollinger Band middle-rail support and a prior dense trading range overlap, making the risk-reward ratio relatively reasonable. If price can break through the $65,500 resistance with a volume expansion breakout, you may consider adding to the position, targeting $66,500 and the $70,000 level. Conversely, if an hourly timeframe closing price falls below $62,000, it would mean the short-term long structure has been damaged; you should exit and stand aside in time for observation.
It needs to be emphasized that the current market is still in a “building up energy” grinding phase; choppy price action during the day is normal. Traders should not let short-term fluctuations disrupt their judgment—stay patient, strictly follow discipline, and wait for the upside momentum released after the Bollinger Bands complete their convergence. In a range-bound market with no clear direction, controlling position size and setting stop-losses is always the first rule of survival.
Risk Warning: The cryptocurrency market is extremely volatile. This article is for sharing technical analysis and market assessment only and does not constitute any investment advice. Readers should make independent decisions based on their own risk tolerance and invest rationally.#中国7月产出零售投资全线不及预期 #CME九月加息概率降至30.6% #以色列空袭黎巴嫩击毙真主党指挥官 #全球股票基金净流入186.2亿美元 #Cardano将Dijkstra升级分两阶段 $BTC