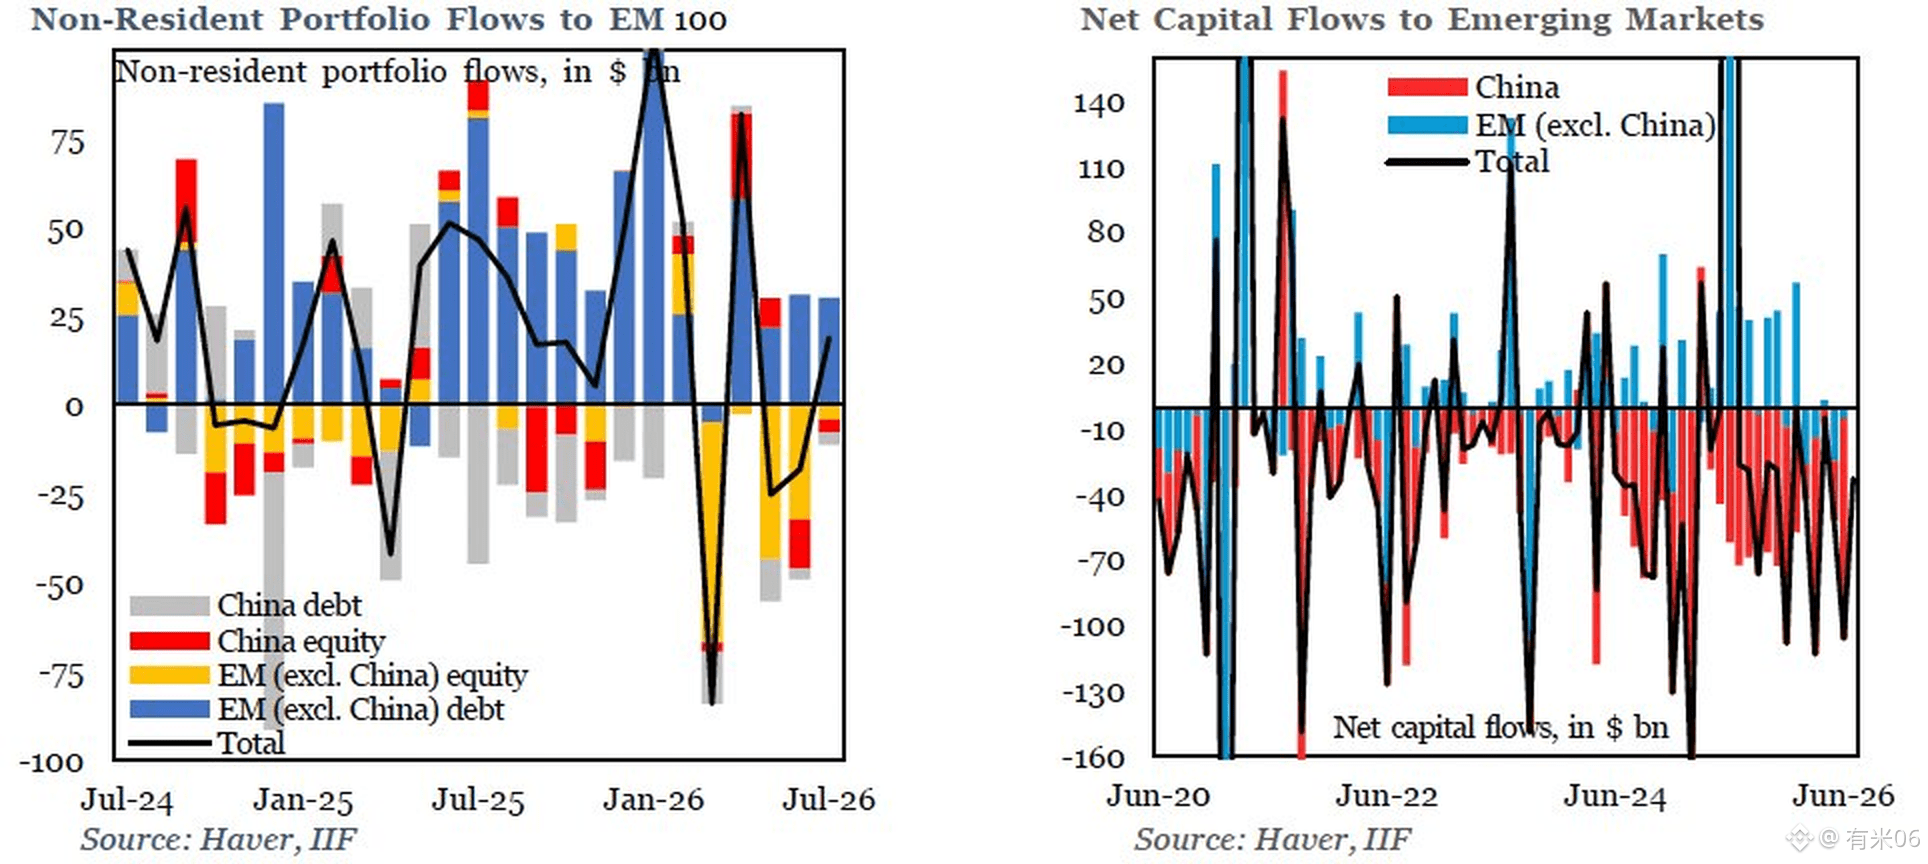
The $7.7 billion [inflow/outflow?] from non-resident portfolio investment in emerging markets in July—on IIF’s August 11 chart, it’s recorded as net inflows of $18.8 billion. In June it was still a net outflow of $18.0 billion, with debt and equity added together. On the left, the chart runs from July 2024 to July 2026, separating China’s bonds, China’s equities, and bonds and equities outside China.
On the right is another set of net capital flows, plotted only through June 2026. The IIF breakdown that Reuters ran the same day shows that in July, bond inflows were $26.7 billion, while equities were still net outflows of $7.8 billion; equities had seen net outflows of $46.1 billion in June. The version published on July 10 records June as net outflows of $17.8 billion—slightly different from the $18.0 billion here—so it’s a revision.
#新兴市场 #资本流动 #IIF
On the right is another set of net capital flows, plotted only through June 2026. The IIF breakdown that Reuters ran the same day shows that in July, bond inflows were $26.7 billion, while equities were still net outflows of $7.8 billion; equities had seen net outflows of $46.1 billion in June. The version published on July 10 records June as net outflows of $17.8 billion—slightly different from the $18.0 billion here—so it’s a revision.
#新兴市场 #资本流动 #IIF