

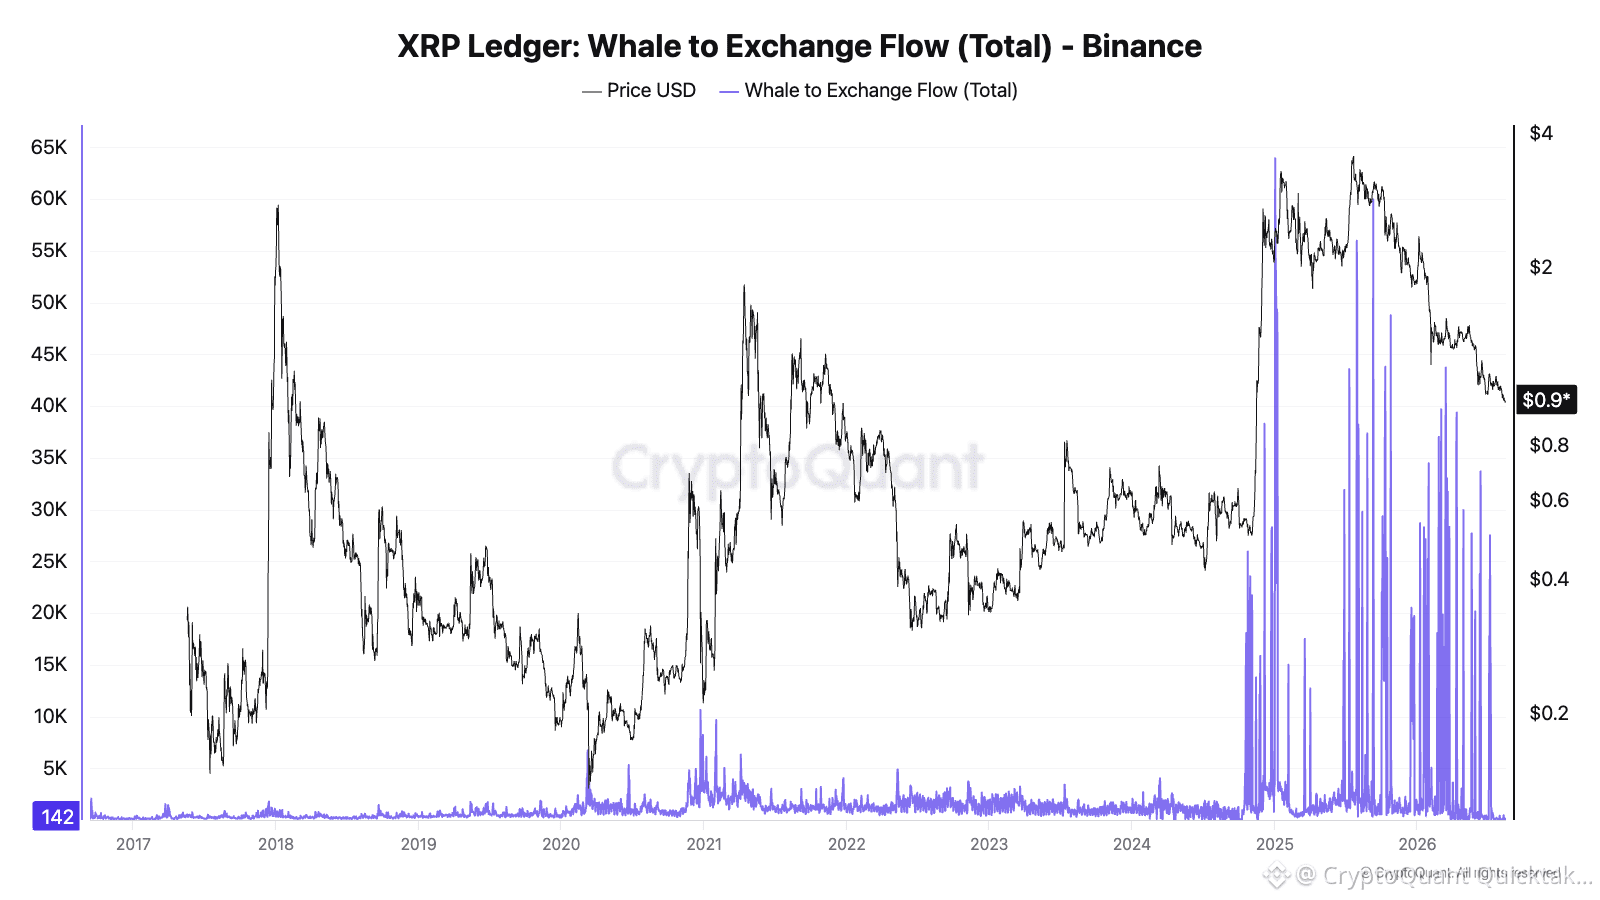
XRP trades near $0.90, down substantially from its Q1 2025 high above $3. Whale-to-exchange flow on Binance shows a structural break that began before the decline and has not resolved.
What the chart shows
From 2017 through late 2024, whale deposits to Binance were consistently muted — a low, stable baseline with only brief episodes of elevated activity around March 2020 and early 2021.
That regime ended in late 2024. Coinciding with the move from roughly $0.50 to above $2.50, deposit spikes reached levels an order of magnitude above anything in the prior seven years. Critically, they did not subside when price peaked. Large prints have continued throughout 2025 and into 2026 as price declined.
Why it matters
Exchange inflow from large holders is a supply signal. Coins moving from private wallets to a trading venue are being positioned for sale — not definitively sold, but made available.
The timing is the informative part. Deposits accelerating into strength is standard distribution behaviour: size is best offloaded when liquidity is deepest. What distinguishes this dataset is that the pattern persisted through the drawdown rather than stopping once the exit window closed.
Two readings
The straightforward interpretation is continued distribution — large holders reducing exposure across a wide price range rather than at a single level.
The alternative deserves weight: XRP's holder base includes entities whose transfers may reflect operational activity rather than directional intent. Exchange-to-exchange routing and custody restructuring can produce similar prints. This metric alone cannot separate the two.
What this is not
Persistent inflow is not a price forecast. It describes available supply, not demand - and price is the intersection of both.
The more useful question is what happens when these prints normalise. A return to the pre-2024 baseline would signal that distribution has run its course. That has not happened yet.
Written by Zakariya Sharif