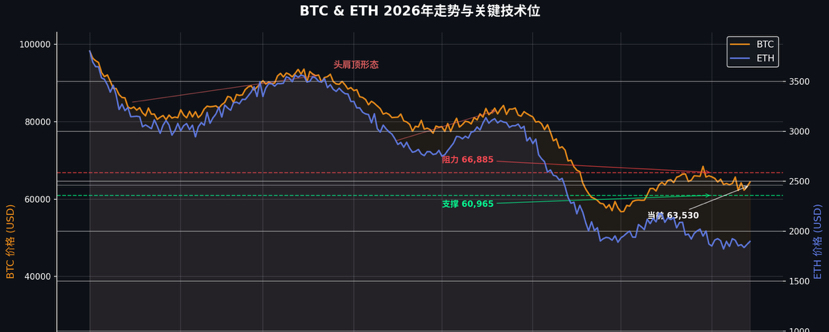
As of August 14, 2026, Bitcoin is trading around $63,530, while Ethereum is hovering around the $1,860 mark. Both are stuck in a low, sideways consolidation range after deep pullbacks within the year. Spot ETF inflows have plunged by more than 80% since mid-July. The pace of accumulation by long-term holders has also slowed noticeably. Coupled with the fact that August is historically Bitcoin’s weakest month, the overall bearish market structure has not changed despite short-term rebounds. This article conducts an in-depth analysis of the current market structure from three angles—technical indicators, fund flows, and the macro environment—and proposes clear trading strategies along with a risk-control framework.
1. Current market situation: “false prosperity” in a weak sideways grind
2026 is an extremely challenging year for the crypto market. After Bitcoin hit an intrayear high of about $97,860 on January 14, it entered a seven-month-long downward channel. It then fell to a low of $57,747 on July 1, for a cumulative decline of 27.55% year to date. As of August 14, Bitcoin is around $63,530. It appears to have rebounded about 14% from late-June lows, but this looks more like a technical repair following a deep correction rather than a trend reversal.
Ethereum’s performance is even weaker. June’s monthly drop was as high as 21.67%. Its rebound elasticity is clearly weaker than Bitcoin’s: by late July it barely held above $1,928, and after entering August it again came under pressure and fell. This divergence—“big pie holds up better, second pie weaker”—actually confirms that the market is still in a stage of shrinking risk appetite: capital flows first to the most liquid assets, while high-beta assets continue to be sold off.
What deserves even more attention is that August, in terms of Bitcoin’s historical seasonality, is arguably the “darkest moment.” Historical data show that the median month-to-month move in August is -7.87%, the worst month of the year, with an average return of only -0.64%. Since 2022, August monthly candles turning bearish has almost become the norm. This means that even without additional negative catalysts, the market itself faces strong seasonal downside pressure.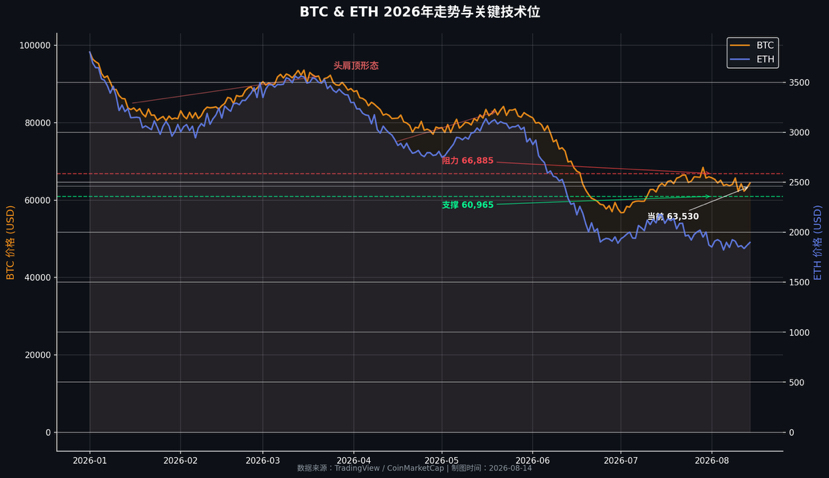
2. Technical outlook: the bearish continuation under a head-and-shoulders pattern
Looking at the three-day timeframe, since early March 2026 Bitcoin has been moving within a classic “head-and-shoulders top” structure. The left shoulder formed from March to April, the head formed in May, and the right shoulder was gradually built from the rebound at the end of June. The typical feature of this pattern is: on both sides of the central high (the head), there are two relatively lower peaks (the shoulders). It is a textbook bearish structure.
The current price is in the tail-end region of the right shoulder. During the rebound process since June 30, a key dangerous signal has been the continuous contraction of trading volume. A rally in the right shoulder accompanied by decreasing volume is a classic sign of trend “exhaustion,” further confirming the effectiveness of the head-and-shoulders top pattern. Based on the pattern’s measured-move decline, once the neckline (around $54,000) is effectively broken, the theoretical downside target would point to roughly $41,266.
In the short term, Bitcoin is trapped in a narrow range between $66,885 and $60,965. $66,885 is a strong resistance level that has been tested multiple times without success recently, and it’s the first hurdle bulls must clear to regain momentum. Meanwhile, $60,965 is the key line that determines market direction: if the three-day closing price falls below it, the lower support will likely be broken, and the price will probably accelerate down toward the $54,000 neckline area. On the upside, only a renewed breakout above $82,931 can truly turn the current bearish structure around—but given the current environment, the probability of achieving that target is as slim as breaking down to the lower end.
Ethereum’s technical outlook is also not optimistic. It has remained under persistent pressure below the $2,000 round-number level. Choppy back-and-forth on smaller timeframes is essentially a continuation pattern forming during a decline. Each intraday bounce is only a small test of overhead resistance; without a quick large-scale rebound, a trend reversal isn’t possible.
3. Capital flows and the macro picture: institutions ebbing, long-term holders watching
If the technicals reveal “what the market is doing,” then the fund flows explain “who is doing it.”
The capital flows of Bitcoin spot ETFs are the best window into institutional sentiment. Data show that the ETF weekly net inflow fell from a peak of $197 million on July 10, down steadily to $33.79 million on July 24; within a week, it plunged 55%, and compared with the July high, it crashed 83%. This implies that although institutional investors have not engaged in panic selling, their marginal buying appetite has cooled dramatically. ETF fund trading desks may be stepping away, and with the market entering the weakest period of the year, this very “institutional silence” itself forms a powerful bearish backdrop.
On-chain data, meanwhile, presents a more complicated picture. The number of “whale” entities holding at least 1,000 Bitcoins showed a slight uptick in late July, rising from 1,263 to 1,267—suggesting that some large holders have begun positioning at lower levels. However, long-term holders have been sending the opposite signal. The “Hodler net position change” metric dropped rapidly from 29,838 Bitcoins on July 11 to 15,766 Bitcoins on July 26—a reduction of 47% within two weeks. Even though long-term holders are still accumulating, the pace has clearly slowed. This suggests that some steadfast holders are growing cautious and preparing for a potential market pullback.
What’s even more concerning is that the divergence index between whales and retail investors is only 4.4 right now, indicating that large and small capital are moving in highly consistent ways within the daily timeframe. This consistency has two sides: when market direction is clear, the trend gets amplified; but once whales turn, retail investors will find it difficult to carry the whole picture on their own.
On the macro level, the global market narrative fundamentally shifted in 2026. According to Wintermute, expectations changed quickly from “when will rate cuts happen?” to “whether rate hikes are needed.” Rising inflation pressure and macro data running a bit hot have cooled crypto momentum. The 30-day correlation between Bitcoin and the S&P 500 remains above 0.6, meaning crypto assets have not escaped the risk budget framework of the U.S. stock market. In addition, the “rainbow siphon” effect of the AI sector for capital further dilutes liquidity in the crypto market.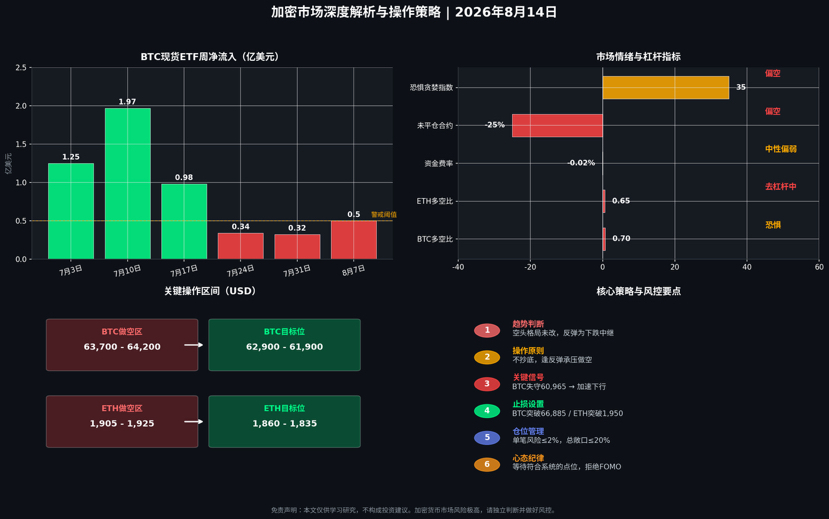
4. Trading strategy: wait for rebounds to short; strictly follow discipline
With the bearish trend clearly established and rebound strength limited, “don’t bottom-fish—only short” is the most rational choice right now. The hardest part of trading is knowing how to wait. Not every fluctuation needs to be traded. Wait patiently for levels that match your thesis, execute with discipline, and manage risk—only then can you go long in the market.
Bitcoin (BTC) trading range:
Set shorts if the price rebounds into the $63,700–$64,200 range. Place the stop loss above $66,885 (the right-shoulder high of the head-and-shoulders pattern). First target: $62,900; second target: $61,900. If the price breaks down with volume below the key support at $60,965, add to the position in line with the move and look further down toward the neck line around $54,000.
Ethereum (ETH) trading range:
Short opportunities can be set if the rebound reaches the $1,905–$1,925 range. Place the stop loss at $1,950. First target: $1,860; second target: $1,835. ETH has weaker relative elasticity versus BTC. Once the broader market accelerates downward, ETH’s decline often ends up being larger.
Risk-control framework:
Single-trade risk exposure should not exceed 2% of principal; total short exposure should be kept within 20% or less. The current market environment is one with a low win rate and high reward-to-risk ratio. It suits trend-following and breakout confirmation strategies—not counter-trend bottom-picking. Use EMA12 to manage failed signals, use a fixed stop loss to limit loss per trade, and use a 3R take-profit to preserve trend gains—this is an effective framework for dealing with the current market structure.
5. Conclusion: Stay clear-headed amid uncertainty
The current crypto market is at a critical crossroads. The technical head-and-shoulders top, the capital-flow pullback by institutions, and the macro expectation of rate hikes combine into triple pressure—making August one of the most dangerous windows of the year. History may not repeat exactly, but the resonance among seasonal patterns, capital behavior, and technical structure often points to a high-probability direction.
For traders, what’s most needed right now is restraint and patience. Repeated choppy swings on smaller timeframes can create the illusion that “it can’t go down anymore.” But rebounds at the daily level end without a break-and-hold signal, and smaller timeframes continue to struggle and weaken under pressure. All of this tells us: after consolidation is complete, downside is likely to resume.
The market never lacks opportunities—what’s missing is capital to survive until opportunities arrive. Until the bearish structure changes, every rebound is a process of testing overhead resistance, and also a window for bears to reposition. Recognize the trend, respect the signals, and manage risk—only then can you go the distance through market volatility.
Risk warning: The crypto market experiences extreme volatility. This article is written based on publicly available data and technical analysis and is for learning and research purposes only; it does not constitute investment advice. Please make independent judgments according to your own risk tolerance and do not trade beyond what you can bear.#美国7月CPI与PPI数据本周出炉 #美国7月PPI持平 #SpaceX空头持仓降至11% #Shein据报最早8月20日启动港股IPO认购 #SpaceX盘中涨近12% $BTC