

1. Macro data delivers a mild signal; rate-hike expectations cool down, supporting the broad market
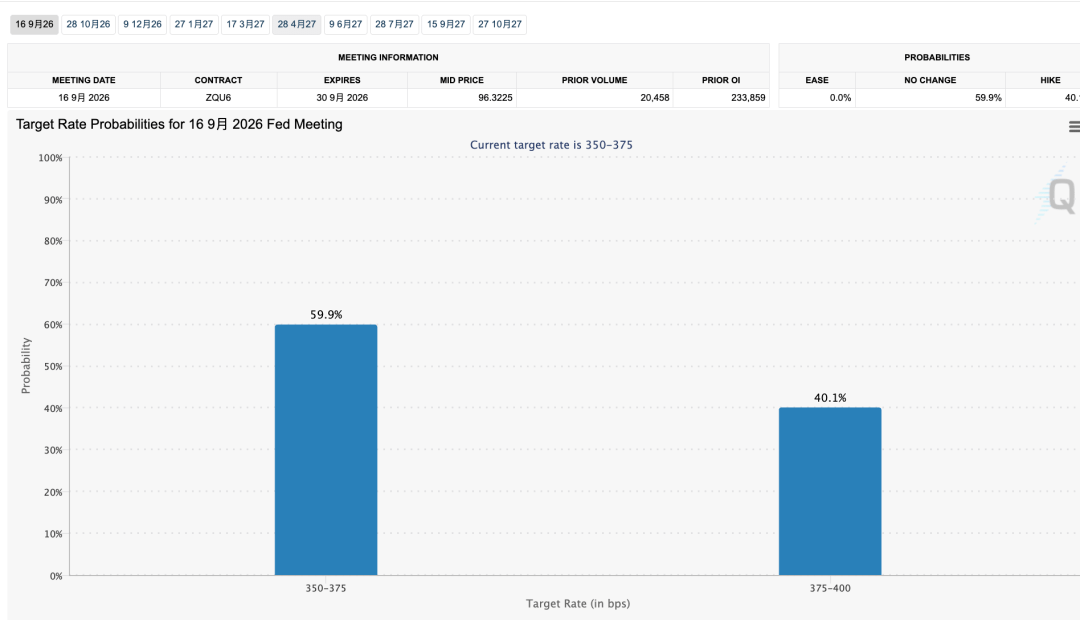
As of 12:00 noon in the East Eight (UTC+8) time zone on August 13, the latest released U.S. CPI data met market expectations, with an overall mild performance that provided a certain degree of positive support for financial markets. The implementation of this data has slightly reduced market bets that the Federal Reserve will hike rates more than once in the coming months. In particular, ahead of the data release, market expectations for a Fed rate hike in September had risen to around 50%, but with the release of the mildly toned CPI data, that hike expectation has fallen to 40%. This indicates that, for now, the view that “there will be a pause in September rate hikes” has taken a clear dominant position in the market.
Taking a comprehensive view of a series of recent macroeconomic indicators: the inflation readings in the U.S. for June and July were relatively mild. Meanwhile, the employment index at the end of June showed a clearly weakening trend. This combination of data does not provide solid grounds for hawkish officials inside the Fed to justify another strong rate hike. Against the backdrop of somewhat easing overall macro liquidity tightening pressure, global risk assets should have room to catch their breath and rebound.
2. Bitcoin divergence weakening: analysis of the key trend line and the $62,000 line of defense
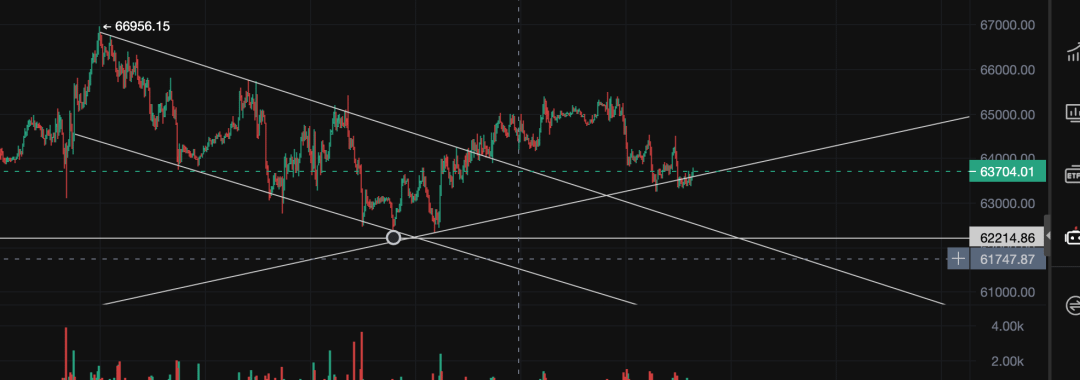
What’s noteworthy is that despite the backdrop of macro positives being released, the crypto market has shown a severe divergence from the broader market. After repeatedly failing to break above the parallel high, Bitcoin has logged four consecutive days of pullback and declines. From the perspective of short-term, small timeframes, the price is still repeatedly hovering and consolidating near the rising trend line drawn earlier.
From a technical pattern perspective, Bitcoin is currently pulling back to the support area of the earlier low on the left side and consolidating at the bottom. If, in the future, it stabilizes here and then forms a rebound and launches an upside push again, and if it manages to break through the parallel high resistance overhead in one go, it would be expected to completely reverse the current pressure situation. However, if during the rebound Bitcoin meets resistance again at the highs, or even breaks below the current rising trend line entirely, then in the next phase it is highly likely to continue searching for support lower down and test the $62,000 area. Therefore, at this stage, you must not rashly conclude that Bitcoin has already exited the bottom. You also must not blindly bet that it will immediately follow U.S. stocks and gold into a “relief rally.” Extreme caution is necessary regarding downside risk.
3. Capital diversion and “altcoin-like attributes”: why does Bitcoin fall but not rally?
Many investors are puzzled by the phenomenon of “U.S. stocks and gold rising while Bitcoin falls harder.” A deeper analysis of the underlying capital flows and market logic points to mainly three dimensions:
First, the gold market has clearly formed a bottom and confirmed a trend reversal. As a traditional safe-haven asset, gold has extremely high certainty. At present, the only question is when it will pull back to add positions. This will inevitably significantly divert safe-haven capital from the crypto market.
Second, the U.S. stock market—driven by consecutive strong multi-quarter earnings reports in the AI sector—has strong momentum on the technical side to continue setting new all-time highs. Whether it’s the market’s own strong profitability effect or the abundance of market capital, it is siphoning liquidity from the crypto market.
Third, with both U.S. stocks and gold strengthening, Bitcoin looks more like an “altcoin” in the traditional crypto market—possibly even turning into a “stock that behaves like an alt” for U.S. stocks and gold. This leads to Bitcoin showing a distinct “drops but doesn’t rally” characteristic.
If Bitcoin wants to see a truly sustained “relief rally” (catch-up), the prerequisite must be that U.S. stocks and gold break through their respective key resistance levels first and then enter consolidation at high levels. Taking U.S. stocks as an example: there is strong horizontal pressure near the 30,000 level. Only if it breaks successfully and then trades sideways in that range will the diversion of take-profit funds provide Bitcoin with a window to catch up. Gold works the same way: after breaking the left-side parallel high point, if it then pushes toward the next resistance near $4,500 and holds firm at high levels, some profit-taking funds may rotate into Bitcoin. This capital-rotation logic is identical to the earlier mechanism in which funds rotated from Bitcoin into altcoins.
4. Strategy for dealing with U.S. stocks and gold at high levels: take profit in batches on rallies, and add on pullbacks
Because Bitcoin declined ahead of the broader market, it reflects a serious lack of buy-side demand in the crypto market and a shortage of subsequent upward momentum. This weakness in a leading market indicator suggests that when trading U.S. stocks and gold, we should also heighten risk awareness.
For the U.S. stock market: if the走势 of the individual stocks you hold is similar to that of the Nasdaq index, and both have moved into a key resistance zone, it’s recommended to adopt a partial take-profit strategy. For example, Micron (Micron). The stock price has already touched a strong resistance level ahead; at this point, locking in some profits on a rally is a more prudent choice.
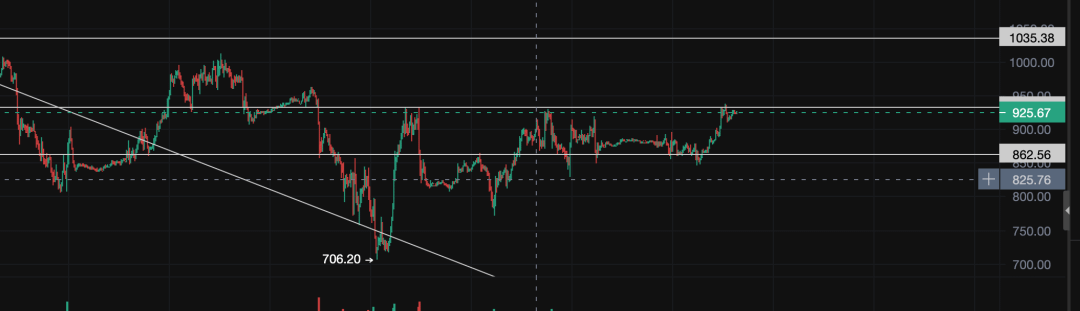
For the gold market, the daily RSI indicator has already moved into an overbought state, so it naturally needs a pullback in the short term. Although CPI positives support it to consolidate at high levels without a deep sell-off, given the space remaining for further upside, you can take profit in batches in the $4,400 to $4,500 range. Long-term holders can of course continue to hold. But for adding positions, a more ideal strategy is to patiently wait for gold to pull back into the high-quality support zone below, and then rebuild positions.
In addition, some high-quality targets with price action independent of the broader market show excellent setup opportunities. For example, Google: the stock price has fallen back into the expected buy zone. It not only fills the technical gap below, but also sits at a critical “support-resistance swap” area with strong supportive power. As long as it cannot break further downward, this is a good staged entry point for building positions at low levels; for rebound targets, you can first look near 380 points.
5. Opportunities in quality targets and altcoins: SPACX’s strong stance and the bullish setup in HYPE
When selecting crypto altcoins and specific targets, we should abandon high-risk “pump-and-dump” pure speculation. Instead, focus on assets with solid fundamentals and clearly defined technical patterns.
First, as the focus of the recent market, SPACX is showing exceptional strength. It has firmly moved above the $135 opening price, demonstrating strong long-dominated control and sustained upward momentum. Our position cost basis is around 110.
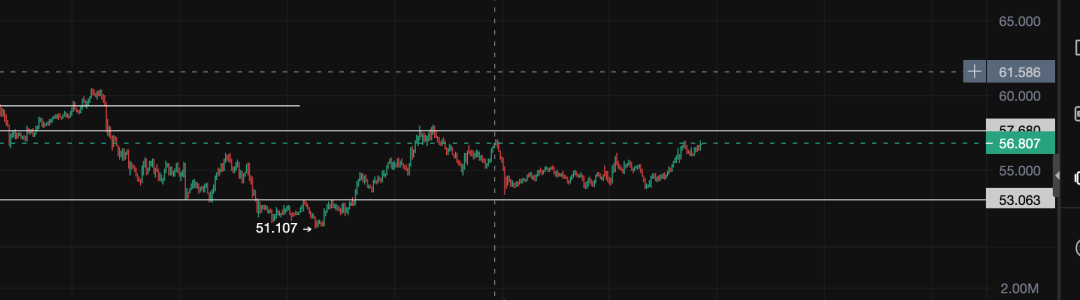
Second, the altcoin target HYPE shows signs of a successful phase of bottoming at the daily timeframe. If HYPE can hold above the moving averages for the next two consecutive days, causing the moving averages to form a bullish alignment again, and then break through the left-side swing high at $57 in line, it will fully restart a steady bullish upward structure. Compared with low-quality altcoins that surge and crash violently and are unpredictable, HYPE has stronger fundamentals. And compared with Bitcoin and Ethereum, whose bottom is still unclear and whose timeline for receiving a return of U.S. stock and gold capital remains unknown, HYPE’s technical breakout signals are more direct and clear.
Overall, the current trading strategy should still focus on the two main markets: U.S. stocks and gold. While staying aligned with the macro trend, keep your position sizing flexible and strictly follow trading discipline—take profit in batches at high levels and build positions in stages at low levels.
❀❀END❀❀