


PayPal PYPL stock is doing something that often frustrates trend followers. It is holding its gains without extending them. The daily close at $59.00 sits far above the 50-day EMA at $51.87 and the 200-day EMA at $52.75. That structure is not in question. What is in question is whether buyers still have the energy to break the ceiling that has formed just overhead.
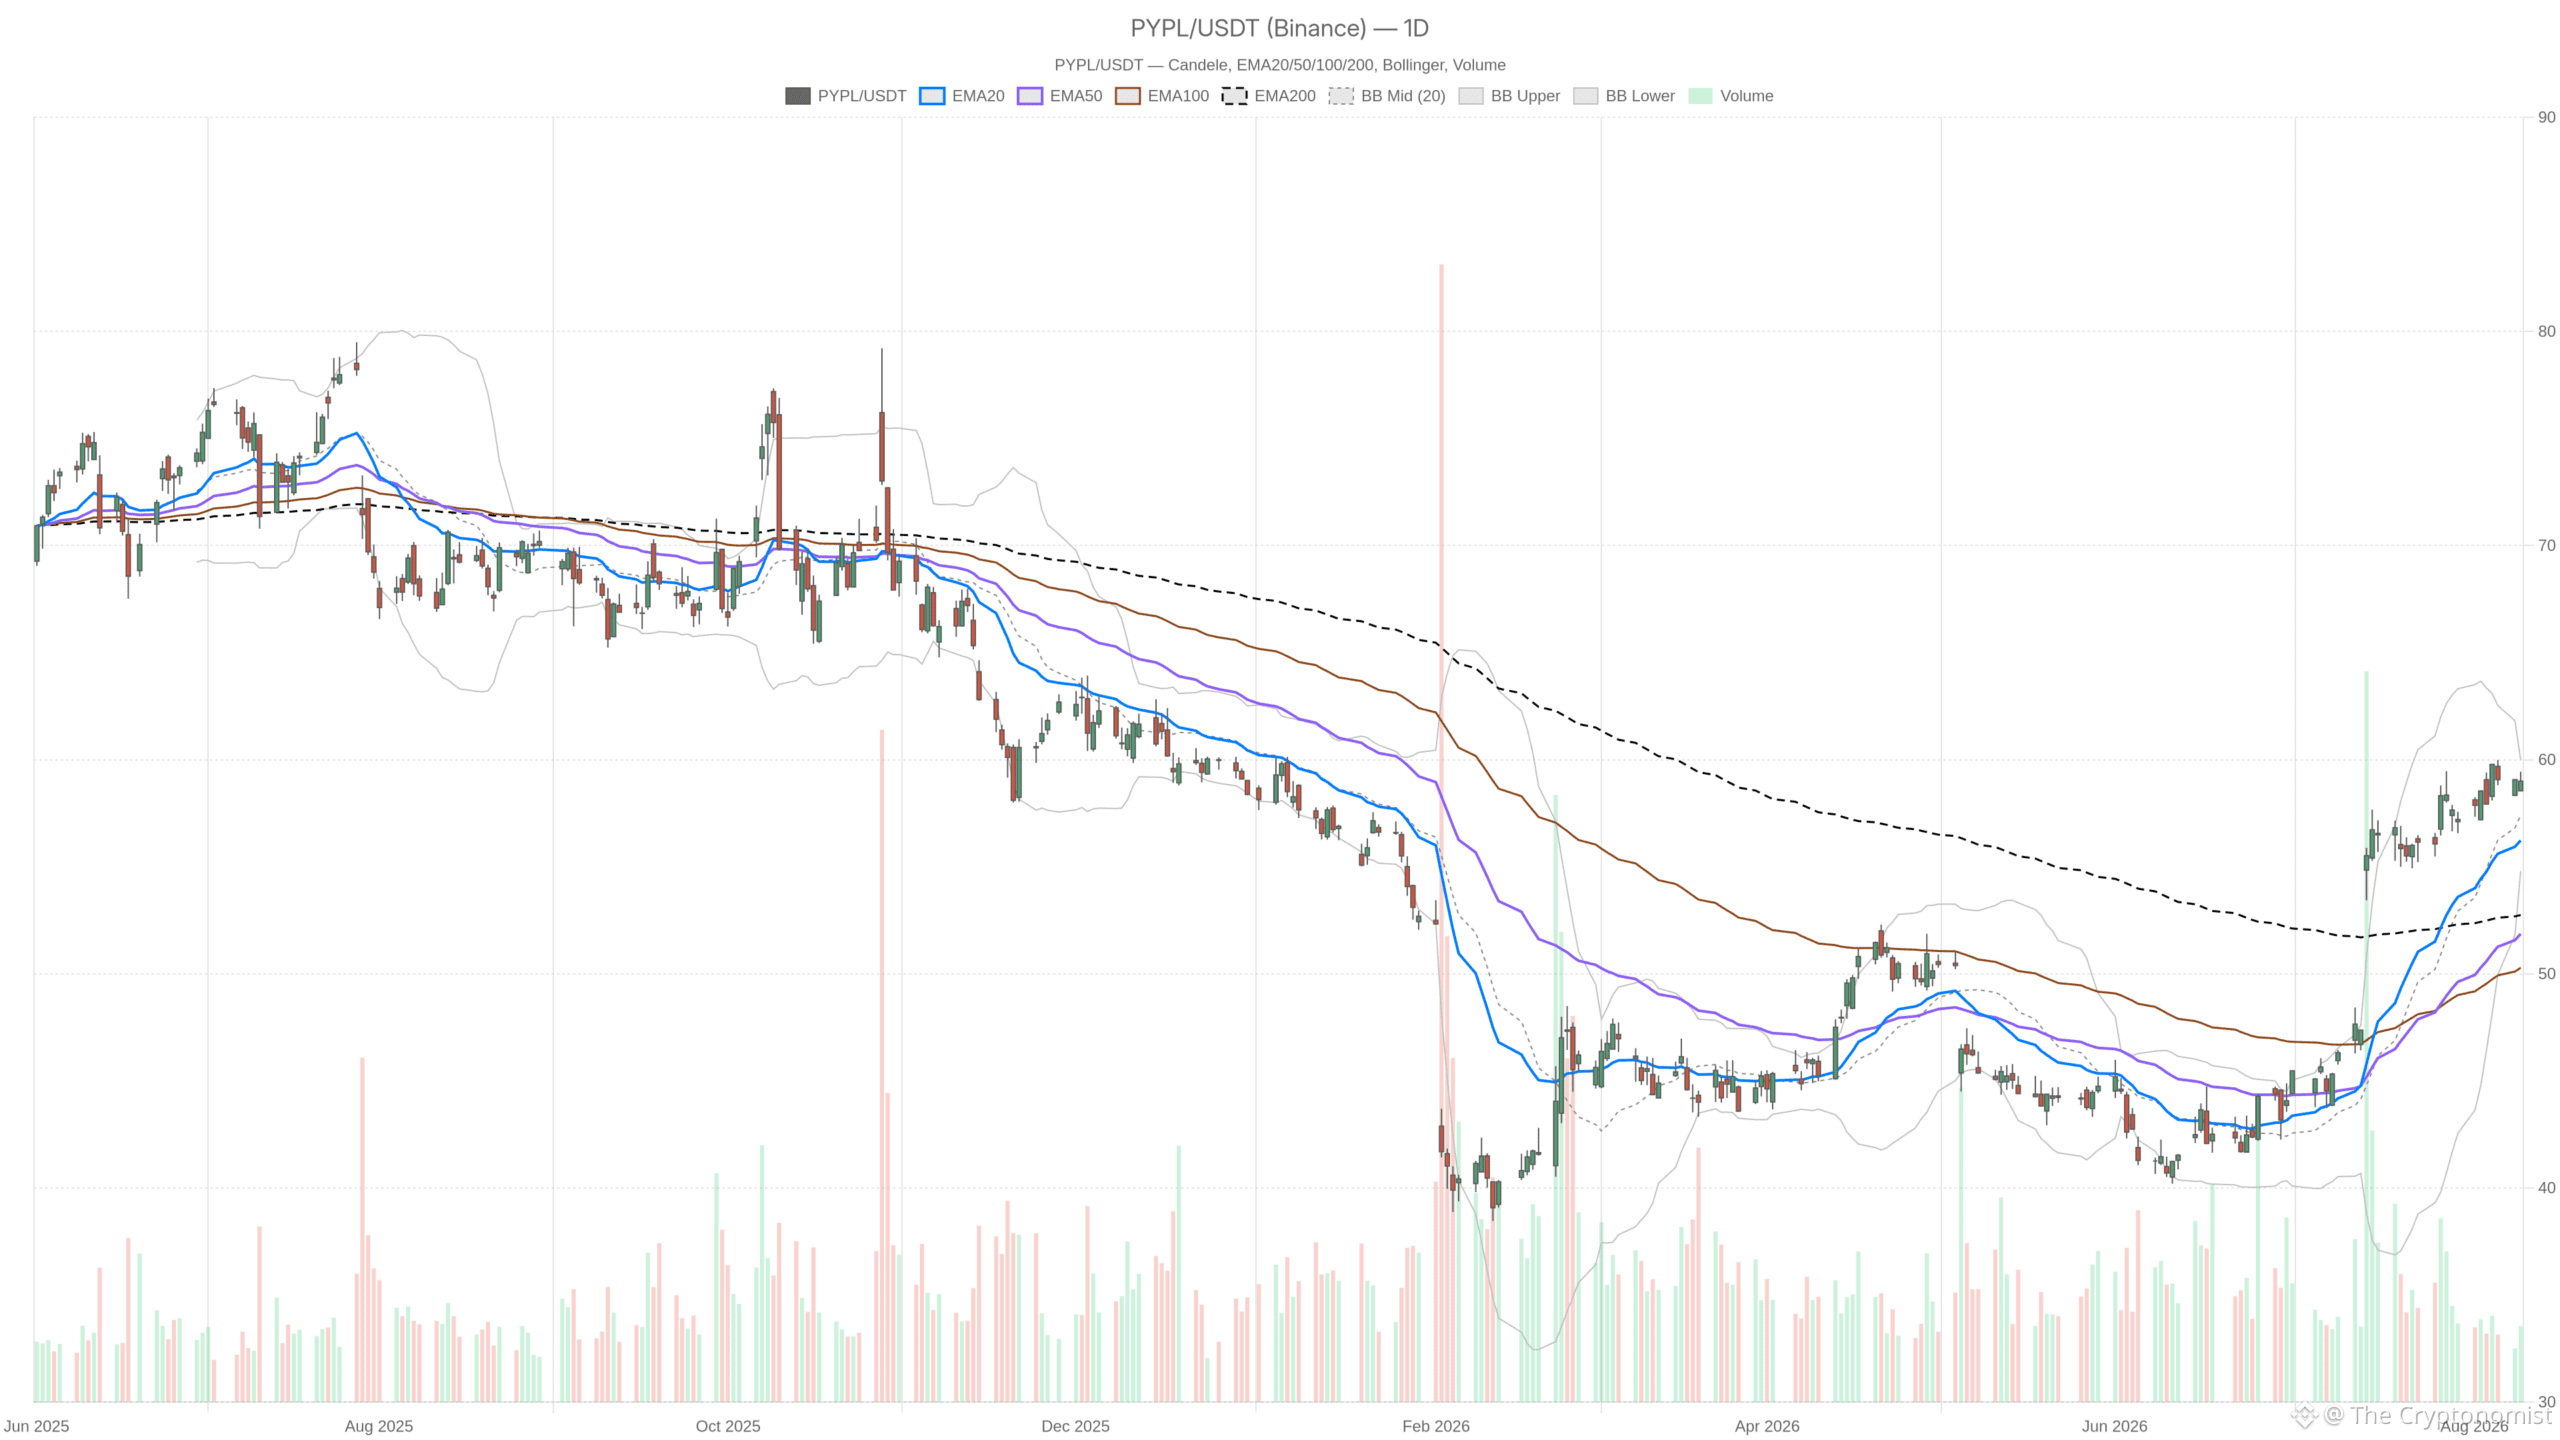 PYPL — daily chart with candlesticks, EMA20/EMA50 and volume.
Key takeaways
PayPal PYPL stock closed at $59.00, well above both the 50-day EMA at $51.87 and the 200-day EMA at $52.75, keeping the daily trend structurally bullish.
Daily RSI at 70.58 signals overbought conditions, while the MACD histogram has turned negative at -0.22, pointing to fading momentum.
Resistance sits at $59.44 and the $60.00 upper Bollinger Band, with support at $58.55 and the daily mid-band at $57.40.
The stock surged 32.5% in July but remains pinned below the rejected $60.50 bid, which acts as both a ceiling and a magnet.
ATR compression across the hourly and 15-minute charts signals a pending breakout or breakdown from the current consolidation.
Why the daily picture on PayPal PYPL stock reads bullish but tired
The daily chart on PayPal PYPL stock shows a structurally bullish trend that is losing momentum at the edges. Price remains above all major moving averages, but the impulse behind the advance is decelerating.
The moving average stack is the strongest argument for the bulls. EMA20 at $56.23 sits above both the EMA50 and the EMA200, and price sits above all three. Trends in that configuration rarely reverse without warning. They usually roll over slowly, and that process starts with momentum, not with price.
Momentum is exactly where the cracks show. Daily RSI at 70.58 has pushed into overbought territory, which reflects the strength of the advance rather than an automatic sell signal. However, the MACD is more revealing. The line at 2.86 has slipped below the signal at 3.07, leaving a MACD histogram of -0.22. The impulse is decelerating even as price holds near its highs.
Volatility tells a similar story. Daily ATR at $1.36 gives roughly a 2.3% average daily range against a $59 share price. That is not a quiet tape. Yet the last daily candle spanned just $58.55 to $59.44, well inside that average. Contraction after a strong run is typically a pause, not a resolution.
Notably, the Bollinger structure frames the whole debate. The mid-band at $57.40 is the line that matters for trend followers on pullbacks. The $60.00 upper band caps the current attempt. The daily regime is classified as neutral for good reason. Direction is bullish, but conviction is not.
The hourly chart confirms the trend, without confirming a breakout
The hourly chart on PYPL supports the bullish structure but offers no breakout signal of its own. The alignment is constructive, yet momentum readings sit squarely in neutral territory.
On the 1H timeframe the regime reads bullish, and the alignment supports it. EMA20 at $58.87 sits above EMA50 at $58.49, with EMA200 far below at $54.31. Price at $59.00 remains on the right side of all of them. Therefore the intraday structure still belongs to buyers.
At the same time, hourly momentum is neutral rather than expansive. RSI at 54.78 is mid-range. The MACD line at 0.10 sits marginally under its 0.12 signal, with a histogram of -0.02. That is balance, not pressure. Hourly bands are compressed between $58.38 and $59.40, with the mid at $58.89. ATR has fallen to $0.34.
This is where the timeframes complicate each other. The daily chart argues that a powerful move has already happened and is now cooling. The hourly chart argues that the trend is intact but currently range-bound. Neither view is wrong, and both point to the same practical conclusion: the next directional leg needs a catalyst, not just drift.
15m: execution context in a very narrow band
The 15-minute chart on PYPL provides execution-level precision inside a compressed range, with no directional bias to trade against. Short-term traders are navigating a band barely half a dollar wide.
The EMA structure is almost mechanically flat. EMA20 at $58.96, EMA50 at $58.92 and EMA200 at $58.49 are stacked within half a dollar. RSI sits at 52.50 and the MACD histogram is effectively zero. ATR of $0.12 confirms how thin the short-term range has become.
For timing purposes, the intraday pivots are the reference points: $59.03 as the pivot, $59.11 above and $58.92 below. Sustained trade above the $59.11–$59.14 zone would show that buyers are absorbing supply. Losing $58.92 would signal short-term rotation back toward the hourly band floor near $58.38.
The bullish scenario
The bullish case hinges on a daily close above $59.44, which would open the path toward the $60.50 deal ceiling. Structure favors continuation, but the trigger has not yet fired.
The bull case is straightforward and rests on structure. A daily close above the $59.44 pivot resistance would be the first step. Acceptance above the $60.00 upper band would then confirm the consolidation was continuation. Given daily ATR of $1.36, such a break has room to travel quickly once it triggers.
Meanwhile, the fundamental backdrop adds context. PayPal was one of the standout S&P 500 performers in July, gaining 32.5%. Jim Cramer pointed to operational improvements under CEO Enrique Lores alongside M&A speculation. Critically, the stock still trades below the $60.50 bid the board turned down. That rejected bid explains why the $60 area behaves like a ceiling and a magnet at the same time.
For the bullish path to gain credibility, the daily MACD histogram would need to turn positive again. The hourly MACD would also need to reclaim its signal line. Holding above the daily mid-band at $57.40 on any dip would keep the sequence of higher lows intact.
The bearish scenario
The bearish case activates if PayPal PYPL stock fails at resistance and breaks below $58.55 support. Overbought readings then shift from strength signals to exhaustion warnings.
The bearish case begins with failure at the highs. If PayPal PYPL stock cannot clear $59.44 and instead loses the $58.55 daily support, the picture shifts. The overbought RSI reading would turn from a strength signal into an exhaustion warning. A move back to the $57.40 mid-band would be the first logical target. The $54.80 lower band serves as the deeper reference.
In contrast to the July surge, longer-horizon commentary has been notably lukewarm. One article framed PayPal as having returned substantial cash to owners while the stock still lagged the market. Another investor letter described returns as adequate without dramatic change. Wall Street is taking a “prove it” approach to the current valuation, according to coverage of the rejected bid spread.
That skepticism matters technically. If deal speculation cools, the $60.50 reference loses its gravitational pull. The stock is then left leaning on momentum that is already fading. A decisive break of $58.38 on the hourly chart would be the first warning. The EMA50 at $58.49 flipping into resistance would then clearly invalidate the bullish case.
Positioning and the uncertainty that remains
The balance of evidence favors the trend, but the stall near a well-defined ceiling keeps positioning uncertain. Mixed signals of this type usually resolve violently rather than gradually.
Overall, the daily bias is constructive, the hourly regime is bullish, and the 15-minute chart is neutral and compressed. Mixed signals of this type are common near a well-defined ceiling. They usually resolve violently rather than gradually.
Still, the practical uncertainty is event risk. Much of the recent move is tied to M&A speculation and a rejected bid. This means headlines can override chart structure at any moment. Compressed ATR readings across the hourly and 15-minute charts amplify that risk. Low volatility rarely persists after a 32.5% monthly advance. Until $59.44 breaks or $58.55 gives way, PayPal PYPL stock is best understood as a waiting market. It is not one delivering information.
FAQ
What is the main trend for PayPal PYPL stock right now?
The daily trend is structurally bullish with price at $59.00 sitting above all major EMAs. However, momentum is cooling. The MACD histogram has turned negative at -0.22 while RSI sits in overbought territory at 70.58. The stock is consolidating rather than extending its advance.
Why is $60.50 such an important level for PYPL?
The board rejected a $60.50 bid, making that level both a ceiling and a magnet for price action. This rejected offer explains why the $60 area acts as strong resistance. It also keeps the stock range-bound beneath a well-defined fundamental reference point.
What are the key support and resistance levels to watch?
Resistance sits at $59.44 and the $60.00 upper Bollinger Band. Support rests at $58.55 and the daily mid-band at $57.40. A daily close above $59.44 would favor continuation toward $60.50. A break below $58.55 would shift focus toward $57.40 and potentially the $54.80 lower band.
Is the July rally in PayPal PYPL stock sustainable?
The 32.5% July surge was driven by operational improvements and M&A speculation. However, with daily RSI overbought and the MACD histogram negative, the rally’s momentum is fading. Sustainability depends on whether buyers can absorb supply above $59.44 and push through the $60.00 upper band.
Disclaimer: This article is for informational purposes only and does not constitute financial advice, an investment recommendation, or a solicitation to buy or sell any financial instrument or cryptocurrency. The analysis provided is not indicative of future results. Investing in crypto assets and financial markets carries a high risk of capital loss. Always do your own research (DYOR) and consult a qualified financial advisor before making any decision.
Article produced with the assistance of artificial intelligence and reviewed by the editorial team.