In August 2026, after a $63,211 wick, Bitcoin rebounded and is now at the center of an intense long-versus-short battle around $65,000. The Fear & Greed Index has fallen to 29 (fear zone), while ETF capital continues to flow in; institutional and retail sentiment are severely diverging. This article combines the latest market data to conduct an in-depth analysis of the technical structures, capital flows, and macro catalysts behind the three major assets—BTC, ETH, and SHIB—and provides trading strategies and a risk-management framework with practical value.
1. Market Overview: At the Crossroads of Fear and Greed
On August 12, 2026, the cryptocurrency market is at an extremely delicate turning point.
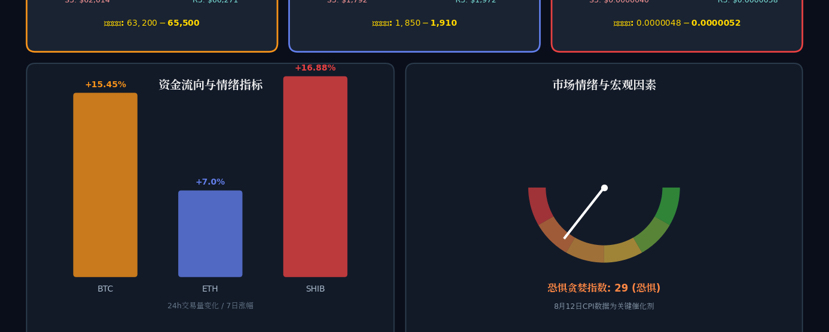
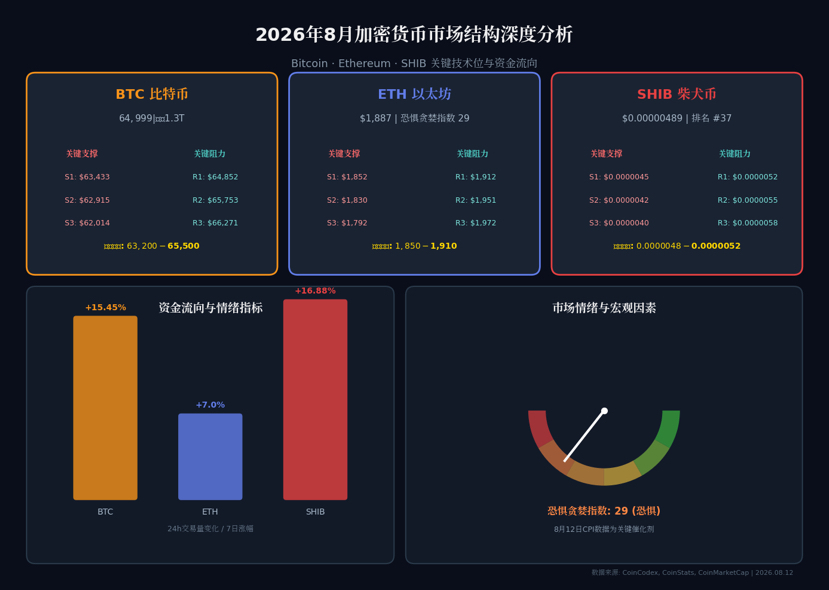
Bitcoin is currently quoted at around $64,999, with market cap holding around the $1.3 trillion level. 24-hour trading volume is about $14.08 billion, up 15.45% from the prior period. On the surface, these are fairly ordinary numbers, but once you peel away the surface, the market’s internal structure is far more complex than the figures suggest. The Fear & Greed Index is at 29, firmly in the “fear” zone. What does that imply? History repeatedly shows that when market participants are generally fearful, it often creates the best contrarian entry window.
From above the $93,000 level at the start of the year down to around the current $65,000, Bitcoin’s maximum intra-year drawdown is close to 30%. For traditional assets, a 30% drop is enough to trigger panic selling; but for Bitcoin, this is simply a completely normal correction within a bull-cycle. As the old market saying goes: “The market always bottoms in fear and rises in hesitation.”
The core contradiction in the current market is: retail sentiment is extremely bearish, while institutional funds are quietly flowing in. Spot Bitcoin ETFs have recorded continuous net inflows over the past few weeks, and the size of institutional crypto portfolios such as BlackRock’s continues to expand. This divergence between “smart money” and “panic money” is exactly a typical bottom-zone characteristic.
II. Bitcoin: Long-Short Battles after the $63,211 Wick Pin
2.1 Technical Structure Analysis
After a nighttime Bitcoin wick pin to $63,211, the price rebounded rapidly. This price action carries profound technical meaning. According to CoinCodex’s technical indicators, Bitcoin’s current key support levels are $63,433 (S1), $62,915 (S2), and $62,014 (S3) in order. Resistance is concentrated at $64,852 (R1), $65,753 (R2), and $66,271 (R3).
It’s worth noting that the wick low of $63,211 falls exactly between the S1 and S2 support zones, indicating that buy-side demand in the $62,900–$63,400 area has formed effective follow-through. Although price briefly broke below $63,433, it did not stabilize below that level—this confirms the technical feature of a “false breakdown,” where the bears tried to pierce support but bulls quickly regained control.
From the moving average system, Bitcoin’s 50-day SMA is at $63,375, and the 200-day SMA is at $70,172. Price is currently trading above the 50-day SMA but far below the 200-day SMA, forming a typical “range consolidation in the mid-term, pressure in the long term” pattern. The RSI reading is 54.17, in the neutral zone—not overbought and not oversold—leaving ample room for the choice of direction ahead.
2.2 Macro Catalyst: CPI Data as a Key Variable
August 12’s upcoming U.S. CPI release is viewed by market participants as the “gatekeeper for the next direction.” Current market expectations are: if CPI comes in below expectations (cooler inflation), it will weaken expectations of Fed rate hikes, giving risk assets a boost—Bitcoin could break upward to $66,300 or even $67,500; conversely, if inflation data is higher than expected, Bitcoin may retest the $62,000–$63,000 support zone.
In addition, the Jackson Hole central bank symposium on August 27 and the FOMC rate decision on September 16 form a “triple macro event” across August to September. Until the Fed policy path becomes clearer, the market will most likely maintain a range-bound oscillation.
2.3 Practical Strategy
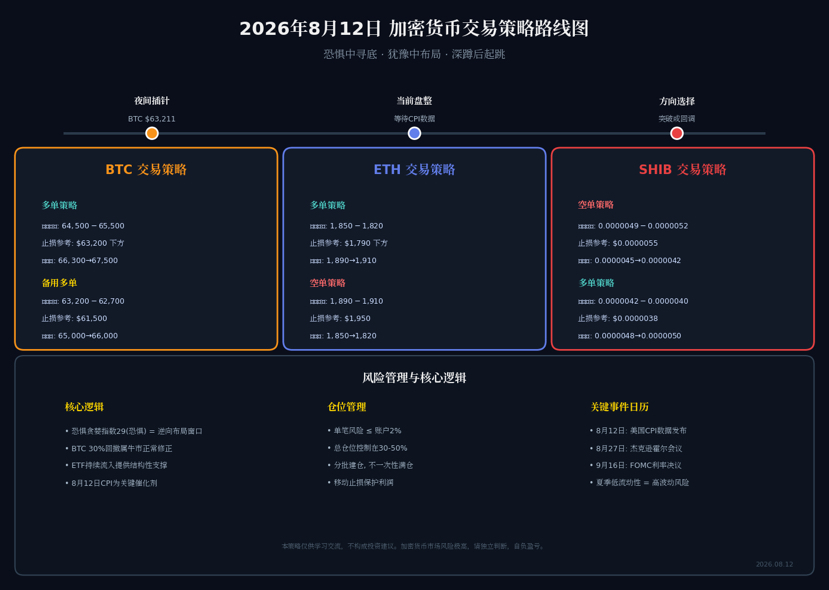
Long Strategy: If the price pulls back into the $64,500–$65,500 range, you may consider establishing a long position, with a stop-loss set below $63,200. The first target is $66,300, and the second target is $67,500. If the price continues to drop into the $63,200–$62,700 range, it can be seen as a higher-quality entry opportunity, but you should tighten the stop-loss to $61,500 and set targets at $65,000–$66,000.
Core Logic: In the extreme Fear & Greed Index zone of 29, placing long positions is essentially an anti-consensus practice of “when others are fearful, I am greedy.” But note that contrarian investing is not the same as blindly catching bottoms—you must wait for the price structure to confirm that support is valid before entering, rather than continuously “catching falling knives” during a decline.
III. Ethereum: The Long-Short Watershed at the $1,850 Defense Line
3.1 Technical Structure Analysis
Ethereum’s current quote is around $1,887, and the Fear & Greed Index is also 29. Based on CoinCodex data, Ethereum’s key support levels are $1,852 (S1), $1,830 (S2), and $1,792 (S3), while resistance levels are $1,912 (R1), $1,951 (R2), and $1,972 (R3).
The significance of the $1,850 level is self-evident. It is not only the S1 support level, but also a crucial integer threshold for market psychology. From past price action, the $1,850–$1,900 range is one of the most intense areas of long-vs-short conflict for Ethereum. The guidance given during the night live stream—“As long as $1,850 doesn’t break, longs can be done”—is based precisely on this technical logic.
The RSI reading is 55.47, also in a neutral zone. Stoch RSI is 12.86, which has reached the edge of the oversold area, suggesting potential rebound momentum in the short term. But the MACD indicator is still negative, indicating that the medium-term trend has not fully turned bullish yet.
3.2 Correlation and Divergence with Bitcoin
Recently, Ethereum and Bitcoin have shown a “down together but not up together” pattern—when Bitcoin rebounds, ETH’s upside is limited; when Bitcoin falls, ETH’s downside is larger. This divergence reflects structural concerns such as intensified competition among Ethereum Layer-2s and revenue pressure due to falling gas fees.
However, from a long-term perspective, Ethereum’s leading position as a smart contract platform has not changed. The ongoing expansion of Layer-2 ecosystems such as Shibarium, as well as potential progress on Ethereum ETFs, could all become catalysts for ETH to strengthen again.
3.3 Practical Strategy
Long Strategy: Establish long positions in the $1,850–$1,820 range, with a stop-loss set below $1,790 and targets at $1,890–$1,910. The core assumption of this strategy is that the $1,850 support holds, and that market sentiment improves after the CPI release.
Short Strategy: If the price rebounds into the $1,890–$1,910 range and fails to break through effectively, you may attempt to establish a short position, with a stop-loss set at $1,950 and targets at $1,850–$1,820. This strategy is suitable for traders who believe the market will remain in a range-bound oscillation rather than breaking upward directly.
Key Reminder: Ethereum’s volatility (1.95%) is higher than Bitcoin’s (1.25%), meaning that the same position size on ETH may experience larger fluctuations in profit and loss. Be sure to strictly control position sizing.
IV. SHIB: High-Short Opportunities After the Rebound
4.1 Technical Structure Analysis
Shiba Inu (SHIB) is currently quoted at around $0.00000489, ranked 37th by market cap, with a 7-day gain of 16.88%. This gain is impressive among major coins, but it also means some profit-taking has accumulated in the short term, creating downside pullback pressure.
From SHIB’s technical structure, the recent rebound strength has been relatively strong, but a clear trend reversal has not yet formed. As a high-volatility Meme coin, SHIB’s price action often correlates with Bitcoin, but with larger swings and faster pace.
4.2 Practical Strategy
Short Strategy: In the $0.0000049–$0.0000052 range (the wick rebound high), attempt to open a short position, with a stop-loss at $0.0000055 and targets at $0.0000045–$0.0000042. The logic behind this strategy is: short the high after a rebound and capture profits from the pullback.
Long Strategy (backup): If the price deeply pulls back into the $0.0000042–$0.0000040 range, you may attempt to open long positions, with a stop-loss at $0.0000038 and targets at $0.0000048–$0.0000050.
Risk Warning: As a Meme coin, SHIB’s price drivers come more from community sentiment and social media buzz than from fundamentals. Trading SHIB requires a higher risk tolerance and stricter stop-loss discipline.
V. Core Trading Philosophy: Squatting to Jump Higher
“Every squat is for a higher jump.” In the current market environment, this line carries special meaning.
From the perspective of the macro cycle, Bitcoin—from the $61,000 level in August 2024, to the historical peak in 2025, and then to $93,000 at the beginning of 2026—forms a complete macro bull-cycle. The current pullback, in essence, is the market searching for a new equilibrium price. 95% of Bitcoin has already been mined; only about 940,000 coins remain to be issued. The scarcity narrative is stronger than ever.
In terms of fund flows, although retail sentiment is bearish, institutions continue to accumulate through ETF channels. This “institutions buy, retail sells” pattern is strikingly similar to the market structure from late 2020 to early 2021. History won’t repeat exactly, but it rhymes.
From a risk management perspective, regardless of which strategy is used, the following principles must be followed:
• Per-trade risk must not exceed 2% of account funds
• Keep total exposure at 30%–50% to avoid going all-in
• Build positions in batches instead of betting all at once
• Set a moving stop-loss to protect existing profits
VI. Conclusion: Finding Certainty in Uncertainty
The August 2026 crypto market is full of uncertainty: CPI data hasn’t been released yet, the Fed policy path remains unclear, and summer’s low liquidity amplifies price volatility. But it is precisely within this uncertainty that there are trade opportunities with a degree of certainty.
For Bitcoin, $62,000–$63,500 is the bottom line that longs must hold. For Ethereum, $1,850 is the watershed between longs and shorts. For SHIB, the high-short opportunity after the rebound is a better risk-reward choice.
The market won’t reward the person with the most accurate predictions—it only rewards the person with the best risk control. Stay calm in fear, and be resolute in uncertainty while building your positioning—maybe that’s the ultimate code to survive bull and bear cycles.
Disclaimer: This article is for learning and exchange only and does not constitute any investment advice. The cryptocurrency market is extremely risky, with wild price fluctuations. Readers must make independent judgments and bear all gains and losses themselves. Past performance does not indicate future returns. #美国7月CPI与PPI数据本周出炉 #参议院推迟CLARITY法案投票至9月 #Meta面临1.4万亿美元青少年安全诉讼 #MoneyGram将现金加密兑换扩展至Solana #金价升破4400美元创两月高位 $BTC