In early August 2026, around the $65,000 mark, Bitcoin repeatedly traded back and forth. There was insufficient momentum to break higher, while downside moves were also supported and held up, leaving the market in a typical “range-bound/vice-like” consolidation in the short term. Drawing on the latest on-chain data, ETF fund flows, seasonal patterns, and the macro environment, this article deeply analyzes the current market structure and suggests that the high-level consolidation phase may already have begun. The bearish outlook for the short term still holds value as a reference. Bitcoin should watch the $65,000–$65,500 resistance zone, with a downside target of $64,000. For Ethereum, watch the $1,930–$1,950 resistance zone, with a downside target of $1,870. Timing control is more important than directional judgment—avoid chasing or panic-selling.
1. Current market picture: step-by-step look back, bulls lack conviction
As of August 9, 2026, the spot Bitcoin price is trading around $65,000. Compared with the rebound high in mid-July at $66,500, it has fallen by more than $1,500. Looking back at recent action: on July 21, Bitcoin briefly spiked to $66,505, then quickly pulled back and failed to form an effective breakout. Since then, price has entered a typical “look back step by step” rhythm—each time there’s a modest rebound it is accompanied by a pullback; after each dip it gets support and rebounds again. Overall, it has been oscillating in a narrow range of $63,000–$65,500.
This type of price action itself points to a core problem: the bulls lack the conviction for sustained push-ups. True strong trends are usually fast, decisive, and without looking back. But the current back-and-forth, with neither side able to gain clear advantage, reflects that the forces between bulls and bears are becoming balanced, and that the willingness of bulls to hold and absorb at high levels has noticeably weakened.
On a daily timeframe, after Bitcoin probed lows near $62,200 in late July, it saw a round of consolidation and rebounds, but the rebound strength has been fading progressively. On July 31, the daily low briefly touched $62,410; although repairs followed, it still failed to hold above $65,000. The early-August rebound has been similar: price encountered clear resistance in the $64,500–$65,000 range, and repeated attempts came up short.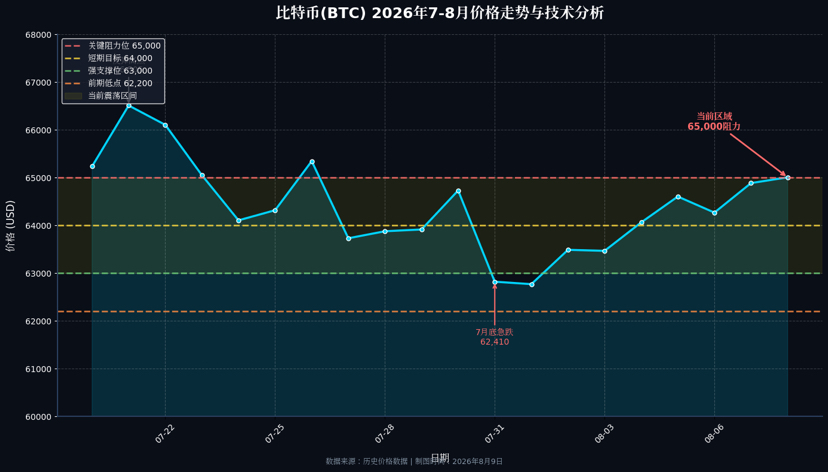
2. Capital flows: ETF inflows plunge 83%, institutional demand clearly cools
Capital flow is one of the most reliable indicators for judging the market’s true intentions. Since 2026, Bitcoin spot ETF flows have shifted significantly—from large inflows to sustained outflows—an change that has had a profound impact on price trends.
Data show that the weekly net inflow of U.S. spot Bitcoin ETFs peaked at $197 million on July 10, but then quickly fell to $75.67 million, and by July 24 it further dropped to $33.79 million. This means ETF inflows plunged by 83% within just two weeks, and the willingness of institutional investors to add exposure clearly cooled.
What deserves more attention is that in June 2026, the U.S. spot Bitcoin ETF market saw net outflows of about $4.5 billion—its worst single-month performance since the product was launched, and for the first time in the year cumulative flows turned negative. Although early July showed signs of some资金回流, the inflow volume was far smaller than before and followed a week-by-week declining pattern. This “declining inflows” pattern usually signals that institutional investors’ wait-and-see sentiment is intensifying.
Meanwhile, a more macro-level capital diversion phenomenon is taking place. Since April 2026, the combined U.S. net outflows from gold and Bitcoin ETFs have totaled about $12 billion, while over the same period U.S. semiconductor ETFs attracted more than $20 billion in net inflows. The five largest U.S. cloud providers are expected to spend about $725 billion on AI infrastructure in 2026, and roughly 70%—nearly $45 billion—will directly go to chips, servers, networks, and data centers. Hashdex’s Chief Investment Officer, Samir Kerbage, said bluntly that crypto weakness more reflects investors putting their money elsewhere rather than a problem with the digital-asset ecosystem itself.
When capital rotates from crypto into Treasuries or money markets, it can quickly come back once sentiment improves; but when it goes into capital cycles supported by long-term contracts and construction cycles—such as AI infrastructure—the timeline for return is significantly extended. This is also the biggest structural challenge facing the crypto market right now.
3. Seasonal patterns: August is the weakest month for Bitcoin all year
Historical data won’t simply repeat, but it often rhymes. From Bitcoin’s historical seasonal performance, August is a month that requires extra caution.
Data show that the historical median month-to-month return in August is -7.87%, which is the worst single-month record of the year, and the average return is only -0.64%. Since 2022, bearish August monthly candles have become the norm. Bitcoin fell about 8.5% in August 2024 and about 6.2% in August 2025. While history doesn’t guarantee the future, with current liquidity already on the weak side, seasonal headwinds undoubtedly increase downside risk.
Bitcoin gained 11.5% cumulatively in July. In historical terms, this is already impressive. But as the market often says, “the more it rises, the biggest negative factor.” July’s strong rebound has, to a large extent, already priced in some of the bulls’ momentum. After entering August, the combined effects of profit-taking pressure, seasonal weakness, and macro uncertainty significantly increase the probability that the market will come under pressure.
4. Technicals: multiple resistance points converging, making a breakout extremely difficult
From the perspective of technical analysis, the current multiple-resistance setup for Bitcoin forms a powerful “pressure band.”
First layer of resistance: the $65,000–$65,500 psychological level. This range is not only a high zone where the market previously rebounded multiple times, but also a dense area of mid- to long-term moving-average suppression. The price has probed this zone repeatedly, yet has not been able to break through effectively and hold. This suggests a large amount of trapped positions and profit-taking orders have accumulated there.
Second layer of resistance: the daily-level descending trendline. The descending trendline from the historical high of $126,279 in October 2025 is currently suppressing price in the $66,000–$67,000 area. This means that even if Bitcoin breaks above $65,000, stronger technical resistance still awaits overhead.
Third layer of resistance: RSI’s demand for a “overbought correction.” From the RSI, although it has recently fallen from the overbought region, it is still in a neutral-to-strong range and has not completed sufficient indicator repair. Without incremental capital to push the market higher, the need for adjustment at the indicator level will also limit upside space.
On the support side, $63,000–$63,200 is the long-bull defensive zone for this round of rebound. If it is lost, strong support below will be near $62,200, around the prior swing low. Judging from recent action, every time price dips to around $63,000 it receives support and rebounds, indicating that there is indeed strong buy-side follow-through in this area. However, note that the more times support is tested, the less effective it becomes. Once $63,000 is broken effectively to the downside, the lower space will open up.
5. Ethereum: more volatile than Bitcoin, though highly linked
Ethereum’s price action is highly correlated with Bitcoin, but the volatility is typically larger. Ethereum is currently trading around $1,930 and is also suppressed by the overhead resistance band of $1,950–$2,000.
Looking at the ETH/BTC exchange rate, Ethereum has been performing consistently weaker relative to Bitcoin. This reflects that market capital is more inclined to flow into Bitcoin—the “digital gold”—rather than the Ethereum ecosystem. With the overall market’s risk appetite declining, Ethereum as a high-beta asset typically experiences pullbacks that are larger than Bitcoin’s.
Technically, Ethereum’s daily MACD remains in negative territory. Although the short-side bars have narrowed, there is still no clear bullish golden-cross signal. The RSI is running below the neutral region, indicating that bullish sentiment has weakened. Strong support is near $1,870. If Bitcoin pulls back, Ethereum will most likely move down in sync and test that support.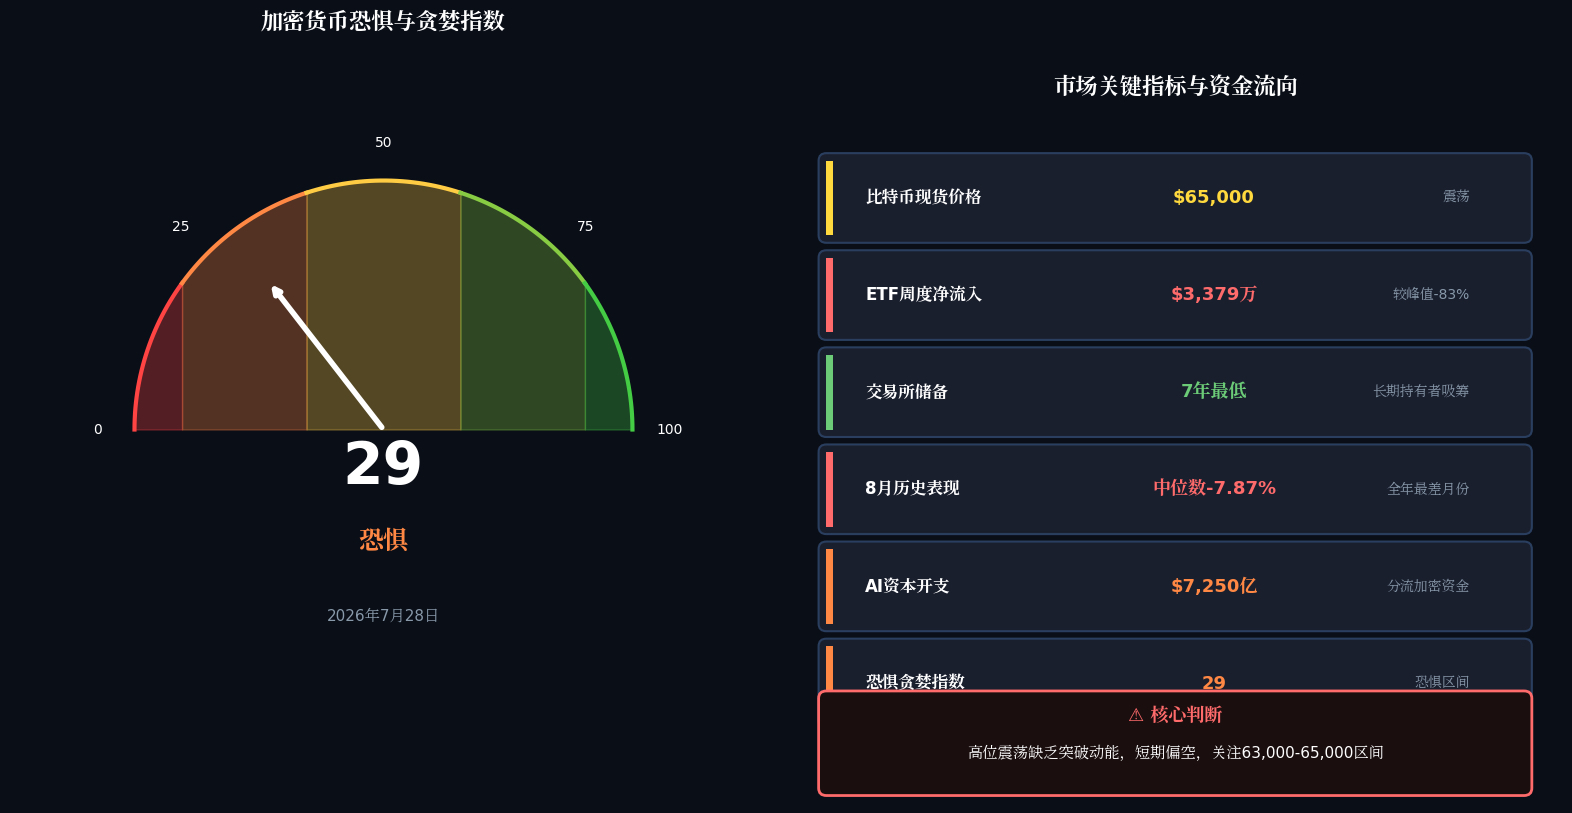
6. Macro environment: dual shocks from Fed policy and geopolitical risk
At the macro level, the biggest source of uncertainty currently comes from the Federal Reserve’s monetary-policy path. June U.S. inflation data came in weaker than expected, and the market temporarily reduced its bets on near-term Fed hikes, providing some support for risk assets. However, Deutsche Bank expects the Fed to hike twice in 2026. If that expectation is realized, it will put pressure on all risk assets—including cryptocurrencies.
In terms of geopolitics, although there have been signs of easing in the Middle East situation recently, uncertainty still remains. Fluctuations in oil prices and disruptions to global supply chains can influence the Fed’s policy decisions through the inflation channel, indirectly affecting the crypto market.
In addition, the performance of the U.S. stock market is worth watching. Recently, the S&P 500 has refreshed its all-time highs and technology stocks have strengthened collectively, but whether this bullish momentum can continue remains in question. If the U.S. stock market pulls back, the decline in risk appetite will quickly transmit to the crypto market.
7. Trading strategy: timing matters more than direction—avoid chasing rallies and panic selling
Based on the analysis above, the market’s core characteristics can be summarized as: consolidation at high levels, momentum fading, and risk building. In this situation, trading strategies should follow these principles:
First, don’t chase rallies. The $65,000-plus resistance has been verified multiple times. Each time price rebounds into this area is a good opportunity to reduce exposure or go short. The risk-reward ratio of chasing rallies is extremely poor. Once the market reverses, the cost of getting trapped at high levels can be huge.
Second, don’t panic-sell. Support below $63,000 has also been tested multiple times. Until support is not broken effectively, chasing shorts blindly also carries risk. A better approach is to wait for confirmation signals near key support.
Third, focus on timing rather than direction. In the current choppy, range-bound environment, it’s extremely difficult to judge direction, but timing is relatively easier. Short on rebounds into the resistance zone, go long on dips into the support zone—taking high profits and buying low in a disciplined manner is a more pragmatic strategy.
Fourth, control position size. In a market environment where direction is unclear and volatility is high, position management matters far more than timing. It is recommended to keep position size within 30%–50% of total capital, and retain enough cash to handle sudden changes.
8. Conclusion: a high-probability scenario is a consolidation at high levels
Based on a综合 assessment from five dimensions—price action, capital flows, seasonal patterns, technical structure, and the macro environment—the conditions for Bitcoin to continue breaking upward are not yet mature. The repeated failure to decisively clear the $65,000 level, the clear cooling of ETF inflows, the historical seasonal weakness pattern in August, and the structural pressure caused by AI-related capital diversion all point to one conclusion: the market is most likely entering a consolidation phase at high levels, and the risk of a short-term pullback is greater than the likelihood of an upside breakout.
Of course, uncertainty always exists in the market. Bitcoin exchange reserves have fallen to roughly the lowest level in about seven years, while long-term holders are accumulating at the fastest pace in years. These structural tailwinds suggest that the foundation for a long- to mid-term bull market has not been broken. But in the short term, given insufficient incremental capital and weak sentiment indicators, a pullback correction may be the healthier choice.
For investors, the most important thing right now is to stay patient and wait for the market to provide a clearer directional signal. In a ranging market, moving less and watching more—controlling the pace—often protects capital better than frequent trading. After all, in this market, it’s more important to last than to make quick gains.
Risk warning: The cryptocurrency market is highly volatile. This article is for technical analysis and market assessment only and does not constitute any investment advice. Investors should make independent decisions based on their own risk tolerance and must not blindly follow others.#BIP110软分叉尝试启动 #韩国拟放宽加密服务商大股东规则 #XRP守住1美元
#参议院拟9月表决CLARITY法案 #伯克希尔季度净买入198亿美元股票 $BTC