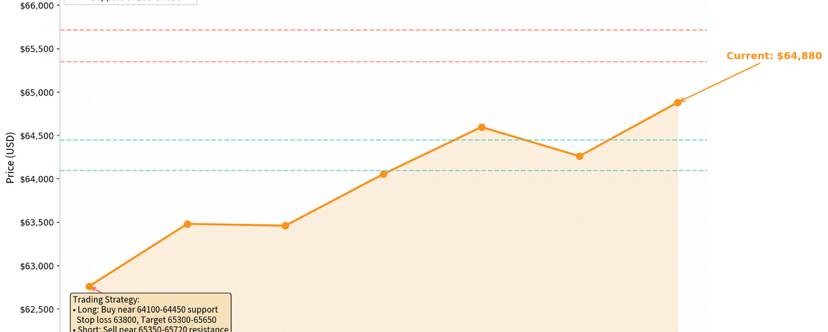

On the evening of August 8, 2026, Bitcoin rebounded and began a recovery from the $62,228 low. It has now held around the $64,880 area, trading above short-term moving averages. Ethereum has similarly rebounded to $1,908. Combining the latest on-chain data, ETF fund flows, and the macro environment, this article provides an in-depth analysis of the market’s structural features, proposes a range-trading strategy, and highlights the risks of the August seasonal pullback as well as the potential risk of a breakdown.
I. Bitcoin (BTC): A range-bound dilemma within the rebound and recovery
1.1 Review of price action
By the close on August 7, Bitcoin was trading at $64,880.19, up about 3.4% from $62,763.32 on August 1. From the daily chart perspective, in early August Bitcoin went through a bottoming process from $62,233 (the August 1 low), followed by several consecutive days of range-bound upward movement. On August 5, it briefly touched $64,597; on August 7, it closed at $64,880. Overall, it shows a repair pattern characterized by “rising lows and higher highs.”
However, this rebound has not been smooth. On August 6, price saw a mild pullback to $64,262, indicating that sell pressure above the market still exists. From the 4-hour timeframe, although price has held above short-term moving averages, trading volume has not expanded meaningfully. This suggests the current rebound is more of a technical repair rather than the start of a new, trend-driven rally.
1.2 Key technical levels
Resistance level: The $65,350—$65,720 range is the core resistance zone for the recent rebound. This area is not only where the highs were tested multiple times in late July without success (July 24 high: $65,760; July 27 high: $65,658), but also the first important barrier below the 100-day moving average (around $68,750).
Support level: The $64,100—$64,450 range provides near-term support. This zone corresponds to a dense trading area from August 4 to 6. If it breaks, the key support below would shift to the $62,200—$62,800 range (the low area from August 1 to 3).
1.3 Deep on-chain and liquidity signals
There is a contradiction in the current market that is worth being cautious about: whales are accumulating, while long-term holders are slowing down.
According to Glassnode data, the number of whale entities holding at least 1,000 BTC increased from 1,263 in the late-July period to 1,267, indicating large holders are buying at lower prices. However, the “Hodler net position change” metric fell from 29,838 BTC on July 11 to 15,766 BTC on July 26, a drop of 47% over two weeks.
What’s even more worth paying attention to is the direction of ETF capital flows. The one-week net inflow into Bitcoin spot ETFs dropped sharply from a peak of $197 million on July 10 to $33.79 million on July 24, a decline of 83%. With a clear cooling in institutional capital, and seasonal weakness in August where the median historical drawdown is as large as -7.87%, the foundation for the current rebound is not solid.
1.4 Technical pattern risk warning
On a three-day timeframe basis, Bitcoin has been continuously trading within a “head-and-shoulders top” formation since early March. The current price is in the rebound phase of the right shoulder, but volume has been shrinking steadily—this is a classic “rally lacking strength” signal.
If the three-day moving line’s closing price can hold above $66,885, the head-and-shoulders top pattern would be invalidated, and bulls may regain momentum. Otherwise, if $60,965 is lost, the neckline would be broken, and the technical downside targets could point to $54,000 and even $41,266.
1.5 Trading strategy
Long strategy: After the $64,100—$64,450 range stabilizes on a pullback, enter longs with a stop-loss at $63,800 and targets at $65,300—$65,650. The core logic is to capture rebound opportunities from the lower end of the range, but you must strictly place the stop-loss because if $63,800 is broken, downside room will open up significantly.
Short strategy: After a spike into the $65,350—$65,720 range stalls, set up a short position. Place a stop-loss at $66,000 and targets at $64,600—$64,200. This strategy applies to a technical pullback after the price rebounds to the top of the range, but you must be cautious about the risk of a breakout with expanding volume.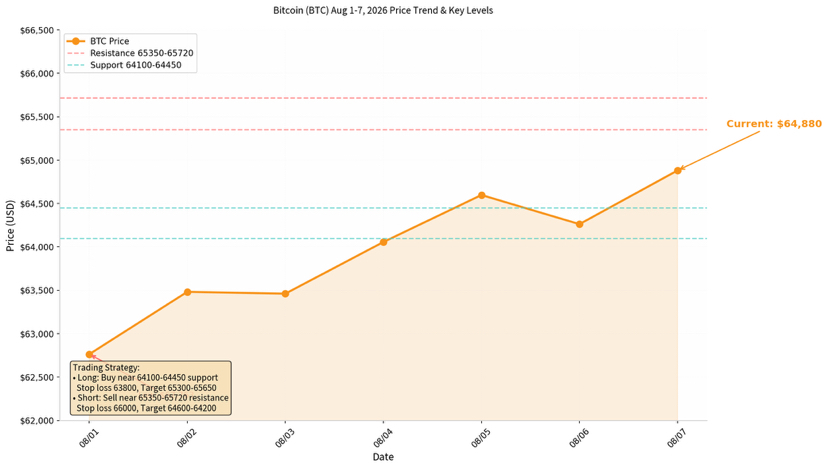
II. Ethereum (ETH): Dual pressure amid a weak rebound
2.1 Review of price action
Ethereum is currently at $1,908.76, down about 51.19% from $3,910.94 in the same period a year ago. Since August, ETH has been ranging and climbing from the $1,820 low. On the 4-hour chart, the center of gravity of the candles has been steadily rising, showing a rebound pattern that tracks Bitcoin.
Yet, Ethereum’s rebound strength is clearly weaker than Bitcoin’s. The ETH/BTC ratio has fallen to around 0.03, a new low since 2020, showing that Ethereum has continued to underperform Bitcoin throughout this cycle.
2.2 Key technical levels
Resistance level: The $1,940—$1,980 range forms dual pressure. Near $1,940 is a recent short-term high that has been tested unsuccessfully multiple times, while $1,980 is a more important medium-term resistance corresponding to around the 50-day moving average. Only by holding above $1,980 can the short-term trend turn more bullish.
Support level: The $1,900—$1,865 range is the key near-term support. $1,900 is a psychological round-number level, while around $1,865 is the early-August low zone. If $1,865 breaks, the $1,800 level will be tested; a further breakdown could push prices toward $1,750—$1,720.
2.3 Concerns on the fundamentals and ecosystem level
Ethereum’s core challenges currently come from three dimensions:
First, L2 value leakage. The rise of Layer 2 networks such as Arbitrum, Base, and Optimism is diverting Ethereum mainnet gas fees and user activity, directly weakening ETH’s "ultrasound money" narrative.
Second, exchange reserves have fallen to a ten-year low. As of mid-June, Ethereum exchange reserves had dropped to 14.5 million ETH, the lowest in ten years. This appears bullish (less sell pressure), but it also reflects the drying up of market liquidity—when real buy orders return, there will be limited available supply to absorb, but the current problem is that buy demand is also scarce.
Third, expectations for the Glamsterdam upgrade. Ethereum developers have entered the final devnet stage, with the mainnet target set for the end of August 2026. The upgrade promises 10,000 TPS and a 78% reduction in gas fees. This is ETH’s most important technical catalyst. However, historically the market often follows the pattern of “buy the expectation, sell the fact” for Ethereum upgrades, and there is a risk that the upgrade window could be delayed.
2.4 Trading strategy
Long strategy: After the $1,865—$1,900 range stabilizes on a pullback, enter longs with a stop-loss at $1,845 and targets at $1,938—$1,975. This strategy requires waiting for a clear stabilization signal (e.g., a lower wick on the 4-hour timeframe or a bullish candle with expanding volume) to avoid blindly catching the bottom while prices are still falling.
Empty trade strategy: Place a short position after the price bounces into the $1,940—$1,980 range and meets resistance, with a stop-loss at $2,000 and targets at $1,902—$1,870. This strategy suits technical pullbacks after price rebounds into a pressure zone, but you must watch out for sudden positive catalysts driven by expectations of the Glamsterdam upgrade.
III. Macro conditions and risk factors
3.1 Fed policy and the interest rate environment
On July 29, the Federal Reserve voted 9 to 3 to keep interest rates unchanged in the 3.50%—3.75% range, with three members favoring a 25-basis-point rate hike. This split decision means tightening risk has not been fully eliminated. Meanwhile, the yield on 10-year U.S. Treasuries rose from about 4.65% on July 27 to 4.75% on July 31, and the 30-year yield climbed to 5.27%.
Rising long-end interest rates put pressure on risk assets; crypto is no exception. Until the Fed clearly turns toward easing, the market may not receive sustained macro liquidity support.
3.2 Trend of integrating crypto with traditional finance
In 2026, the crypto industry is witnessing a structural shift: moving from “in-group competition and mutual cutting” to “external convergence.” The total market value of the stablecoin market has reached an all-time high of about $320 billion. In 2026 Q1, trading volume for RWA (real-world asset) perpetual contracts reached $524.79 billion in a single quarter, far exceeding the $313.02 billion for all of 2025.
This trend means that capital in the crypto market is migrating toward traditional financial assets, diverting direct demand from core crypto assets such as BTC and ETH.
3.3 August seasonal risk
Historical data shows that August is the weakest month for Bitcoin performance of the year, with a historical median return of -7.87%. Since 2022, a bearish August monthly close has become the norm. In August 2026, the seasonal factor combines with cooling institutional capital and slower accumulation by long-term holders, making the risk of a deep pullback impossible to ignore.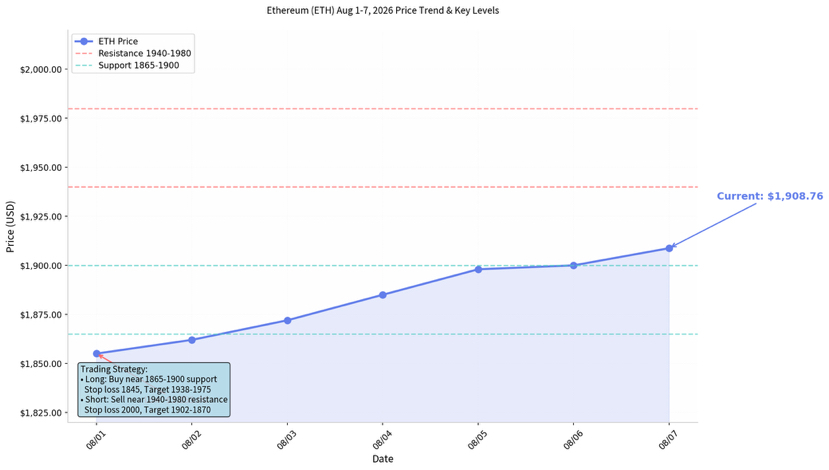
4. Summary and outlook
Both Bitcoin and Ethereum are currently in a rebound and repair phase, but they have not yet opened up a one-way upward space. Bitcoin is ranging within $64,100—$65,720, while Ethereum is moving within $1,865—$1,980. In the short term, range-trading strategies remain the first choice, but strict risk control is still required.
Key takeaways:
1. Bitcoin: The rebound to $64,880 is close to the top of the range. The $65,350—$65,720 area faces heavy pressure. Against the backdrop of ongoing cooling ETF inflows and slower accumulation by long-term holders, it will be difficult to break above the resistance level. If a breakout cannot be achieved with rising volume, the probability of a pullback to test support at $64,100—$64,450 is relatively high.
2. Ethereum: Rebound strength is weaker than Bitcoin; the ETH/BTC ratio has hit a new low since 2020. The dual pressure of the $1,940—$1,980 range requires a stronger bullish catalyst to break through. The Glamsterdam upgrade is a potential catalyst, but the market may already be pricing in expectations early.
4. Risk warning: August’s seasonal weakness, uncertainty in Fed policy, and the potential breakout risk of Bitcoin’s head-and-shoulders top formation all require investors to stay cautious. It’s recommended to control position size and avoid heavily betting on a direction when the range is still unclear.
Disclaimer: This article is based on publicly available market data and technical analysis, for informational reference and learning purposes only, and does not constitute investment advice. Crypto markets are highly volatile; exercise caution when investing and make decisions according to your own risk tolerance. #伊拉克石油出口下降75% #土耳其限制商船进入黑海 #美联储加息分歧加深 #XRPL拟推机密RWA转账 #美国7月非农意外下降 $BTC