

In this article, we will review technical factors, on-chain data, and macro factors.
Let's find out whether $XRP can continue its upward trend this year or if the situation will lead to a potential correction.
The pivotal question: Will XRP return to the forefront in early 2026?
At the beginning of 2026, XRP made a strong return to the spotlight after recording a rise of over 20% in a short period, reaching levels of $2.35 – $2.40 before entering a phase of natural price consolidation.
This notable performance coincided with a return of interest in large-cap altcoins, in a market environment characterized by relative stability in Bitcoin's movement.
But the most important question the market is asking now:
Is what we are witnessing just a temporary technical rebound, or the beginning of a broader upward wave for XRP in 2026?
In this article, we present the complete picture from technical, On-Chain, and market fundamentals angles, focusing on probabilities rather than guarantees.
First: The recent price movement, what does the chart tell us?
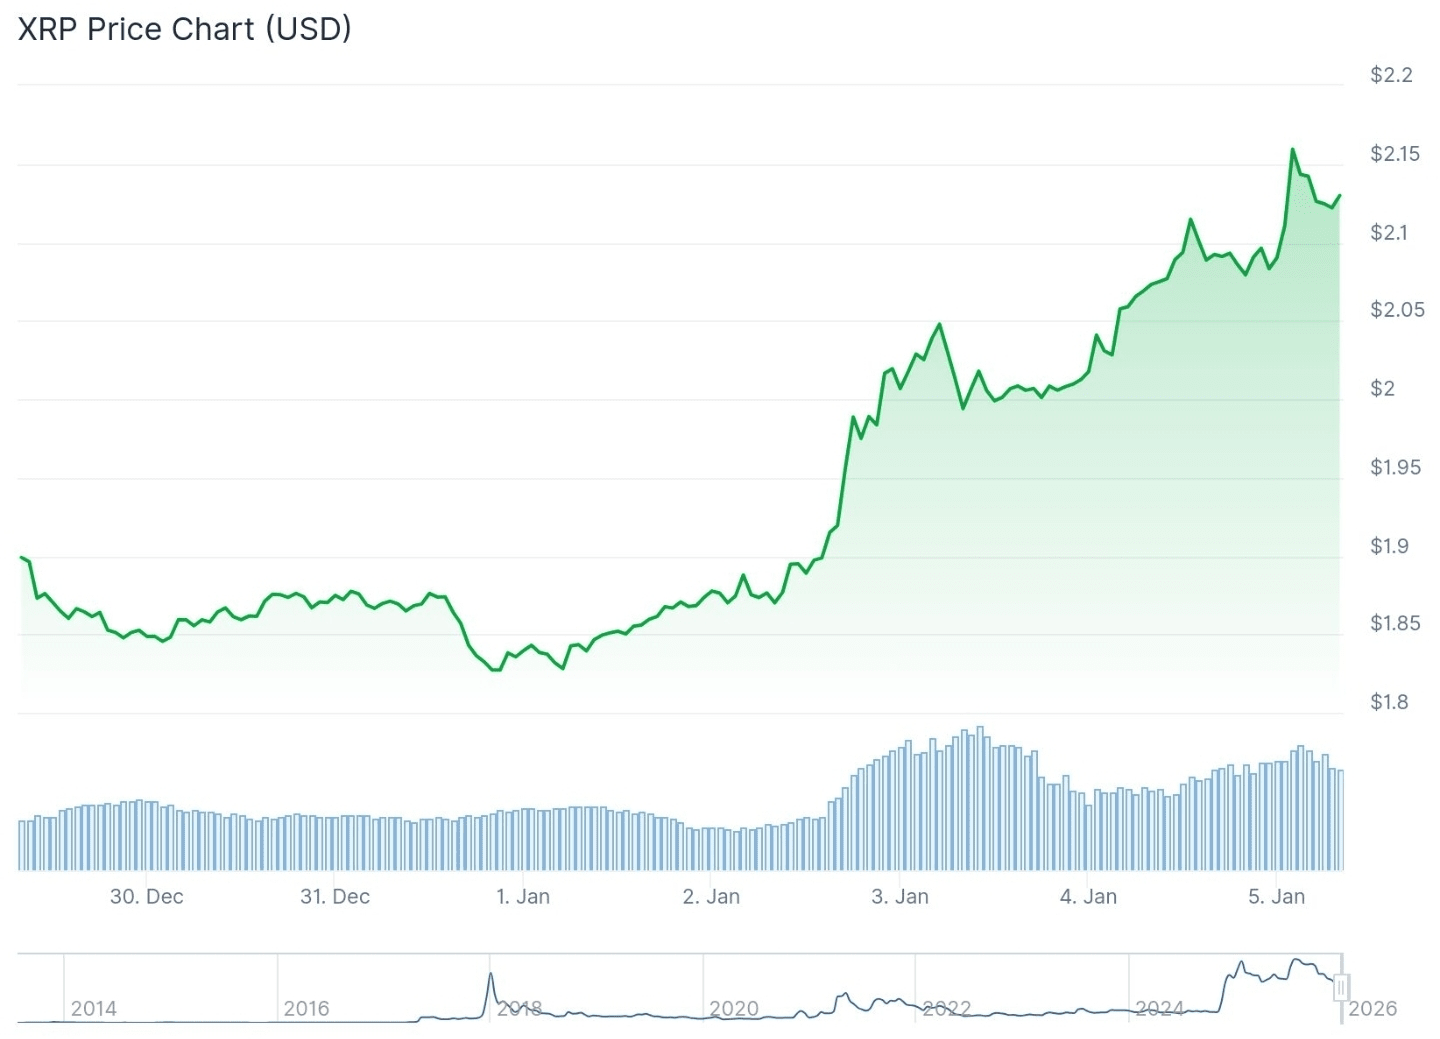
The chart illustrates the rapid rise of XRP's price from the $1.85 area to around $2.35 during the early days of January 2026, supported by a clear increase in trading volumes.
XRP saw a significant technical breakout in early January after exiting a multi-month descending channel.
The rapid transition from $1.85 to $2.35 in less than a week, with high trading volumes, reflects:
Real liquidity entry, not short-term speculation
A clear shift in the overall sentiment towards the currency
Return of confidence after a long period of pressure and correction
After this rise, the price entered a healthy consolidation phase near the $2.00 – $2.10 range, which is a natural behavior often preceding a new directional move.
Technical Analysis
Overall trend
Short-term trend: Bullish
Medium-term trend: Neutral leaning positive
Long-term trend: Needs confirmation by breaking key resistances
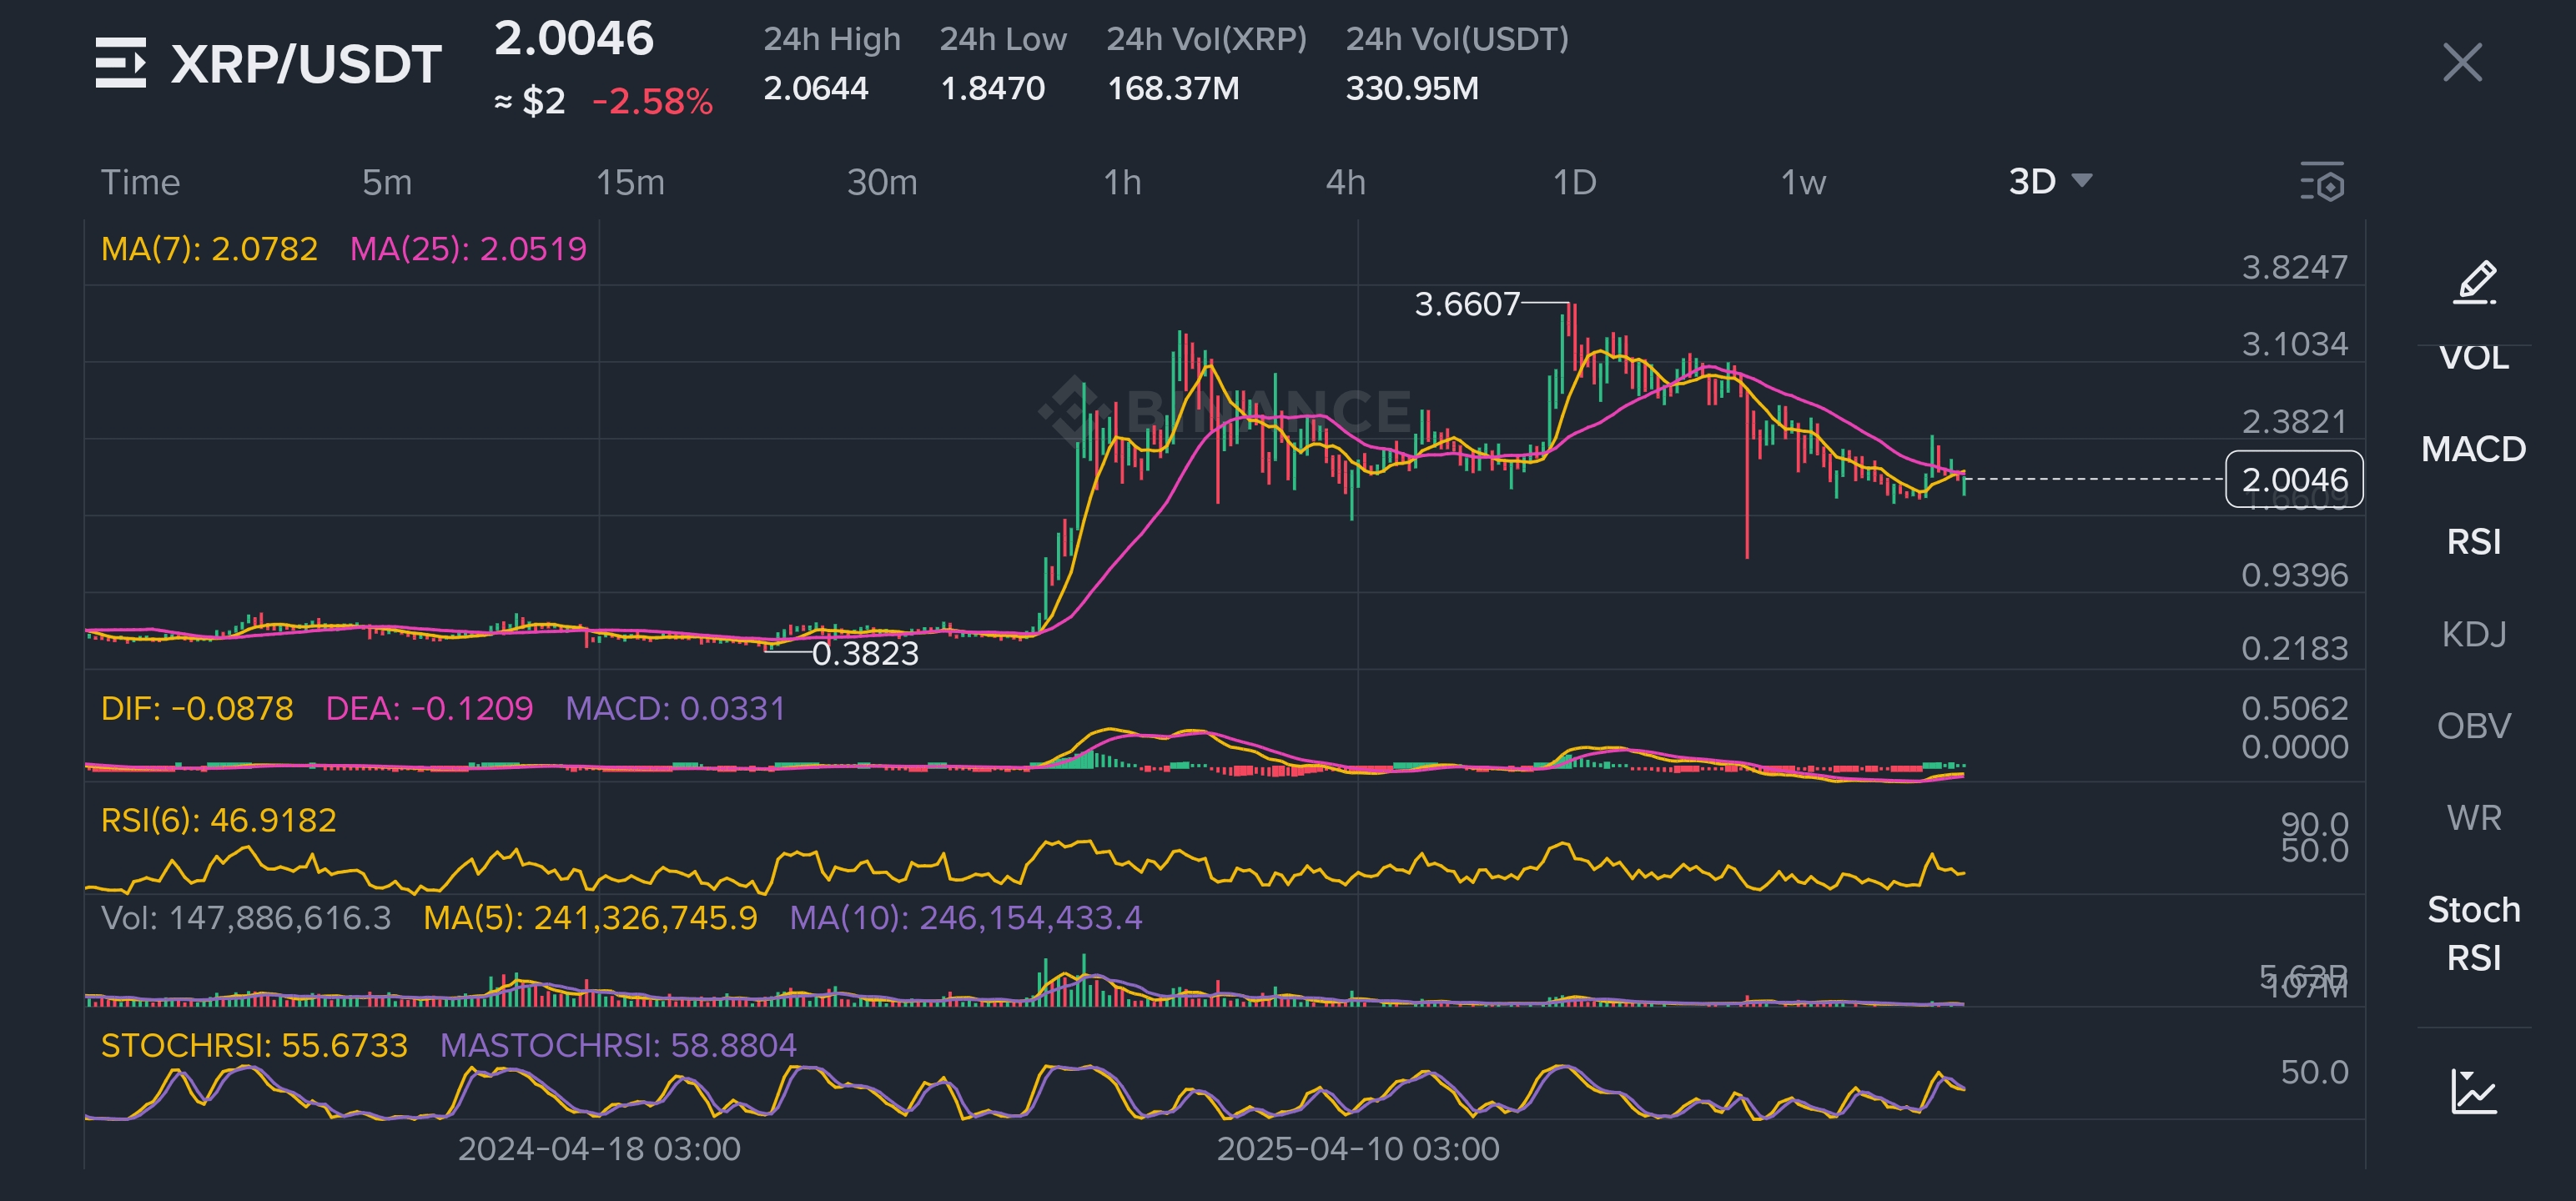
The chart shows price consolidation above a rising support area, with continued trading within a narrow range awaiting a clear break in either direction.
Moving averages
The price is trading above EMA 50 → Positive support for the current momentum
EMA 200 is positioned near $2.35 – $2.40 → Key technical resistance
Daily close above EMA 200 may indicate a shift in the medium-term trend
Momentum indicators like RSI and MACD show a relatively balanced state, with no sharp overbought signals so far.
Key support and resistance levels
🟢 Supports
$2.00 → Key psychological and technical support
$1.95 → Secondary short-term support
$1.80 – $1.82 → Historical demand zone in case of deeper correction
🔴 Resistances
$2.15 → First short-term resistance
$2.35 – $2.40 → Key resistance + EMA 200
Closing above $2.40 could open the door to $2.70 then $3.00
Current resistance levels reflect previous selling pressure areas, while the $2.00 level remains a key support base for the price.
On-Chain Analysis: What are wallets and liquidity doing?
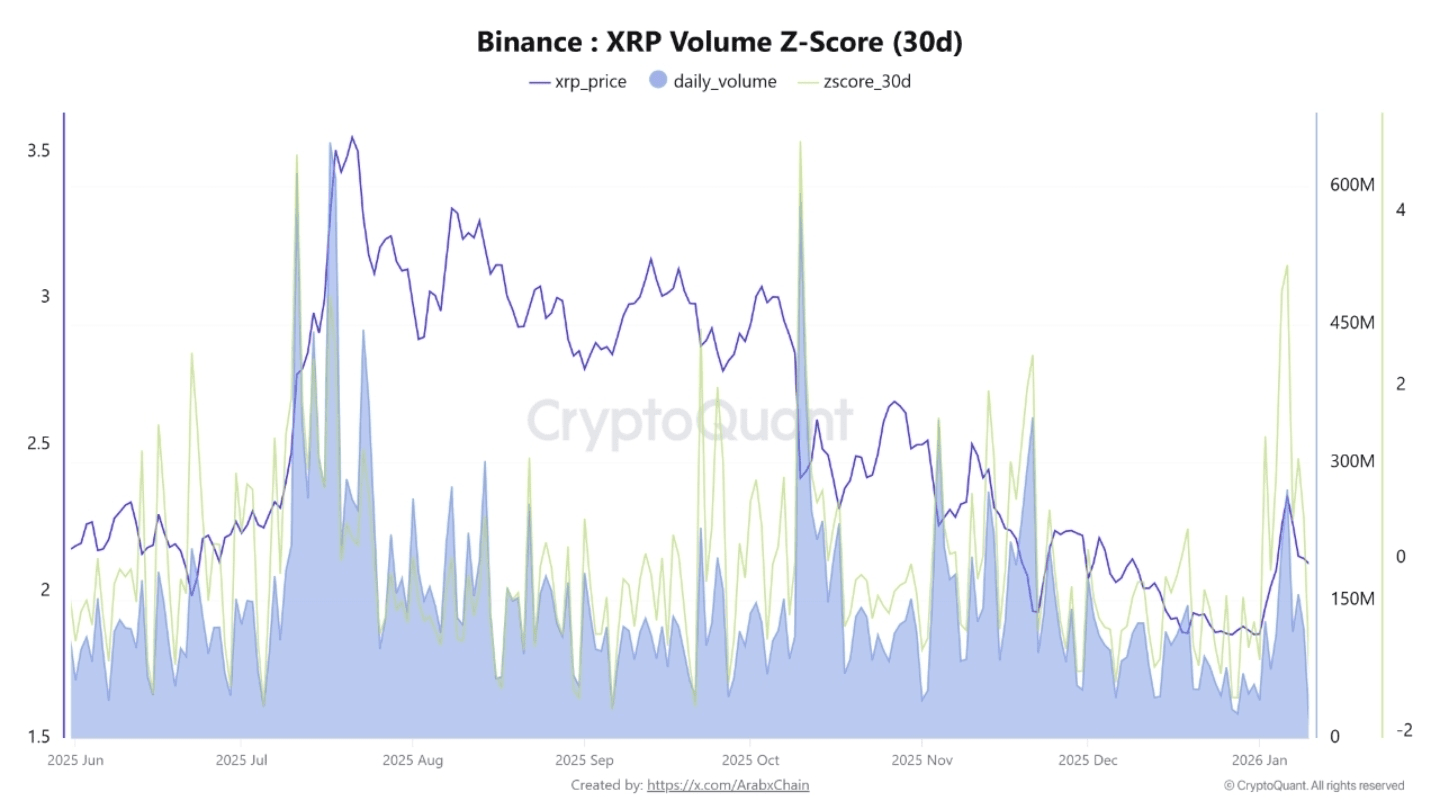
🔹 Trading volume (Volume Z-Score)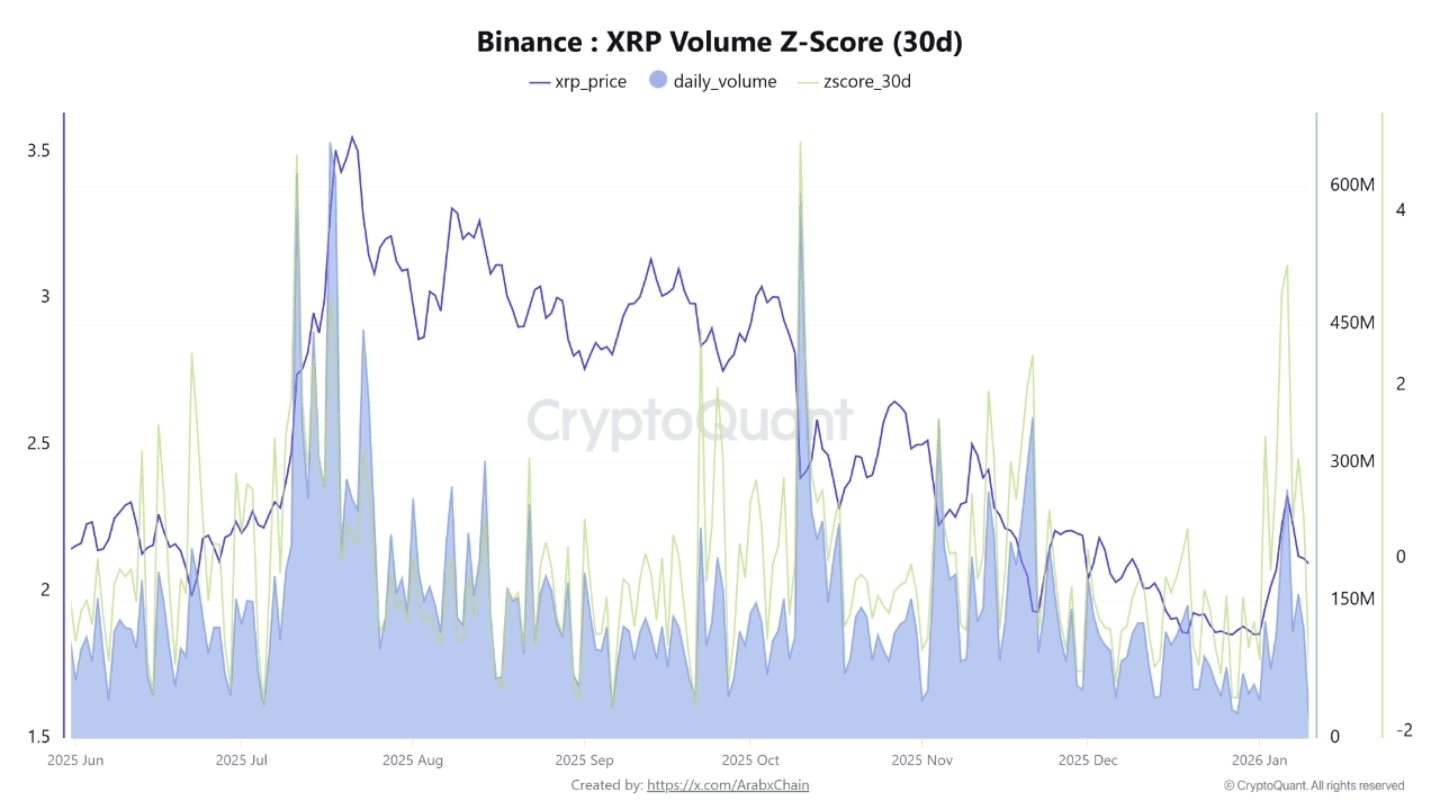
The trading volume Z-Score indicates that current activity is close to the historical average, suggesting the absence of a speculative bubble despite the price increase.
Trading volume data indicates that the recent rise was not accompanied by excessive activity, which is a positive factor indicating relative balance between buying and selling.
🔹 XRP balances on exchanges
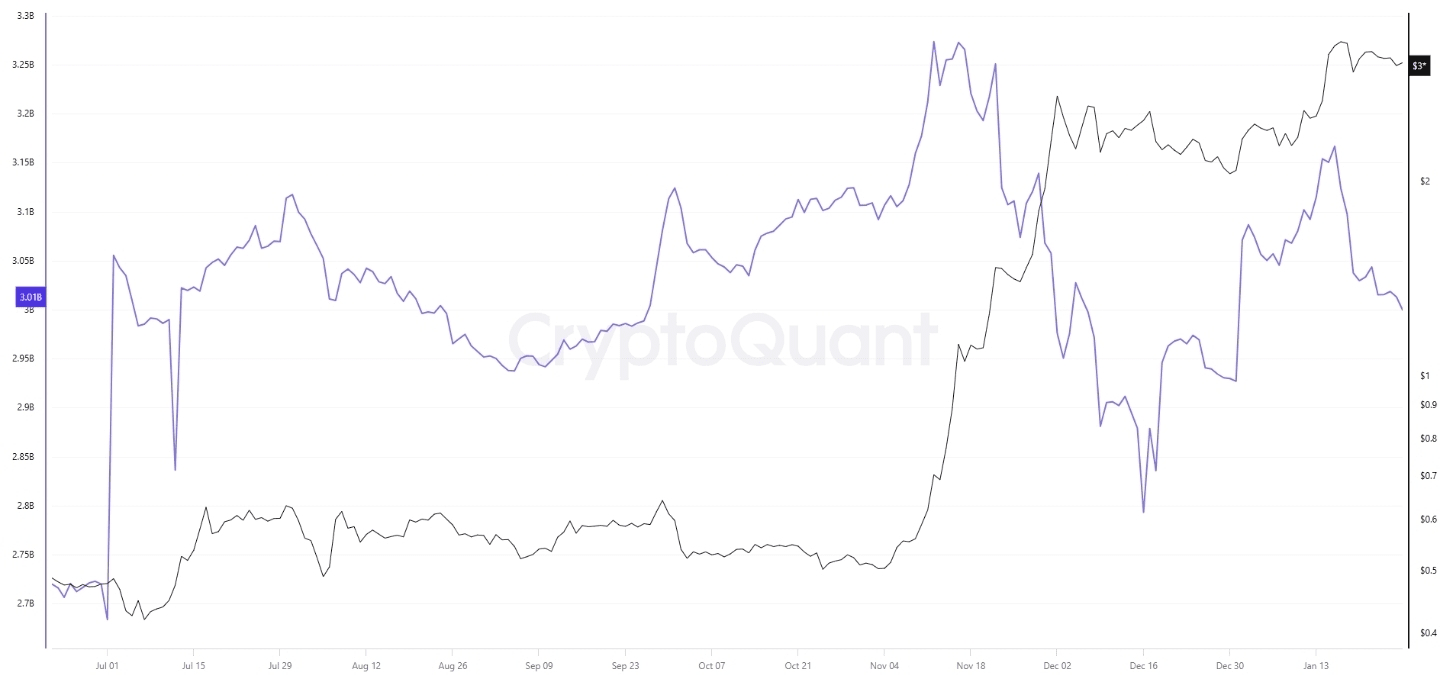
Decline in XRP balances on exchanges alongside price stabilization, reflecting reduced selling intent and a shift of some liquidity to long-term storage.
This behavior is often interpreted as:
Reducing selling pressure
Building gradual investment positions
🔹 Active addresses activity
The number of active addresses is still below previous peaks, indicating that the price increase has not yet been accompanied by strong expansion in the user base.
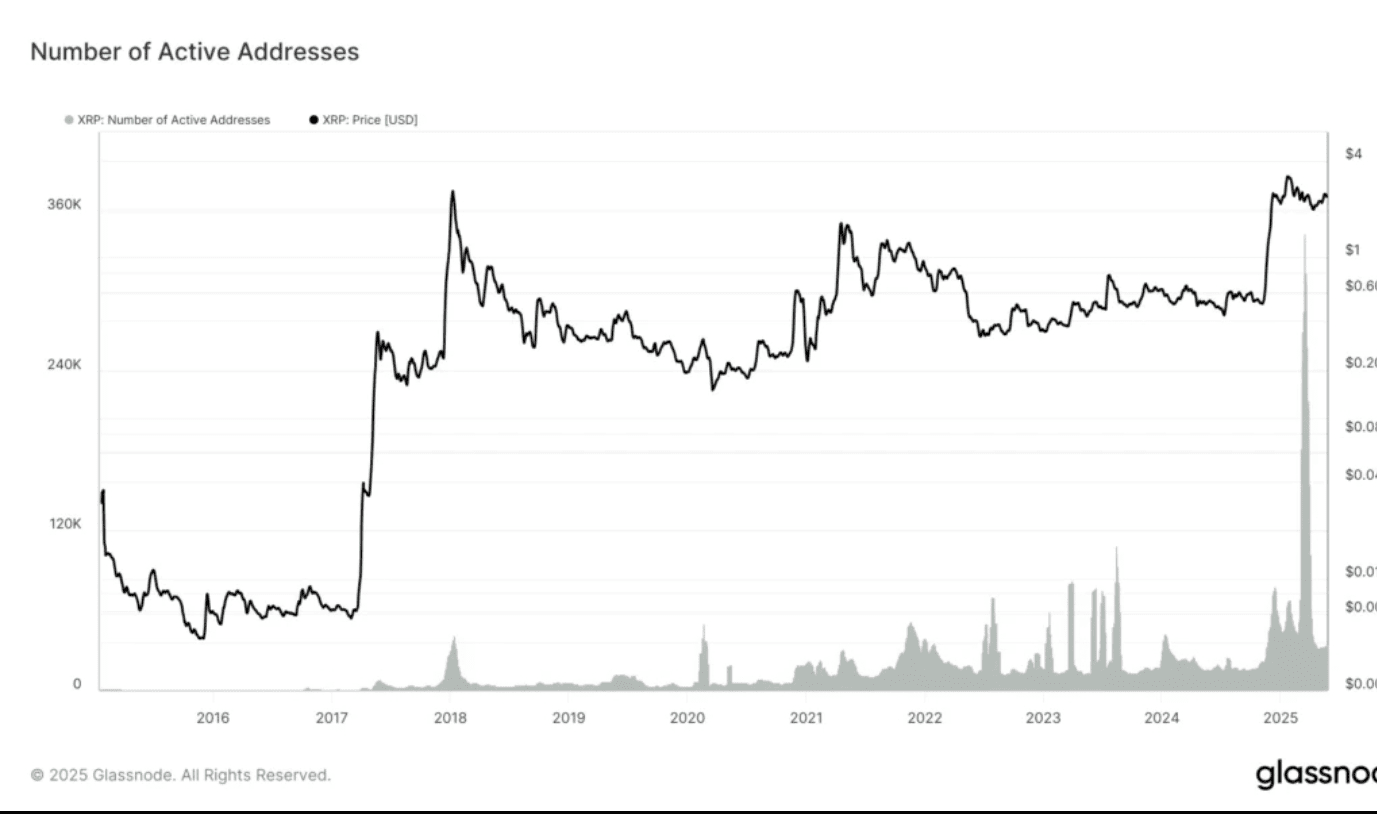
January 2026 data shows stability in address activity with a slight downward trend, which may reflect a re-centering phase rather than new expansion.
Fundamentals: Why is the market watching XRP now?
Several fundamental factors have brought XRP back to the forefront:
Greater regulatory clarity
The conclusion of the previous legal dispute has alleviated long-term uncertainty.2. Return of the institutional narrative
XRP is being presented again as a practical solution in cross-border payments.Market cycle
Historically, large currencies start moving before momentum shifts to smaller projects.
Impact of Bitcoin and the overall market
Overall market stability and rising market capitalization enhance the risk appetite towards large currencies like XRP.
Bitcoin stability at high levels:
Supports overall liquidity
Allows for capital flow towards alternative currencies
Any strong movement from Bitcoin could play a crucial role in determining XRP's next direction.
Potential scenarios in Q1 2026
📈 Positive scenario
Stability above $2.00
Clear breakout at $2.40
Potential targets: $2.70 → $3.00
🤝 Neutral scenario
Sideways trading between $1.95 – $2.30
Accumulation phase before a larger move
📉 Negative scenario
Breaking $2.00 with a daily close
Drop towards $1.80
It remains a correction as long as historical support holds
Summary: Can XRP continue to rise?
Current data indicates that XRP has strong fundamentals to continue performing positively in early 2026, provided that:
Maintaining key supports
Breaking pivotal technical resistances
Overall market remaining stable
Momentum is present, liquidity is available, and the fundamentals are stronger than previous cycles but probabilities do not imply guarantees.
⚠️ Disclaimer
This content is for analytical and educational purposes only and is not an investment recommendation. Please do your own research (DYOR) and manage risks carefully.
#MarketRebound #XRPPredictions
