Why We Should DCA into the S&P 500—I’ll share some interesting data with everyone.
Whenever the market starts to panic, people inevitably think of the same approach that Buffett has talked about again and again.
For most ordinary investors, holding a low-cost S&P 500 index fund long term is often more effective than trying to guess the top and the pullbacks every day.
Actually, since I first entered this market, the most I’ve talked with you all about has always been the Nasdaq and the S&P 500. Individual stocks may offer opportunities, but if you extend the time horizon, broad market indices are really the easiest to execute—and the easiest to stick with—for ordinary investors.
Recently, I saw another set of pretty interesting data, so I wanted to share it with you.
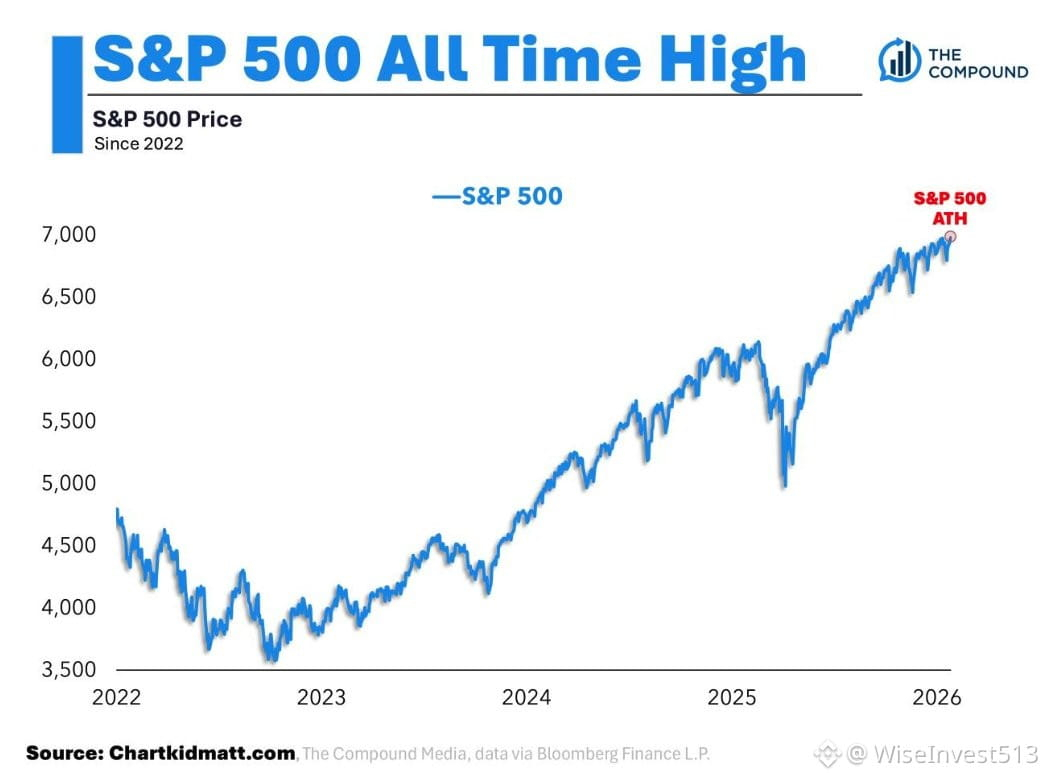
Since 1950, the S&P 500 has reached historical all-time highs about 1,325 times in total—an average of roughly 17 times per year.
So everyone needs to understand one thing first: making a new historical high does not equal the market top.
On the contrary, in a long-term upward market, it should keep setting new historical highs. If an index doesn’t make new highs for decades, that’s what should be worrying.
What’s even more interesting is that if you buy “unlucky” at exactly the moment the S&P 500 sets a new all-time high, the results aren’t as bad as people might imagine.
• Holding for 1 year: average return about +12.7%, profitable 73% of the time
• Holding for 3 years: average return about +33.4%, profitable 84% of the time
• Holding for 5 years: average return about +52.9%, profitable 88% of the time
• Holding for 10 years: average return about +172%, profitable 95% of the time
• Holding for 20 years: average return about +637%, profitable 100% of the time in the historical sample
In other words, if you invest $10,000 near a historical all-time high and truly hold it for 20 years, on average it could grow to about $73,700.
I find this data especially interesting because many investors’ biggest psychological barrier is:
“Since it’s already made a new high, if I buy now, am I just taking the bag?”
“What if I wait for a 10% pullback before buying?”
“It’s so expensive now—let’s wait for it to drop.”
But the historical data tells us that what truly drags long-term returns is often not “buying at a historical high,” but rather fear of new highs—holding cash and waiting for a perfect pullback.
And here’s the harshest part of the market: you think you’re waiting for a better entry point, but it might only give you a 5% pullback after it has already risen 10% or 20%.
So I’ve always felt that for long-term indices like the S&P 500 and the Nasdaq, you shouldn’t be too fixated on trying to call an absolute market top.
New all-time highs are simply the norm in a long-term bull market.
The real question isn’t: “Is today the highest point?”
It’s: “In 5 or 10 years, will the best batch of U.S. companies’ earnings keep growing?”
If the answer is still yes, then whether it just hit a new historical high in the short term may not be as important as we think.
Of course, this doesn’t mean you should always go all-in at once, nor does it mean the market won’t experience pullbacks of 20%, 30%, or even more. The approach that’s still more suitable for ordinary investors is to control position sizing, keep making regular contributions (DCA), and extend the time horizon.
Because the money you really earn is never just from the next week’s 5% fluctuation.
It’s the money from the next 10 or 20 years—earnings growth and repeated new highs for the index. So whenever the market panics, I remind myself again and again:
Don’t treat a long-term upward market as if it’s about to end just because of the words “historical all-time high.”
If everyone is truly getting annoyed by this kind of choppy market, then it’s better to just keep DCA-ing into the S&P 500.
Whenever the market starts to panic, people inevitably think of the same approach that Buffett has talked about again and again.
For most ordinary investors, holding a low-cost S&P 500 index fund long term is often more effective than trying to guess the top and the pullbacks every day.
Actually, since I first entered this market, the most I’ve talked with you all about has always been the Nasdaq and the S&P 500. Individual stocks may offer opportunities, but if you extend the time horizon, broad market indices are really the easiest to execute—and the easiest to stick with—for ordinary investors.
Recently, I saw another set of pretty interesting data, so I wanted to share it with you.
Since 1950, the S&P 500 has reached historical all-time highs about 1,325 times in total—an average of roughly 17 times per year.
So everyone needs to understand one thing first: making a new historical high does not equal the market top.
On the contrary, in a long-term upward market, it should keep setting new historical highs. If an index doesn’t make new highs for decades, that’s what should be worrying.
What’s even more interesting is that if you buy “unlucky” at exactly the moment the S&P 500 sets a new all-time high, the results aren’t as bad as people might imagine.
• Holding for 1 year: average return about +12.7%, profitable 73% of the time
• Holding for 3 years: average return about +33.4%, profitable 84% of the time
• Holding for 5 years: average return about +52.9%, profitable 88% of the time
• Holding for 10 years: average return about +172%, profitable 95% of the time
• Holding for 20 years: average return about +637%, profitable 100% of the time in the historical sample
In other words, if you invest $10,000 near a historical all-time high and truly hold it for 20 years, on average it could grow to about $73,700.
I find this data especially interesting because many investors’ biggest psychological barrier is:
“Since it’s already made a new high, if I buy now, am I just taking the bag?”
“What if I wait for a 10% pullback before buying?”
“It’s so expensive now—let’s wait for it to drop.”
But the historical data tells us that what truly drags long-term returns is often not “buying at a historical high,” but rather fear of new highs—holding cash and waiting for a perfect pullback.
And here’s the harshest part of the market: you think you’re waiting for a better entry point, but it might only give you a 5% pullback after it has already risen 10% or 20%.
So I’ve always felt that for long-term indices like the S&P 500 and the Nasdaq, you shouldn’t be too fixated on trying to call an absolute market top.
New all-time highs are simply the norm in a long-term bull market.
The real question isn’t: “Is today the highest point?”
It’s: “In 5 or 10 years, will the best batch of U.S. companies’ earnings keep growing?”
If the answer is still yes, then whether it just hit a new historical high in the short term may not be as important as we think.
Of course, this doesn’t mean you should always go all-in at once, nor does it mean the market won’t experience pullbacks of 20%, 30%, or even more. The approach that’s still more suitable for ordinary investors is to control position sizing, keep making regular contributions (DCA), and extend the time horizon.
Because the money you really earn is never just from the next week’s 5% fluctuation.
It’s the money from the next 10 or 20 years—earnings growth and repeated new highs for the index. So whenever the market panics, I remind myself again and again:
Don’t treat a long-term upward market as if it’s about to end just because of the words “historical all-time high.”
If everyone is truly getting annoyed by this kind of choppy market, then it’s better to just keep DCA-ing into the S&P 500.