
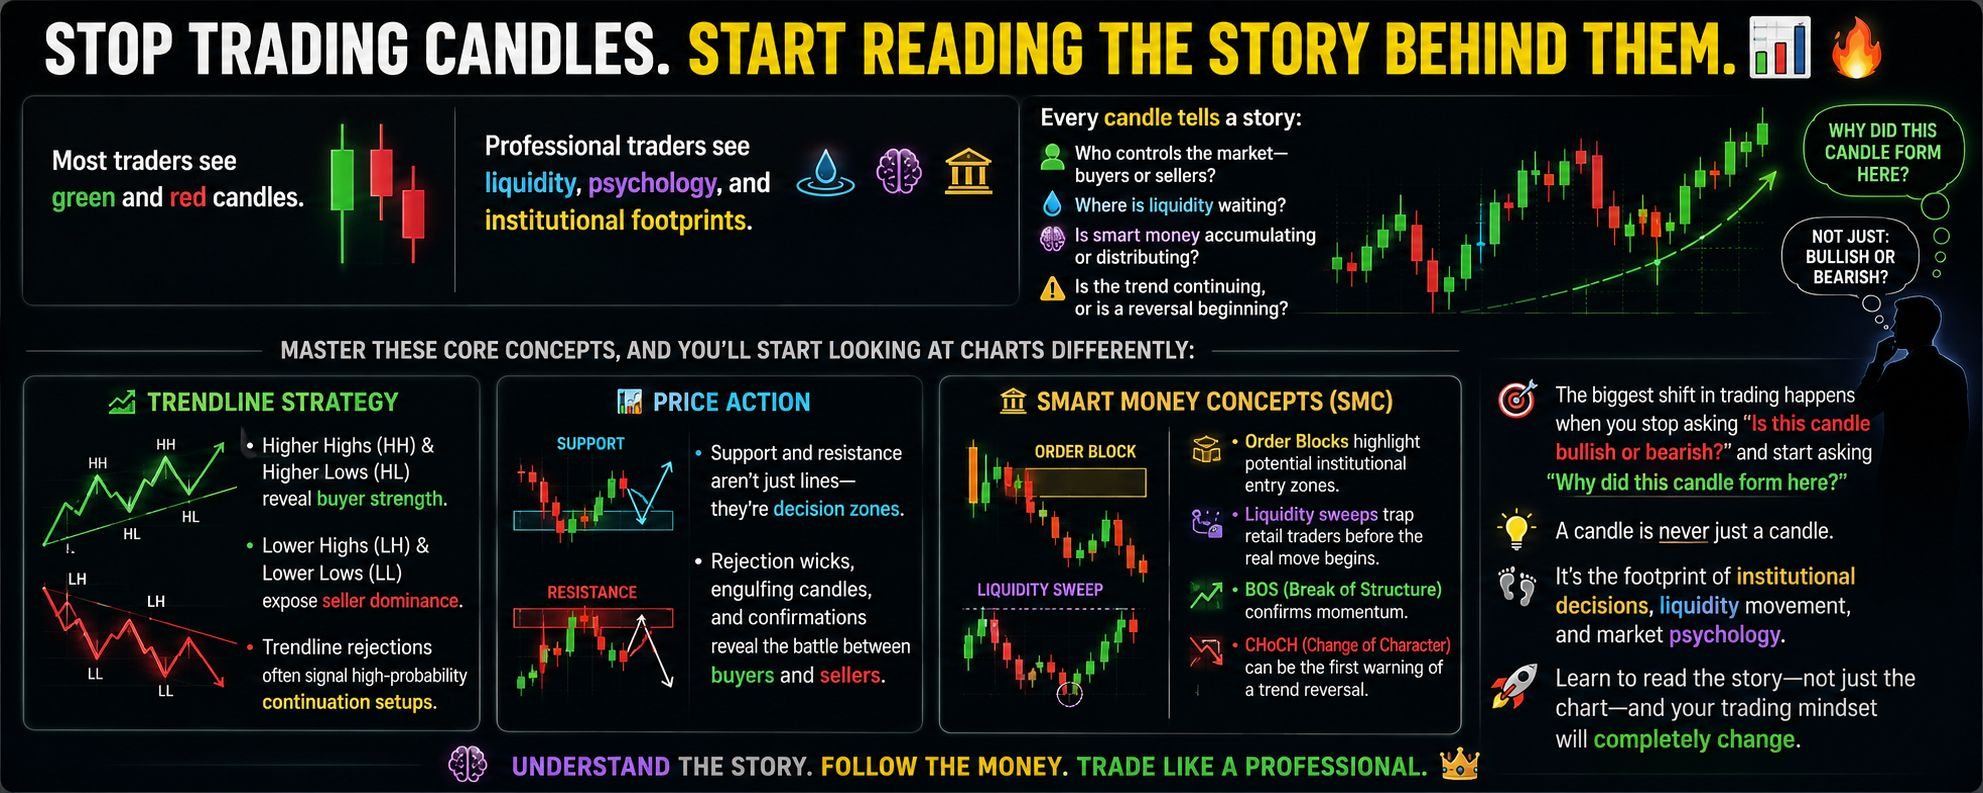

Most traders see green and red candles.
Professional traders see liquidity, psychology, and institutional footprints. 💡
Every candle tells a story:
🔹 Who controls the market—buyers or sellers?
🔹 Where is liquidity waiting?
🔹 Is smart money accumulating or distributing?
🔹 Is the trend continuing, or is a reversal beginning?
Master these core concepts, and you'll start looking at charts differently:
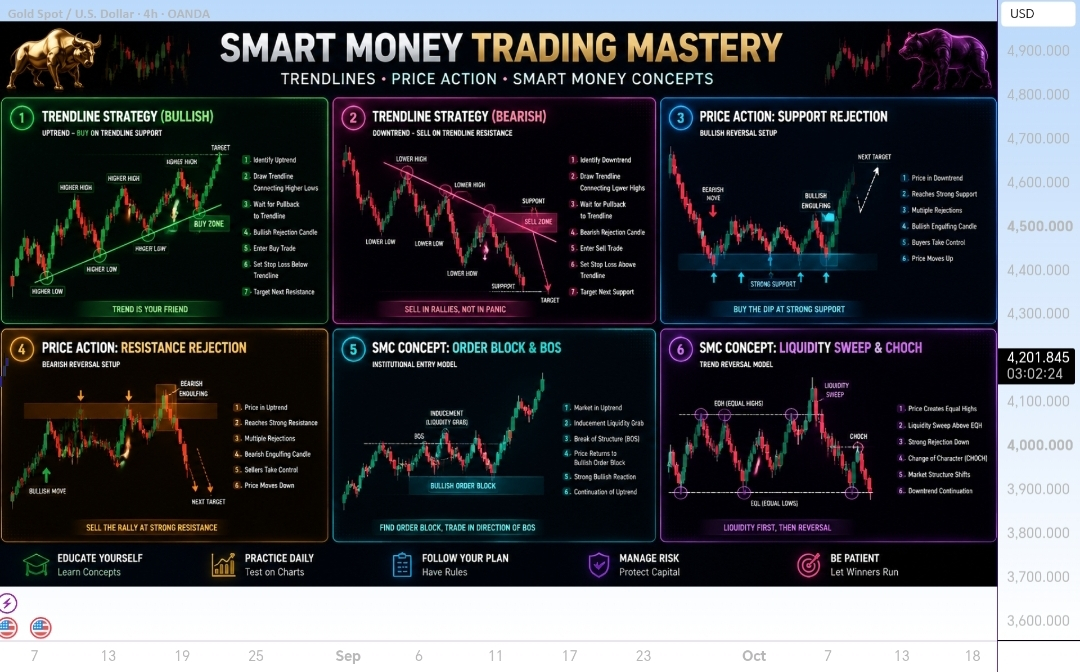
📈 Trendline Strategy
• Higher Highs (HH) & Higher Lows (HL) reveal buyer strength.
• Lower Highs (LH) & Lower Lows (LL) expose seller dominance.
• Trendline rejections often signal high-probability continuation setups.
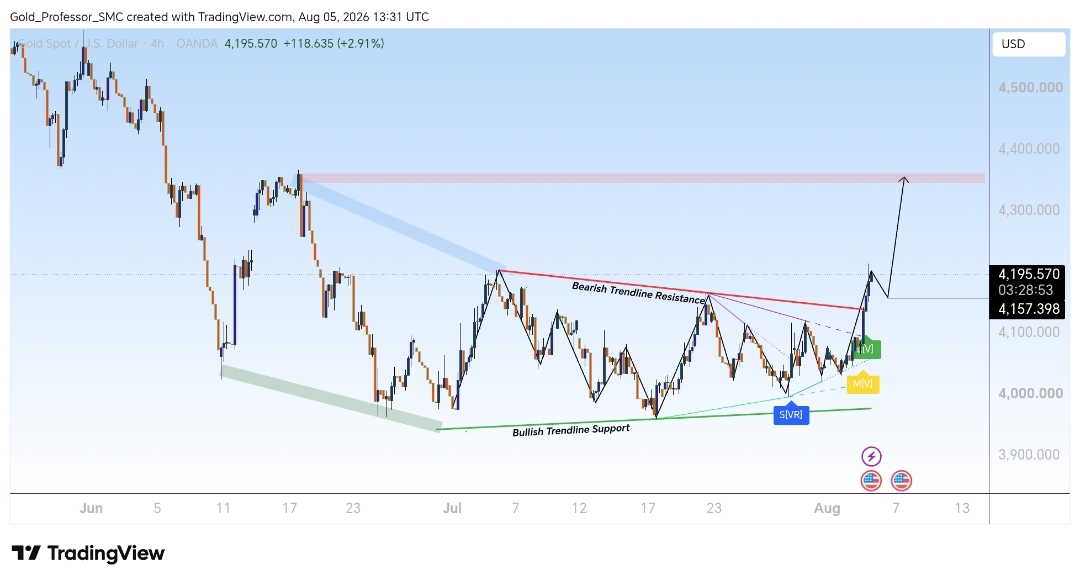
📊 Price Action
• Support and resistance aren't just lines—they're decision zones.
• Rejection wicks, engulfing candles, and confirmations reveal the battle between buyers and sellers.
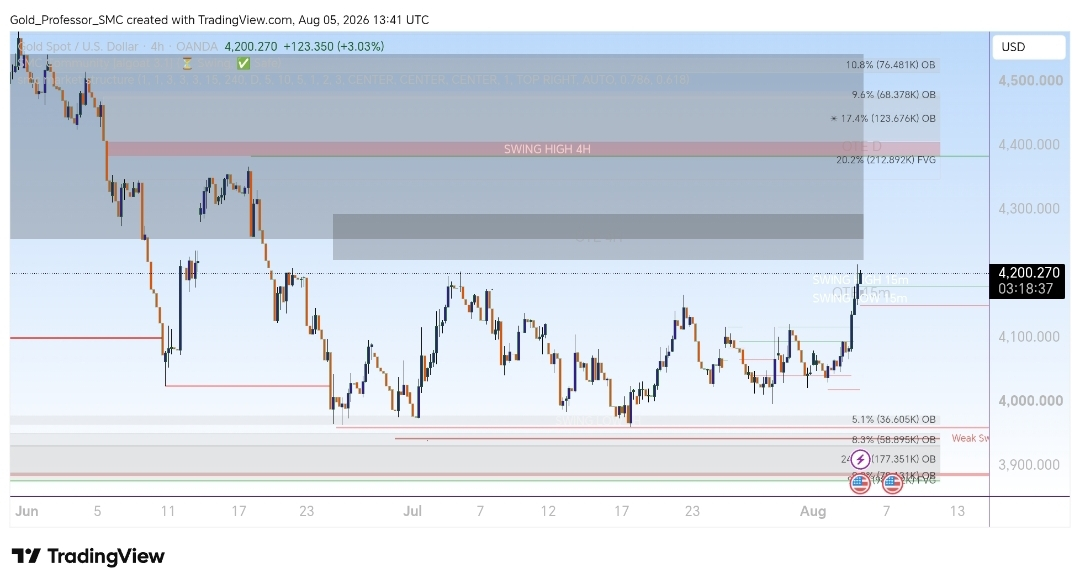
🏦 Smart Money Concepts (SMC)
• Order Blocks highlight potential institutional entry zones.
• Liquidity sweeps trap retail traders before the real move begins.
• BOS (Break of Structure) confirms momentum.
• CHoCH (Change of Character) can be the first warning of a trend reversal.
The biggest shift in trading happens when you stop asking "Is this candle bullish or bearish?" and start asking "Why did this candle form here?"
A candle is never just a candle.
It's the footprint of institutional decisions, liquidity movement, and market psychology. Learn to read the story—not just the chart—and your trading mindset will completely change. 🚀
💬 Which concept has improved your trading the most: Price Action, Trendlines, or Smart Money Concepts (SMC)? Share your answer below!
If you found this alpha valuable, hit that Like ❤️ button and Follow 🚀 for daily elite crypto insights!


#GOLD #XAU #xaut #educational_post $HFT $ACE #GoldBreaksOutFromJanuaryDowntrend