🔥 $dodox 15-minute chart warning: a high-level plunge—bulls’ last line of defense is in grave danger!
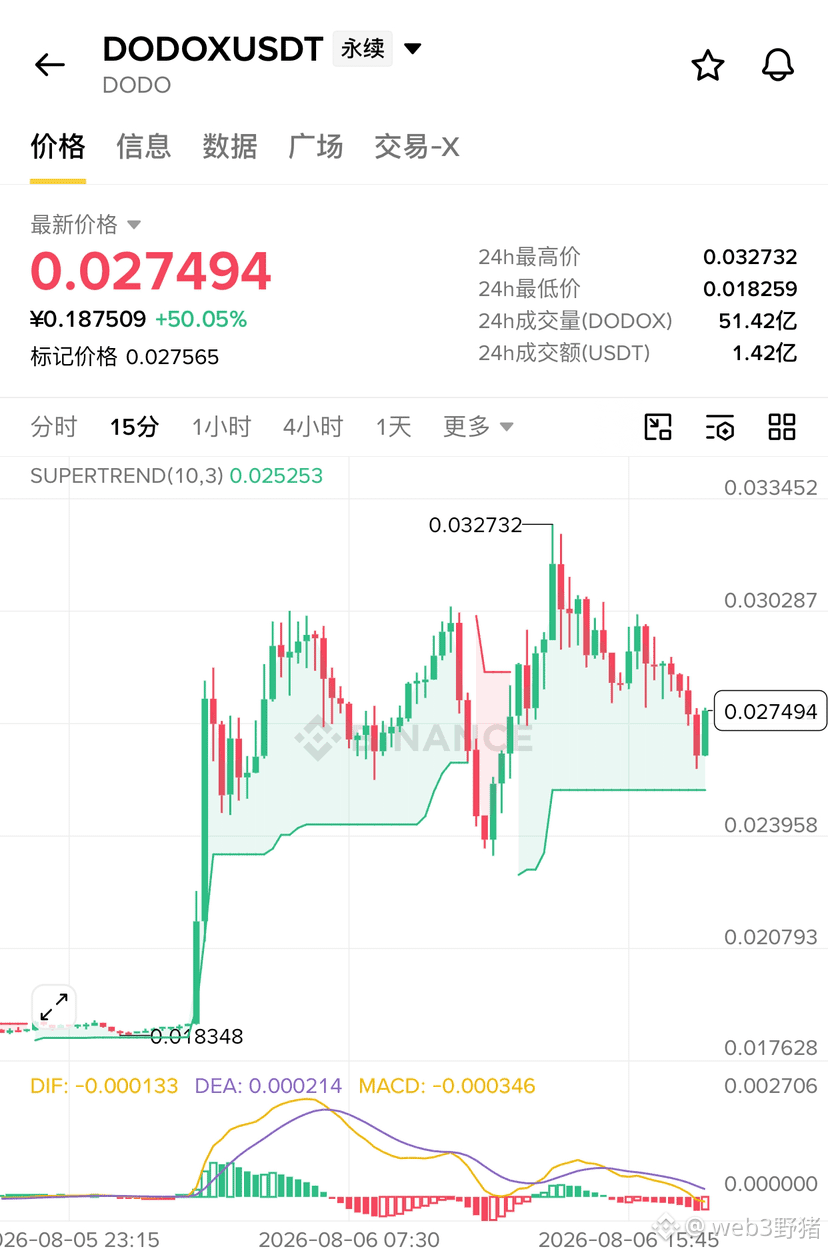
From the 0.0327 peak, it has been oscillating and then selling off all the way; it’s now trading at 0.0274, with the upward momentum taking a major hit. The market is already entering a critical turning-point node. Directly look at the key fatal data (based on the chart breakdown of image_5.png):
⚠️ Short-term bears run wild: pay attention to the 15-minute chart. MACD is already in a “sub-zero death cross” state (DIF has fallen below the zero line to -0.000133), and the red bearish momentum histogram continues to suppress price action. Clear signs of topping at higher levels are visible; short-term sell pressure is still being released continuously. There’s no definite signal of a bottoming and stabilization yet.
🛡️ Bulls’ lifeline: SuperTrend is still barely holding green, but the support at 0.0252 is facing extreme pressure! This is the bulls’ last line of defense on the short-term timeframe. Once it breaks down effectively, not only will profits be fully given back, but it will very likely trigger a fresh round of panic-driven liquidation cascades.
💡 Ironclad trading discipline:
💰 For long positions / those with a core holding: stop daydreaming—lock onto 0.0252. If price breaks that level with volume and cannot quickly reclaim it, you must unconditionally cut losses or significantly reduce exposure. Do not “hold and hope” while trapped in a high-level bag.
🚫 For those currently in cash (no position): this is absolutely not the time to blindly bottom-fish! Bear power hasn’t exhausted yet—don’t catch falling knives on the left side. Wait patiently for price to test the support near 0.0252. If it breaks down strongly, look for right-side opportunities to short. If it bottoms here and rebounds strongly, accompanied by a bullish divergence/bottom divergence signal, then consider a small-capacity short-term long attempt.
(The chart is extremely weak—risk control comes first! Remember to strictly set stop-losses and DYOR!)
👇👇👇 Click here to trade👇👇👇
From the 0.0327 peak, it has been oscillating and then selling off all the way; it’s now trading at 0.0274, with the upward momentum taking a major hit. The market is already entering a critical turning-point node. Directly look at the key fatal data (based on the chart breakdown of image_5.png):
⚠️ Short-term bears run wild: pay attention to the 15-minute chart. MACD is already in a “sub-zero death cross” state (DIF has fallen below the zero line to -0.000133), and the red bearish momentum histogram continues to suppress price action. Clear signs of topping at higher levels are visible; short-term sell pressure is still being released continuously. There’s no definite signal of a bottoming and stabilization yet.
🛡️ Bulls’ lifeline: SuperTrend is still barely holding green, but the support at 0.0252 is facing extreme pressure! This is the bulls’ last line of defense on the short-term timeframe. Once it breaks down effectively, not only will profits be fully given back, but it will very likely trigger a fresh round of panic-driven liquidation cascades.
💡 Ironclad trading discipline:
💰 For long positions / those with a core holding: stop daydreaming—lock onto 0.0252. If price breaks that level with volume and cannot quickly reclaim it, you must unconditionally cut losses or significantly reduce exposure. Do not “hold and hope” while trapped in a high-level bag.
🚫 For those currently in cash (no position): this is absolutely not the time to blindly bottom-fish! Bear power hasn’t exhausted yet—don’t catch falling knives on the left side. Wait patiently for price to test the support near 0.0252. If it breaks down strongly, look for right-side opportunities to short. If it bottoms here and rebounds strongly, accompanied by a bullish divergence/bottom divergence signal, then consider a small-capacity short-term long attempt.
(The chart is extremely weak—risk control comes first! Remember to strictly set stop-losses and DYOR!)
👇👇👇 Click here to trade👇👇👇