



In the previous article (August 1), we mentioned that whether from the perspective of time or space, simple DCA investing and holding spot coins, over the next 2–3 years, will most likely yield 2–3 times the returns. But some friends left comments in the background saying that within 2–3 years they only get 2–3 times the return—too little. And that even this kind of return isn’t as good as trading stocks.
Maybe. If, over the past 2–3 years, you’ve already earned overall returns through stock trading that exceed 3 times your principal, then it’s understandable that you wouldn’t be interested in the return rate I’m talking about.
Let’s do a simple data comparison using CAGR (compound annual growth rate):
A 2x return over 2 years—equivalent to an annualized 41%; a 2x return over 3 years—equivalent to an annualized 26%; and a 3x return over 3 years—equivalent to an annualized 44%. Meanwhile, the long-term average annualized return of the S&P 500 is about 8%–10%. If you truly can achieve a 3x return over 3 years, then in theory you’ve already become an extremely outstanding trader.
The key here is not only the return itself, but the return layered with a time dimension. In other words, if someone happens to catch the bull market at just the right time, then maybe a single day’s return could reach 2x, 3x, or even more. But if someone has invested continuously for 2 years or 3 years, and their overall return can still be maintained at 2–3x, then that alone is already enough to put them ahead of most people. A truly great trader isn’t the kind who can make 2x or more in a day or in a month; it’s the kind who can maintain a relatively high compound return over the long term.
For most regular people, the point of thinking about this question isn’t whether they can make 2x or 3x. It’s whether they can keep achieving positive compound returns through each cycle. In the past few years, I’ve seen too many people who could quite easily get so-called multiple-fold returns—maybe several times or even a dozen times—only to then give all the profits back to the market (along with the principal) through one or a few leveraged trades. As we summarized at the end of our previous article: to win, you must avoid losing; to get results faster, slow down.
Investing is a marathon, not a sprint.
Let’s get back to the crypto market topic. Recently, many people seem to be concerned about the bottom price. If we look at it from the time dimension and follow past patterns, then around October this year is the most likely time for the bottom. For example, in the 2018 bull market, the time from the historical high to the historical low lasted 363 days. In the 2022 bull market, that duration was 376 days. And for this current bull market, the historical high occurred on October 6, 2025 (at which time Bitcoin’s price was about $126,200). As of now (August 4), 303 days have already passed. If we make a simple cut-and-paste analogy, then the first half of October (early October) this year could be the window period for the bottom of this cycle.
Of course, what’s above is only a rule of thumb, not an absolute law or a hard iron principle. The patterns or data samples from the past two cycles only provide us with a perspective and a range of observation—they do not give us a specific and exact answer.
For the current stage of the market, overall there are basically four possible scenarios:
First, the bottom has already been completed in advance—i.e., the $58,035 level in June was the bottom of this cycle.
Second, the bottom may arrive earlier—meaning it could complete the bottoming before the public’s expected October. The corresponding price is hard to say; maybe over the next two months it will fall again below $58,000, and maybe it won’t.
Third, the bottom continues to arrive around October according to historical patterns, and the next two months will keep a choppy, ranging行情.
Fourth, the Fed continues to maintain a hawkish stance, causing the timing of the bottom to be pushed to the end of the year or the first quarter of next year. In that case, the previous low of $58,000 would most likely be broken—meaning the bottom may end up in the $44,000–$54,000 range that we speculated in our earlier article.
But regardless of which of the above possibilities it is, in terms of the “space” dimension, the maximum drawdown in the 2018 cycle was -84%, the maximum drawdown in the 2022 cycle was -77%, and the maximum drawdown before the low this year up to June 2025 was -54%. This drawdown magnitude is already within a relatively reasonable range. In terms of the “time” dimension, the market in the second half of this year (September?) may complete the trading of expectations for Fed rate hikes early. In addition, the spot ETF funds, the Treasury/treasury-like company in Wall Street, America’s strategic reserves, the CLARITY Act... all of these could become factors supporting the price structure of the bottom in this cycle.
If you prefer to focus on specific price changes, we can also provide two short-term reference (speculative) levels:
One is around $65,650. If the price can successfully rebound to above this level and hold it, and if the ETF capital is also in a continuous net-inflow state, then a new round of momentum could start. Bitcoin might first test the upper area around $72,000, and then attempt that important resistance level around $78,000 to $82,000.
One is around $62,350. If the price continues to fall below this level and can’t hold it, and if the ETF’s capital is also continuously in a net-outflow state, then it’s not impossible for the price to keep dropping—for example, continuing down to $61,000, $60,000, and even—there’s also no guarantee it won’t break below the previous low of $58,000.
As for the current stage, as long as no new black swan event occurs, the market should continue to wait—meaning it’s highly likely to keep ranging around the $62,000–$65,000 area. Besides macro factors such as expectations for Fed policy, short-term factors also include the developments in the Iranian situation ahead, the progress of the CLARITY Act, and the follow-up handling of the stolen Bitcoins from Coldcard, and so on.
Of course, all of the above is just short-term reference (speculation). We won’t consider doing short-term gambling, and we also don’t encourage everyone to trade frequently. And precisely because we still believe that a bull market will continue in the future, we will keep using the planned “real gold and silver” position sizing to test it. As for what others do now, that’s none of our business—we don’t care and we won’t pay attention. Your wallet is your own. DYOR.
......
1/ MicroStrategy (Strategy) has sold another $105 million worth of Bitcoin!
According to the latest publicly available information, between July 27 and August 2, 2026, Strategy sold 1,638 bitcoins at an average price of about $63,957 per coin, cashing out about $105 million (to be used to pay preferred stock dividends). As of now, Strategy still holds 842,138 bitcoins, with an average buy price of $75,653.
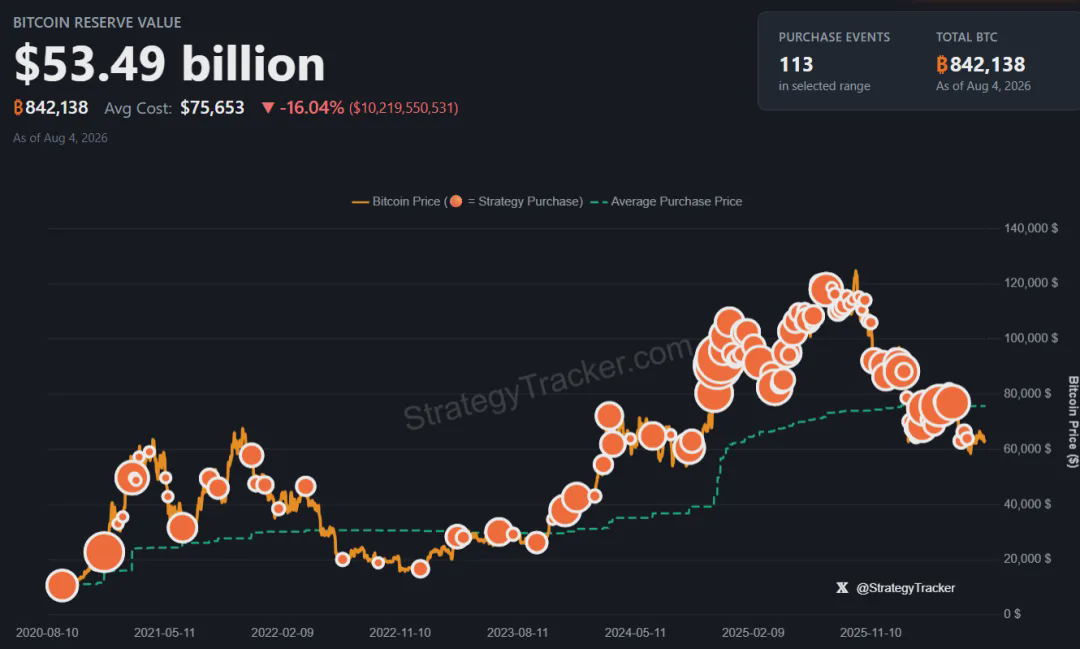
Back in May this year, Strategy—claiming it would never sell—quietly sold 32 bitcoins, which caused some panic in market sentiment at the time. But people seem to have gotten used to it now. Actually, it’s normal: institutions buy, so they also sell. That’s just a relatively normal corporate or market behavior. Retail investors can buy and sell freely—so why require that institutions only buy and never sell? Just take it in stride.
Many people now seem to still be waiting for Strategy to blow up like FTX did back then. I think that hope is not very likely—at least the probability of a blow-up this cycle is not high. However, as a Bitcoin price amplifier, Saylor—the boss of MicroStrategy—probably hopes most that Bitcoin returns strongly to a bull market again. After all, only if Bitcoin rallies significantly can his flywheel model keep spinning.
2/ They say Coldcard—the safest Bitcoin hardware wallet—is no longer safe?
Coldcard is known as one of the most trustworthy hardware wallets, but recently there was a relatively large-scale Bitcoin theft from that wallet. The hackers exploited a vulnerability in Coldcard to regenerate users’ private keys without needing to access any physical device for verification, allowing them to easily steal 2,055 bitcoins (about $130 million) from the Coldcard wallet.
It’s said the hackers carried out scanning attacks using AI technology. Although this incident resulted in losses of only over $100 million, the impact is not good—it seems to be telling people that AI technology is not becoming Crypto’s best friend; instead, it’s becoming Crypto’s biggest enemy.
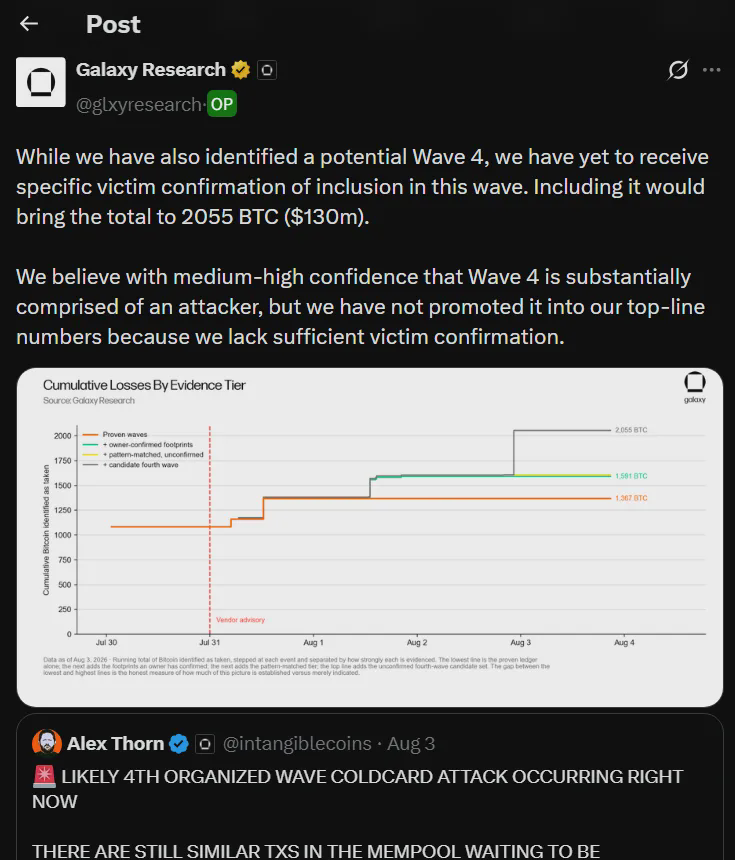
One is the safest shield (cryptography), and one is the sharpest spear (AI attack capability). Which is stronger? From a technical perspective, brute-forcing a Bitcoin private key is impossible. But the idea that hackers use AI technology to scan and exploit vulnerabilities in some wallets (projects) seems to be a more feasible attack trend.
This also serves as a reminder: don’t blindly trust any wallet. A hardware wallet from any brand may not necessarily be safer than an offline wallet you create using an Apple phone. Also, don’t concentrate large amounts of funds into a single wallet address. While managing your seed phrase properly, you should also store funds as diversified as possible. Or if your fund size isn’t that large, simply keep it on an exchange (BN or OK) rather than doing pointless back-and-forth tinkering. If you have the means, you can use a multisig wallet to further improve asset security. As for discussions about wallet usage and security, we’ve shared many times in our previous articles. Interested folks can search and review those past articles.
3/ Trump continues to cut losses and sell Bitcoin—cumulative losses already exceeding $300 million?
According to on-chain data monitoring, on August 2 the Trump Group (TMTG) transferred another 2,628 bitcoins (total value of about $165 million) to exchanges (we’ll treat this directly as selling on the exchange; otherwise it would just be staging a show to fool people and try to create panic sentiment).
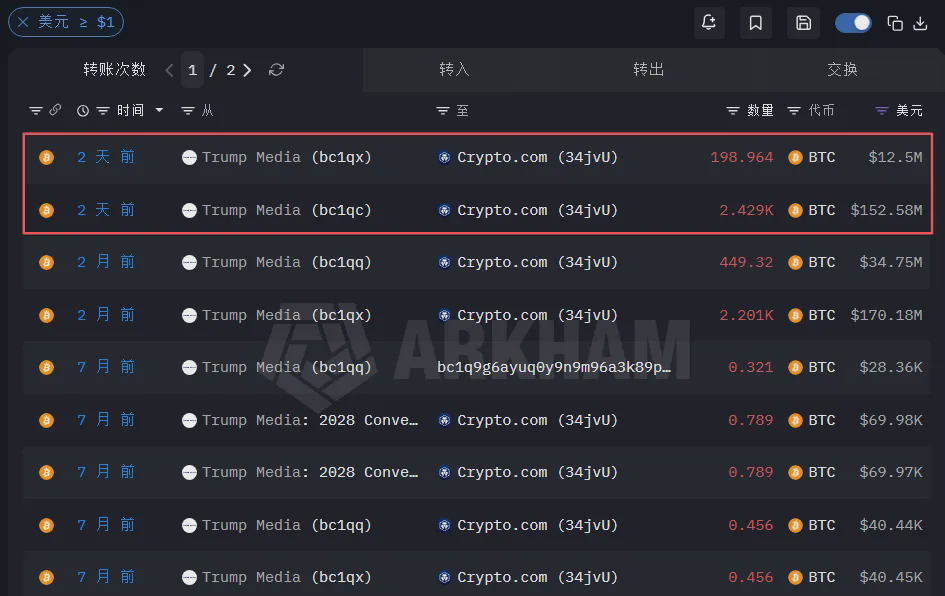
And by comparing some on-chain data, we can see that the Trump Group bought 11,542 bitcoins for a total price of about $1.368 billion between July and August 2025. The average buy price at the time was about $118,529—plainly, they bought right at the top.
Since this year began, the Trump Group has cumulatively sold (transferred to exchanges) 7,281 bitcoins, with an average selling price of about $74,860 and a total value of about $545 million. If we calculate based on the buy prices at the time, they have already generated a loss of $318 million (strictly speaking, it should be considered unrealized losses, and it can only be called a loss once all those bitcoins transferred to exchanges have actually been sold).
As of now, the Trump Group still has 4,261 bitcoins remaining in its holdings. Based on the current pace and speed, it’s estimated they’ll be basically done “cutting losses” in another few months. Of course, these are only the paper losses (or unrealized losses). According to the announcement materials, in the first year after the Trump family returned to the White House, they earned more than $1.4 billion in revenue from businesses related to crypto. So losing those $300 million on Bitcoin isn’t that big of a deal. Besides, who knows how much they may have profited through insider trading in the dark!
That’s what we’ll cover in this issue (20260804). The above is only my personal perspective and analysis, for the purposes of thought and sharing only, and does not constitute any investment advice.