BTC NEW WEEK: RECOVERY OR PRICE TRAP? 🌪️
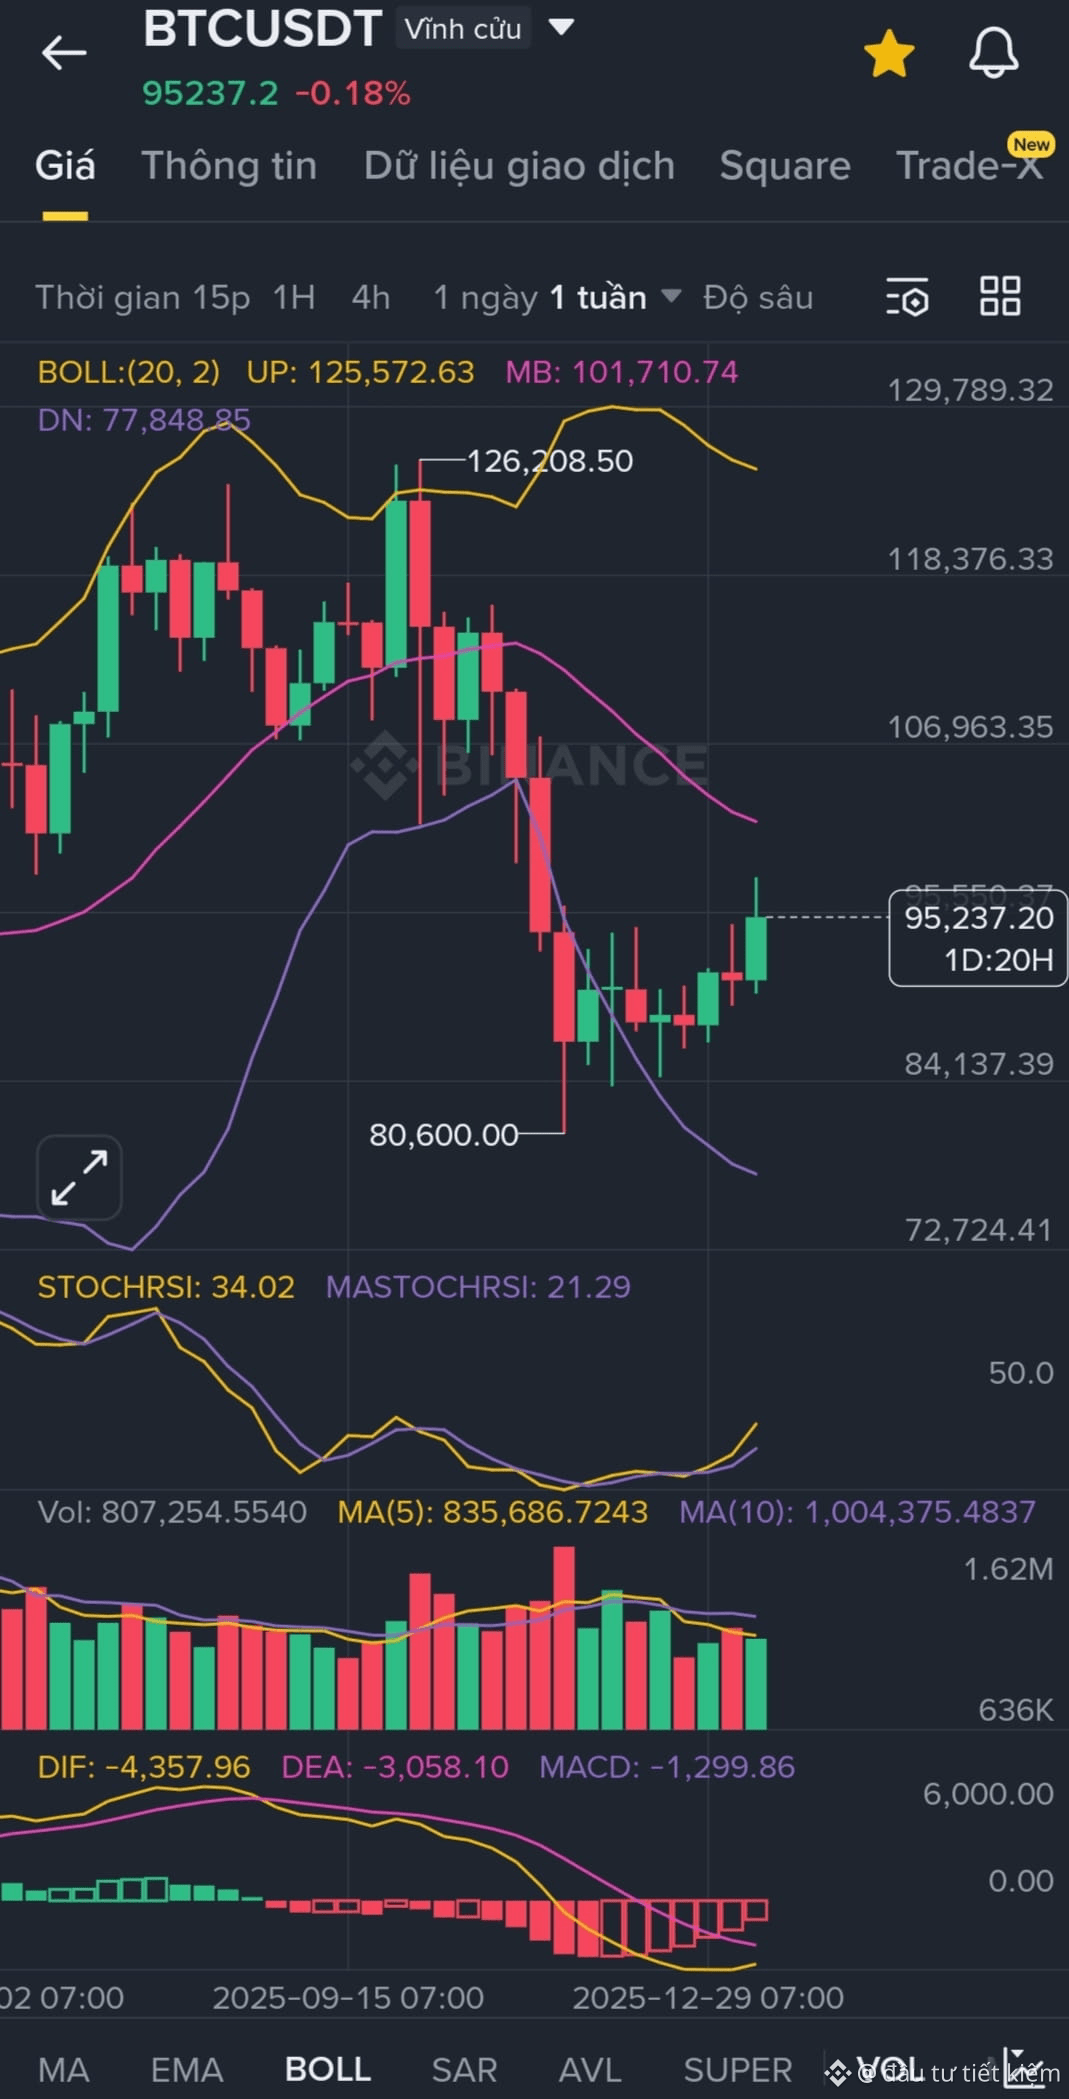
Looking at the weekly candlestick chart, what do we see?
✅ Good news: The "whip saw" around 80,600 USD has ended. The massive buying force has pushed the price back to the 95k range. This is the "Road Map" that I mentioned!
✅ Signal: The StochRSI indicator is beginning to rise from the bottom. The market is accumulating energy to break through the psychological threshold of 101,710 USD.
🎯 Strategy for next week:
No panic: Look at the red candles to accumulate, not to flee.
Target: Re-test the 100k - 110k range.
Action: My DCA robot is still "picking up grains" tirelessly. The more volatile the price, the larger the accumulated Coin amount.
Storms are only for those without a plan. For us, this is the harvest season! 🏔️🥋
#bitcoin #BTC #analysis s #DCA. #Crypto2026Trends
Looking at the weekly candlestick chart, what do we see?
✅ Good news: The "whip saw" around 80,600 USD has ended. The massive buying force has pushed the price back to the 95k range. This is the "Road Map" that I mentioned!
✅ Signal: The StochRSI indicator is beginning to rise from the bottom. The market is accumulating energy to break through the psychological threshold of 101,710 USD.
🎯 Strategy for next week:
No panic: Look at the red candles to accumulate, not to flee.
Target: Re-test the 100k - 110k range.
Action: My DCA robot is still "picking up grains" tirelessly. The more volatile the price, the larger the accumulated Coin amount.
Storms are only for those without a plan. For us, this is the harvest season! 🏔️🥋
#bitcoin #BTC #analysis s #DCA. #Crypto2026Trends