【 $BTC Four-Year Cycle Total Carving Series (43)】
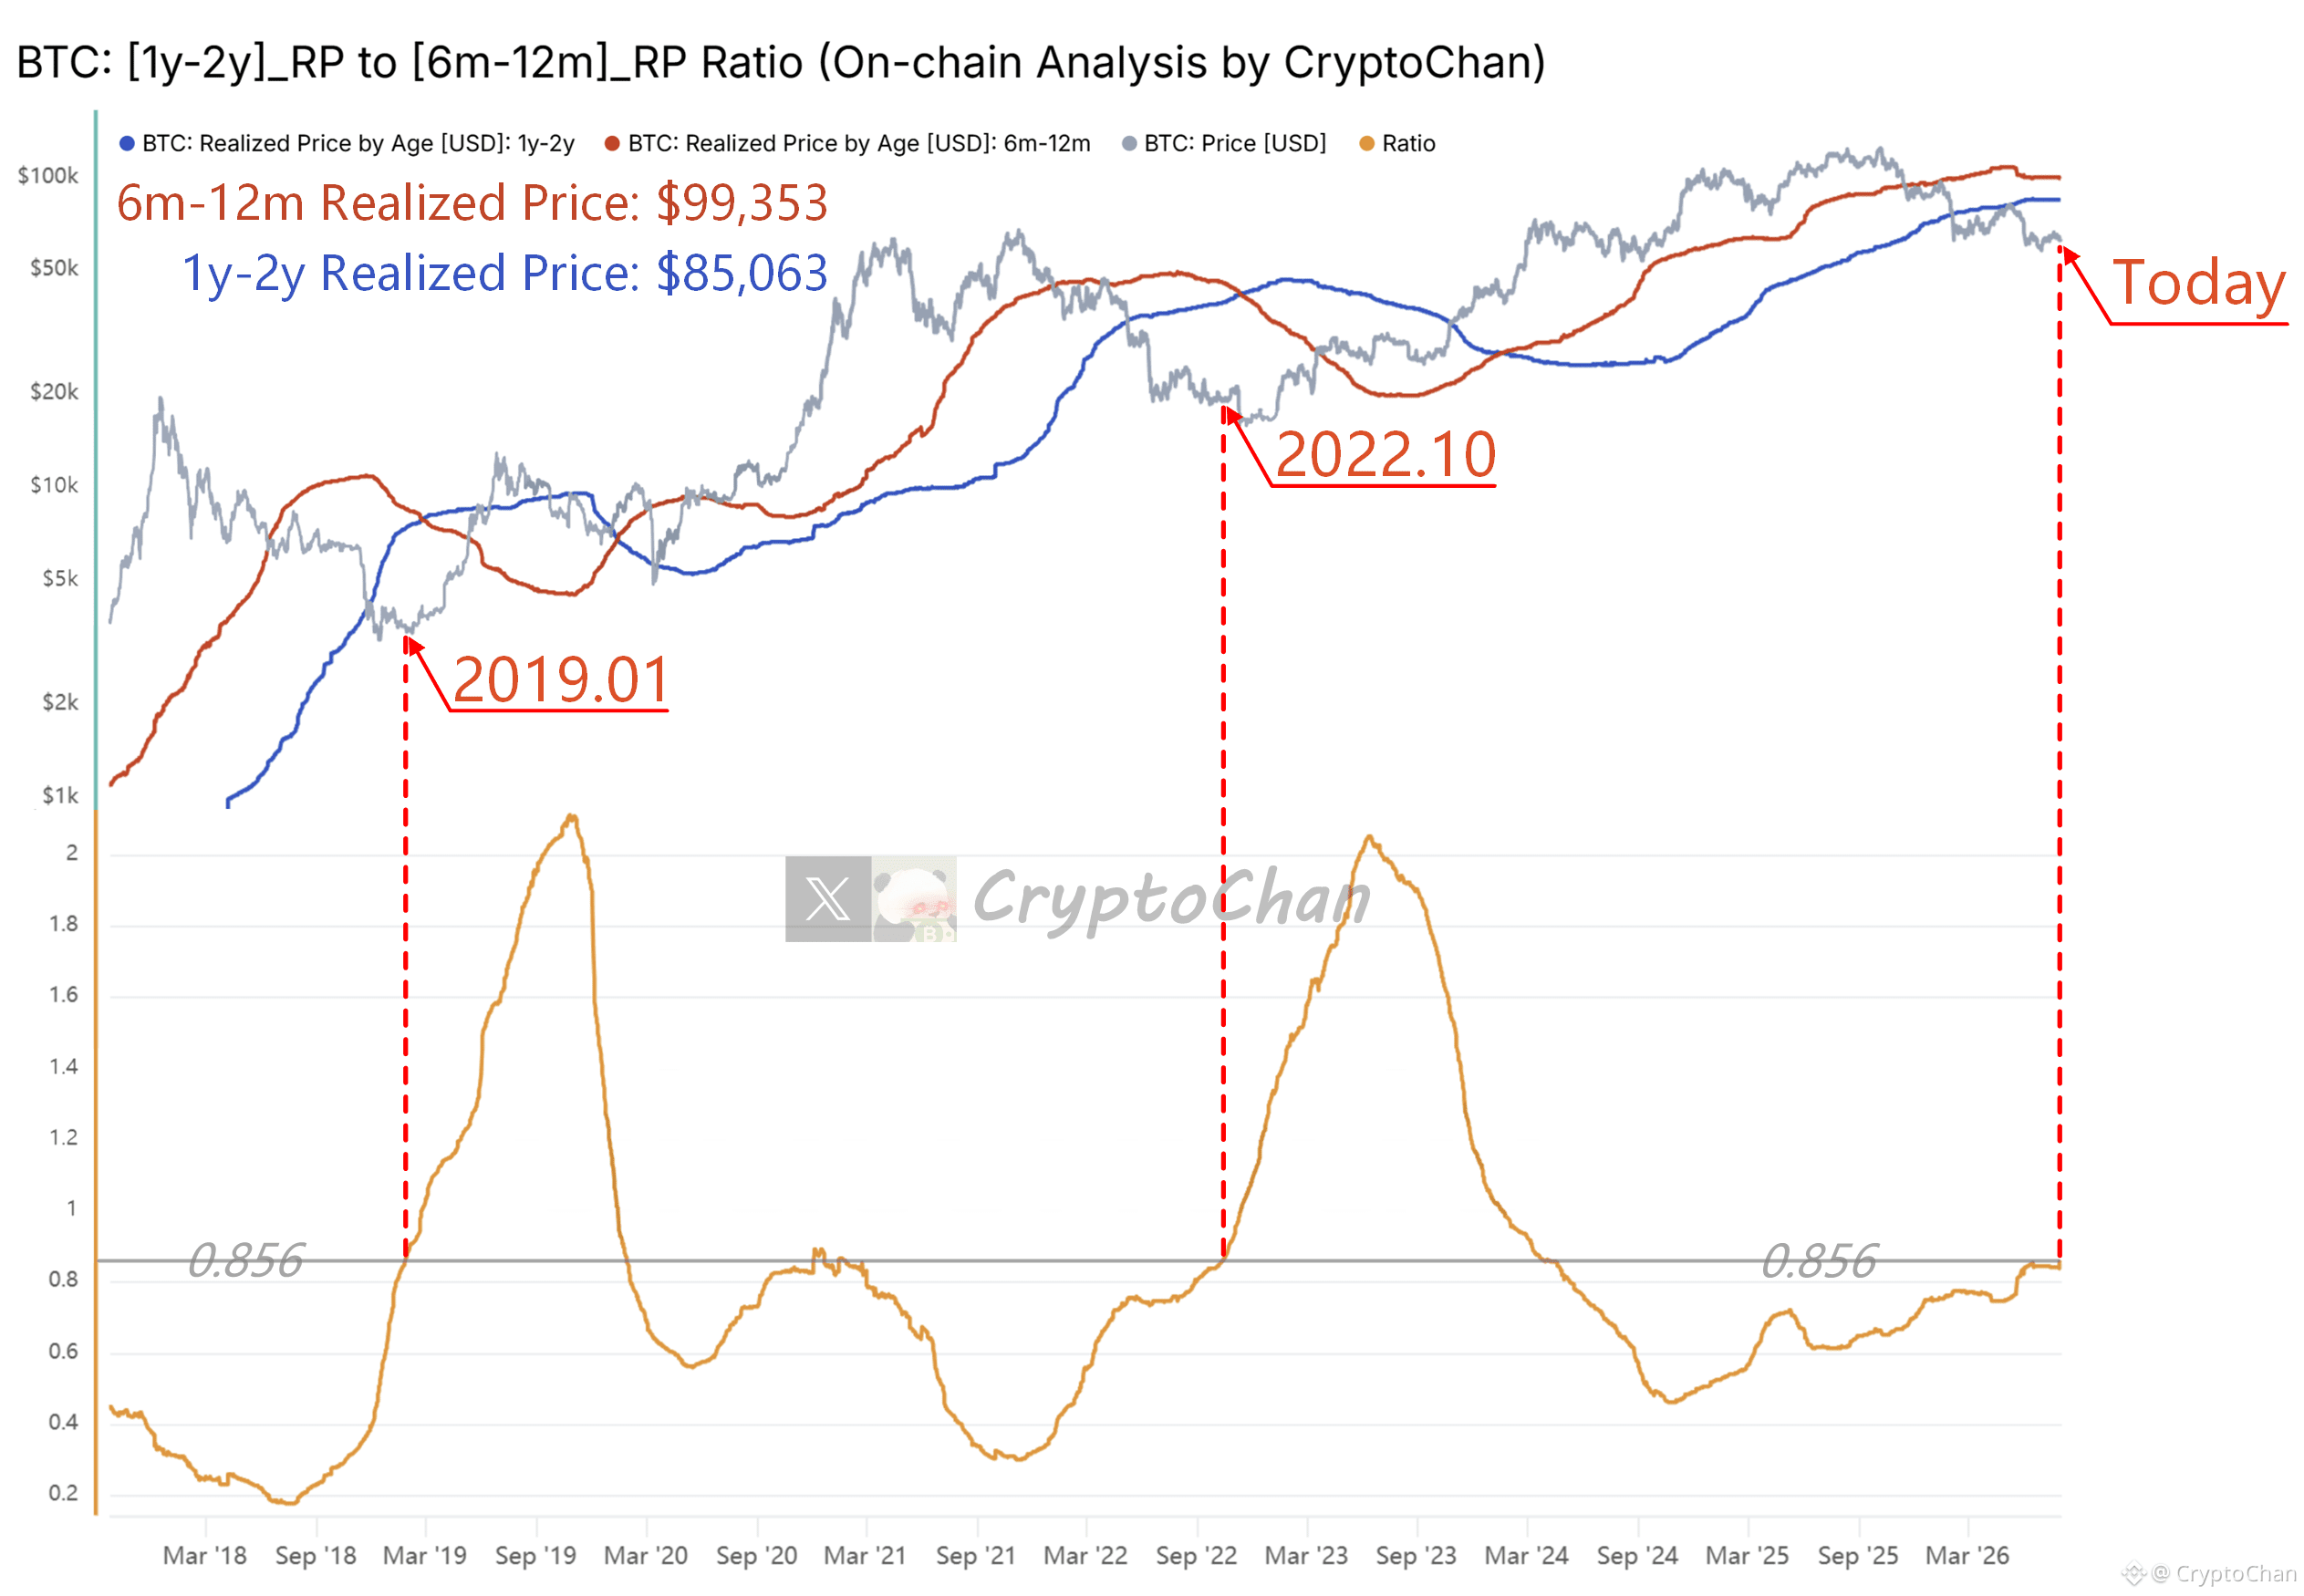
January 26, 2019: This metric rose to 0.856
October 10, 2022: This metric rose to 0.856
Current: This metric rose to 0.856
┌─ On-Chain Data Details ─┐
The gray line at the top of the chart is the BTC price; the red line is the average on-chain cost basis of coins held for 6–12 months; the blue line is the average on-chain cost basis of coins held for 1–2 years. The indicator at the bottom of the chart is the ratio of the blue line to the red line
January 26, 2019: This metric rose to 0.856
October 10, 2022: This metric rose to 0.856
Current: This metric rose to 0.856
┌─ On-Chain Data Details ─┐
The gray line at the top of the chart is the BTC price; the red line is the average on-chain cost basis of coins held for 6–12 months; the blue line is the average on-chain cost basis of coins held for 1–2 years. The indicator at the bottom of the chart is the ratio of the blue line to the red line