

1) Overall assessment:
The FOMC has concluded, but the market has not moved toward a sustained single-direction trend. Around the interest rate decision, BTC, ETH, and SOL all saw a rapid surge, a pullback, and then another rebound, before ultimately returning to the middle of their respective 24-hour ranges.
A more accurate description of the current market regime is: wide-ranging consolidation after the event-driven shock, combined with low-liquidity trading as the market prepares for the next round of macro data releases.
Binance’s public data shows that over the past 24 hours, BTC rose by about 0.35%, ETH by about 0.22%, and SOL by about 0.45%. On the surface, all three have maintained modest gains, but their latest prices are each hovering near the middle of their respective 24-hour highs and lows:
BTC range 63,234.00—64,715.90, current price about 63,994;
ETH range 1,870.26—1,935.00, current price about 1,901.64;
SOL range 72.26—74.50, current price about 73.49.
All three are in the middle 40% of the effective range, directly triggering V2’s no-trade/open-ban condition. At the current location, going long is too close to pressure, and shorting is not far enough from support, making the post-cost risk-reward unreasonable.
The overview of the Binance market shows crypto total market cap is about $2.18T, with little change. Total market trading value is about $65.1B, up about 2.61%. The Fear & Greed Index is 36, still in the fear zone. Trading activity has not completely disappeared, but the BTC, ETH, and SOL volumes in the latest full hour are clearly lower than the volume surge level during FOMC, indicating that post-event chasing price willingness is declining.
The derivatives structure also does not provide a consistent direction.
BTC open interest rebounded from around the prior snapshot by about 103,100 units to about 104,700 units (+~1.5%). SOL open interest rose from around 8.32M to about 8.42M (+~1.2%); ETH open interest basically unchanged. Price has not clearly broken out of the range. BTC and SOL leverage positions have increased again, meaning there is a possibility that both sides of the range could be cleared again.
The current funding rate is still a mild positive:
BTC about +0.0096%;
ETH about +0.0076%;
SOL about +0.0078%.
Funding rate has not reached extreme crowding, but the long/short ratios of all three accounts are skewed long. The latest 1-hour long/short ratios across the whole market accounts are approximately:
BTC: 1.49;
ETH: 2.15;
SOL: 2.56.
SOL large-holder accounts have a long/short ratio of about 2.90, the most crowded at the account level among the three instruments. But the large-holder long/short ratio is only about 1.66, meaning many accounts are net long without being supported by actual positions of equal strength.
On active execution: the latest full 1-hour BTC Taker buy/sell ratio is about 1.15; ETH about 0.81; SOL about 1.03. BTC’s active buying is slightly dominant; ETH’s active selling is more obvious; SOL is close to balanced. In the last few 5-minute bars, BTC and ETH active selling increased again while SOL’s buying temporarily recovered, creating a divergence that prevents synchronized confirmation across all three instruments.
The mark prices are all slightly below the index price; perps are in a mild discount and there is no clear positive basis chasing. Binance spot trading pairs are all normal. In the latest check, spot price is slightly higher than perps, but the data cannot be perfectly synchronized second-by-second. So it is only auxiliary information that “spot is not clearly weaker than perps,” not an independent trigger condition.
A horizontal comparison:
After FOMC, BTC probed down to 63,234; its recovery strength is stronger than ETH’s;
After ETH fell back from 1,935, it dropped again to around 1,900, making it the weakest among the current short-term moves;
SOL still has the largest volatility and upside/downside elasticity, but long positions are crowded at the account level. It is not suitable to chase longs near 73.5, nor to short directly in the middle of the range.
The Fed has maintained interest rates unchanged, but the meeting disagreement and the subsequent policy path are still unclear. The U.S. Dollar Index stays around 100.89 during the Asian session, while long-term U.S. Treasury yields remain high. At the same time, the situation in the Middle East continues to increase uncertainty around energy and inflation. The current macro environment has not automatically turned into a risk-asset positive just because “no rate hike.”
The next definite major risk is the initial Q2 GDP for the U.S., June personal income, personal spending, and PCE data, to be released at 12:30 UTC on July 30, 2026. According to the plan rules, since the event is less than two hours away after 10:30 UTC, stop establishing any new positions. After the data is released, wait at least 30 minutes and then reassess the price structure.
Data snapshot: 05:02 on July 30, 2026, UTC+0
End time for complete derivatives cycle: 04:00 on July 30, 2026, UTC+0
Plan validity period: in principle, this plan only applies until 10:30 UTC on July 30, 2026. After 10:30 UTC, all three instruments stop establishing new positions. After GDP and PCE are released, wait until at least 13:00 UTC, and then, based on the new 1-hour structure, re-formulate the plan. If BTC breaks effectively above 64,780 or breaks below 63,170 early, ETH breaks above 1,937 or breaks below 1,868, SOL breaks above 74.58 or breaks below 72.18—then the relevant instruments must recalculate levels.
Executable instruments: none.
Instruments to only observe: BTCUSDT, ETHUSDT, SOLUSDT.
Prohibited trading instruments: none currently. After 10:30 UTC, all three instruments automatically become prohibited from opening new positions.
No executable instruments today.
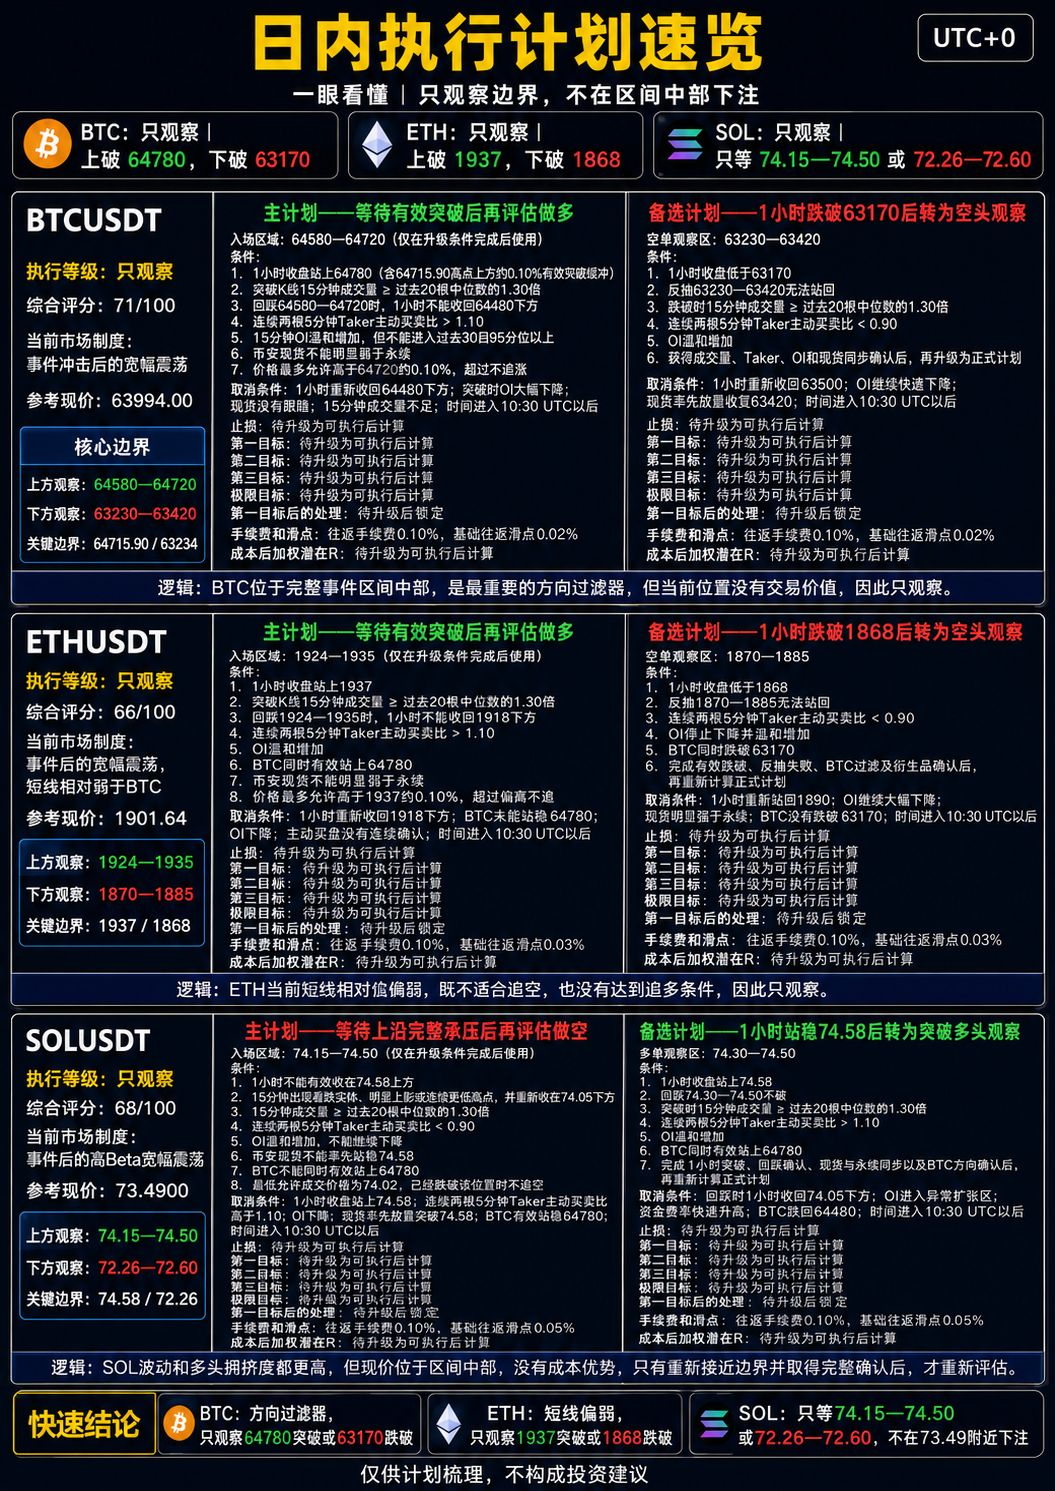
2. Post-mortem of the previous article:
Previous article data snapshot: 02:48 on July 29, 2026, UTC+0
End time of this replay: 05:02 on July 30, 2026, UTC+0
Replay range: 02:48 on July 29, 2026 to 05:02 on July 30, 2026, UTC+0
Replay 대상: the condition plans for BTCUSDT, ETHUSDT, and SOLUSDT in the previous article.
The previous assessment was that the market is in a range repair phase after rapid deleveraging, and it required all new positions to be completed before 16:00 UTC. Trading stops after 16:00 UTC to avoid directly crossing the FOMC decision at 18:00 UTC.
In the first half of the actual move, the rebound continued. BTC rose to 64,715.90, ETH to around 1,927, and SOL to 74.30. Before FOMC, there was another pullback. After 18:00 UTC, all three showed intense two-way volatility simultaneously: BTC was resisted around 64,703 and then fell to 63,234; ETH dropped from 1,935 to 1,870.26; SOL fell from 74.50 to 72.26; then a clear rebound occurred again.
The most effective judgment from the previous post is to strictly set the 16:00 UTC expiry time and ensure no ordinary technical plan crosses over FOMC. If you ignore the expiry time, any direction could be pushed first and then cleared in the opposite direction.
The biggest execution issue is that BTC and ETH are at the “only observing” level. Although price partly satisfies upgrade conditions, the plan did not lock the official stop loss and target in advance. Therefore, we can only evaluate the observation conditions and cannot infer that it became a complete trade.
BTCUSDT post-mortem:
Actual highest price: 64,715.90
Actual lowest price: 63,234.00
Main price path:
After the last release, BTC first pulled back to around 63,569, then rallied with increased volume from 06:00—10:00 UTC, breaking 64,240 and topping at 64,715.90. After that, price fell back. During FOMC, it again challenged around 64,703, then quickly dropped, with the low reaching 63,234. It then rebounded to around 64,393. Currently, it has moved back to around 64,000.
Main plan status:
The previous main plan was “only observe before evaluating a long after the breakout.” It required a 1-hour close above 64,240 and a pullback to 64,090—64,200 to form follow-through.
In the 1-hour candles from 06:00—07:00 UTC, BTC closed at 64,407.70, satisfying an effective breakout on the price level. After that, price also pulled back into the related area, and open interest plus hourly active buying increased at one point.
However, the execution level of the previous post is still “only observing.” It has not locked an official stop loss, target, or risk ratio, and there is also not enough information from existing complete-cycle data to confirm that after the pullback, two consecutive 5-minute Taker buy/sell ratios have fully met the requirements.
So it can only be recognized as: some upgrade conditions are partially met, but no executable plan with lock-in was formed.
Alternative plan status:
Alternative-direction requirements: after breaking below 63,550 for 1 hour, the rebound to 63,620—63,720 must fail. A valid breakdown mainly occurs after the previous 16:00 UTC expiry time, so it cannot be considered as triggering the previous plan.
Reached the target level: not applicable; no official lock-in of the target.
Stop loss or invalidation status: the plan expires on time at 16:00 UTC; the post-FOMC decline is not within the scope of the previous valid plan.
Should we continue using, adjust, or cancel the previous main plan today? Cancel the direct use of 64,240 as the long confirmation level.
Should we continue using, adjust, or cancel the alternative plan from the previous post today? Cancel the direct use of 63,550 as the short confirmation level.
Validity of the old position:
64,240 and 63,550 can still be used as pivots inside the range, but they have been crossed multiple times and are no longer suitable as standalone entry criteria. 64,715.90 and 63,234 become the new external boundaries.
Clear conclusion: part of the original judgment remains valid, and the observation upgrade conditions were partially met, but no official executable plan was formed. Strict event invalidation time effectively controlled risk.
ETHUSDT post-mortem:
Actual highest price: 1,935.00
Actual lowest price: 1,870.26
Main price path:
ETH first rebounded from around 1,890 to 1,926.50, then pulled back. At the time FOMC was released, price spiked up to as high as 1,935, but that hour ultimately closed at 1,919.59. Afterwards, it rapidly fell to 1,870.26. After the low formed, ETH rebounded to 1,921.91, and now it has returned to around 1,900 again.
Main plan status:
The previous main plan required a valid 1-hour close above 1,931, then a pullback to 1,921—1,929 for confirmation.
ETH touched as high as 1,935, but the 1-hour chart did not close above 1,931, so it can only be recognized as a wick touch—not a valid breakout.
Alternative plan status:
Alternative plan requirements: after a 1-hour break below 1,901, the rebound must fail; meanwhile BTC must break below 63,550. The relevant price conditions mainly appear after the 16:00 UTC expiry time and do not count as triggering the previous plan.
Reached the target level: not applicable. Neither the main plan nor the alternative plan triggered fully.
Stop loss or invalidation status: the plan expires at 16:00 UTC; the 1,870 low after FOMC cannot be counted as performance for the previous alternative plan.
Should we continue using, adjust, or cancel the previous main plan today? Adjust. There is still 1,931 pressure, but the new valid breakout location moves up to 1,937.
Should we continue using, adjust, or cancel the previous alternative plan today? Adjust. 1,901 has been crossed multiple times; the new downside confirmation level moves to 1,868.
Validity of the old position:
1,921—1,935 remains the upper supply zone; 1,901 only retains short-term pivot meaning; 1,870.26 becomes the new lower boundary of the range.
Clear conclusion: the market did not trigger the previous full trading conditions. The rule of waiting for a valid 1-hour close prevents misreading the 1,935 wick as a breakout.
SOLUSDT post-mortem:
Actual highest price: 74.50
Actual lowest price: 72.26
Main price path:
After the previous release, SOL rebounded into the short zone 74.15—74.45, topping first at 74.30. Then price pulled back somewhat, but BTC had already effectively held above 64,240. During FOMC, SOL again surged to 74.50, then rapidly fell to 72.26 and rebounded to 74.18. It is now back around 73.5.
Main plan status:
The previous SOL was the only instrument marked as “executable,” but the plan also stated: if BTC effectively holds above 64,240, the SOL short plan is cancelled.
BTC completed an effective 1-hour breakout above 64,240 before and around the time SOL entered the short zone, so the BTC filter condition for SOL shorts became invalid. Even though SOL later indeed pulled back, you cannot infer that the short plan was triggered based on the outcome.
Also, the active sell orders and OI at the entry time did not simultaneously meet the full criteria.
Main plan conclusion: cancelled due to the BTC-direction filter conditions being triggered.
Alternative plan status:
Alternative long plan requirement: close effectively above 74.63 within 1 hour. SOL’s highest was only 74.50, so an effective breakout was not achieved; it was not triggered.
Reached the target level: not applicable. The main plan was cancelled early; the alternative plan was not triggered.
Stop loss or invalidation status: no valid entry formed; the plan auto-expires after 16:00 UTC.
Should we continue using, adjust, or cancel the previous main plan today? Cancel the direct use of the 74.15—74.45 short plan. That region has been tested multiple times and needs reconfirmation.
Should we continue using, adjust, or cancel the previous alternative plan today? Adjust. 74.58 can still be used as the new valid breakout standard, but it must be combined with BTC breakout and spot confirmation.
Validity of the old position:
74.15—74.50 is still the upper observation zone, but you cannot short directly just by reaching the price; 72.26 becomes the new lower boundary.
Clear conclusion: the market did not trigger the valid trading conditions. Direction later rolled over, but the main plan was cancelled early based on the BTC filter condition that was explicitly written at the time; its meaning cannot be modified after the fact.
The most effective part of this replay is not predicting which way price will go; it’s that no ordinary technical plan is allowed to cross over FOMC.
The mistake you need to avoid today is rushing to choose a direction just because there is dramatic post-event volatility. The three instruments have returned to the middle of the range; the most reasonable action is still to wait for the boundaries rather than increase trading frequency.
3. Trading plans for the three coins:
I. BTCUSDT plan (currently in the middle of the event range; only observe a break above 64,780 or a drop below 63,170)
Execution level: only observing
Composite score: 71/100
Current market regime: wide-range consolidation after the event impact
Reference current price: 63,994.00
Compared with the main changes from the previous post:
The direction changed from waiting for a breakout above 64,175 to waiting for the full event-range to select the direction;
Upside confirmation moved from 64,240 to 64,780;
Lower confirmation moved from 63,550 down to 63,170;
64,240 and 63,550 have become pivots inside the range; stop using them as direct entry references.
64,715.90 and 63,234 become the new primary boundaries.
Long/short zones: observe 64,580—64,720 on the upside; observe 63,230—63,420 on the downside.
Main plan—wait for a valid breakout, then reassess before going long:
Entry zone: 64,580—64,720, only used after the upgrade conditions are completed.
Entry conditions:
BTC must print a 1-hour close above 64,780. This level includes an effective breakout buffer about 0.10% above the 64,715.90 high.
The 15-minute trading volume of the breakout candle must reach 1.30x the median of the previous 20 bars; then, on the pullback to 64,580—64,720, there must not be a 1-hour close falling back below 64,480.
On the rebound, you need two consecutive 5-minute Taker buy/sell ratios above 1.10; 15-minute OI increases moderately and must not enter above the 95th percentile of the past 30 days; Binance spot cannot be noticeably weaker than perps.
After conditions are met, the price is allowed to be at most about 0.10% above 64,720. If it exceeds the maximum deviation, we do not chase.
Cancellation conditions:
The 1-hour chart reclaims above 64,480;
At the breakout, OI drops significantly;
Spot did not follow;
The 15-minute trading volume is insufficient;
Time is after 10:30 UTC.
Stop loss: calculate once upgraded to an executable state, based on the pullback low and 15-minute ATR.
Take profit: take profit in batches
First target: calculate once upgraded to an executable state.
Second target: calculate once upgraded to an executable state.
Third target: calculate once upgraded to an executable state.
Extreme target: calculate once upgraded to an executable state.
Handling after the first target: lock after upgrading.
Trading fee and slippage assumptions: round-trip fee 0.10%, base round-trip slippage 0.02%.
Potential R after weighting by cost: calculate once upgraded to an executable state.
Alternative plan—after the 1-hour break below 63,170, switch to short observation:
BTC needs to print a 1-hour close below 63,170, then attempt a rebound to 63,230—63,420 that cannot reclaim. When it breaks, the 15-minute trading volume must reach 1.30x of the median of the previous 20 bars; additionally, for two consecutive 5-minute bars, the Taker buy/sell ratio must be below 0.90, and OI must increase moderately—only then does it indicate new shorts are entering.
Long-entry zone or short-entry zone: observe shorts at 63,230—63,420.
Entry conditions: complete a valid 1-hour breakdown, a failed rebound, and obtain synchronized confirmation from volume, Taker, OI, and spot—then upgrade to an official plan.
Cancellation conditions:
The 1-hour chart reclaims above 63,500;
OI continues to fall rapidly;
Spot leads with volume and regains 63,420;
Time is after 10:30 UTC.
Stop loss: calculate once upgraded to an executable state.
Take profit: take profit in batches
First target: calculate once upgraded to an executable state.
Second target: calculate once upgraded to an executable state.
Third target: calculate once upgraded to an executable state.
Extreme target: calculate once upgraded to an executable state.
Handling after the first target: lock after upgrading.
Trading fee and slippage assumptions: round-trip fee 0.10%, base round-trip slippage 0.02%.
Potential R after weighting by cost: calculate once upgraded to an executable state.
Analysis logic:
BTC is currently not close enough to either the 64,715 resistance or the 63,234 support; it is in the middle of the full event range. Open interest is up about 1.5% versus the previous snapshot, but price has basically no net change, indicating leverage is entering again without corresponding direction confirmation.
The latest full 1-hour Taker buy/sell ratio is about 1.15. Short-term it is slightly skewed toward active buying, but the last two 5-minute bars have dropped to around 0.70 again, failing to meet continuous long confirmation. Funding rate is mildly positive. The account long/short ratio is about 1.49. The large-holder long/short ratio is about 1.56. Long positions are not scarce.
Mark price is about 0.04% below index price. Perps are at a mild discount; there is no obvious premium for chasing. Spot trading pairs have normal liquidity, but one-time checks are not enough to prove sustained follow-through.
The 15-minute and 1-hour charts are in the middle of a range; the 4-hour chart is still capped by 64,715—64,780. The daily, weekly, and monthly charts have not provided any immediate one-way confirmation sufficient to cover GDP and PCE risk.
BTC is the most important directional filter among the three instruments, but the current location has no trading value; therefore, only observe.
II. ETHUSDT plan (currently relatively weak short-term; only observe a breakout above 1,937 or a drop below 1,868)
Execution level: only observing
Composite score: 66/100
Current market regime: wide-range consolidation after the event; short-term relatively weaker than BTC
Reference current price: 1,901.64
Compared with the previous post’s main changes:
1,931 did not form a valid breakout; the new upside confirmation moved up to 1,937;
1,901 has been crossed multiple times; stop using it as a direct short confirmation level;
The lower confirmation moves to 1,868 outside the 1,870.26 low;
ETH shifted from being relatively strong in the previous setup to being relatively weaker in the current short-term.
Long/short zones: observe 1,924—1,935 on the upside; observe 1,870—1,885 on the downside.
Main plan—wait for a valid breakout, then reassess before going long:
Entry zone: 1,924—1,935, only used after the upgrade conditions are completed.
Entry conditions:
ETH needs a 1-hour close above 1,937, and the 15-minute breakout-candle volume must reach 1.30x the median of the previous 20 bars.
Then during the pullback to 1,924—1,935, the 1-hour chart must not close back below 1,918. For a renewed up move, you need two consecutive 5-minute Taker buy/sell ratios above 1.10, OI increases moderately, and BTC simultaneously and effectively holds above 64,780.
Binance spot must not be noticeably weaker than perps. After the conditions are met, the price is allowed to be at most about 0.10% above 1,937. If it deviates more, do not chase.
Cancellation conditions:
The 1-hour chart must reclaim above 1,918 again;
BTC failed to hold above 64,780;
OI is declining;
Active buying has not confirmed continuously;
Time is after 10:30 UTC.
Stop loss: calculate once upgraded to an executable state.
Take profit: take profit in batches
First target: calculate once upgraded to an executable state.
Second target: calculate once upgraded to an executable state.
Third target: calculate once upgraded to an executable state.
Extreme target: calculate once upgraded to an executable state.
Handling after the first target: lock after upgrading.
Trading fee and slippage assumptions: round-trip fee 0.10%, base round-trip slippage 0.03%.
Potential R after weighting by cost: calculate once upgraded to an executable state.
Alternative plan—after a 1-hour break below 1,868, switch to short observation:
ETH needs to print a 1-hour close below 1,868, then a rebound to 1,870—1,885 that cannot reclaim. Upon the renewed downward move, if two consecutive 5-minute Taker buy/sell ratios are below 0.90, OI stops falling and increases moderately, and BTC simultaneously breaks below 63,170—only then is ETH’s relative weakness confirmed as further expansion.
Long-entry zone or short-entry zone: observe shorts at 1,870—1,885.
Entry conditions: after completing a valid breakdown, a failed rebound, BTC filter confirmation, and derivatives confirmation, recalculate the official plan.
Cancellation conditions:
Reclaimed 1,890 within 1 hour;
OI continues to fall sharply;
Spot is clearly stronger than perps;
BTC did not break below 63,170;
Time is after 10:30 UTC.
Stop loss: calculate once upgraded to an executable state.
Take profit: take profit in batches
First target: calculate once upgraded to an executable state.
Second target: calculate once upgraded to an executable state.
Third target: calculate once upgraded to an executable state.
Extreme target: calculate once upgraded to an executable state.
Handling after the first target: lock after upgrading.
Trading fee and slippage assumptions: round-trip fee 0.10%, base round-trip slippage 0.03%.
Potential R after weighting by cost: calculate once upgraded to an executable state.
Analysis logic:
ETH is currently near the middle of the 1,870.26—1,935 range. Over the past 24 hours, its gain is lower than BTC and SOL. From the previous snapshot to now, open interest has basically been flat, with no new trend-driven capital.
The latest full 1-hour Taker buy/sell ratio is about 0.81. The active sell orders are the most evident among the three instruments. The whole-market account long/short ratio is about 2.15; the large-holder account long/short ratio is about 1.66; and the large-holder position long/short ratio is about 1.38. Long crowding is clearly higher in ordinary accounts than in the large holders’ actual positions.
Funding rate is about +0.0076%, not extreme. Mark price is slightly below index price, with perps at a mild discount. Binance spot trading is normal; liquidity has no obvious abnormality, but current spot support is not enough to change the 1-hour weakness.
1,935 is the event high. Only if it holds above 1,937 for 1 hour and receives synchronized support from BTC, volume, and OI should we reconsider relative strength. On the downside, 1,870 has already seen support once, but when it is retested after the first bounce, you cannot assume the support strength remains unchanged.
ETH is currently not suitable to chase shorts, and it has not met the conditions to chase longs either; therefore only observe.
III. SOLUSDT plan (long accounts are still crowded, but the current price is in the middle of the range; it only waits for 74.15—74.50 or around 72.26)
Execution level: only observing
Composite score: 68/100
Current market regime: high-Beta wide-range consolidation after the event
Reference current price: 73.4900
Compared with the previous post’s main changes:
The previous short plan for 74.15—74.45 was cancelled due to BTC filter conditions;
Today we still observe 74.15—74.50, but do not open shorts directly just because price reaches it;
The confirmation of long invalidation was tweaked from 74.63 to 74.58 because the new event high is 74.50;
72.26 becomes the new lower boundary;
Current price is in the middle of the range, so the official risk ratio is reduced to 0.
Long/short zones: observe 74.15—74.50 on the upside; observe 72.26—72.60 on the downside.
Main plan—wait for full upper-boundary pressure confirmation, then reassess a short:
Entry zone: 74.15—74.50, only used after the upgrade conditions are completed.
Entry conditions:
After SOL rebounded into 74.15—74.50, it cannot close effectively above 74.58 within the next hour. In the 15 minutes, you need to see a bearish body, a clear upper wick, or consecutive lower highs, and it must close again below 74.05.
When the pullback occurs, the 15-minute trading volume reaches 1.30x the median of the previous 20 bars, and two consecutive 5-minute Taker buy/sell ratios are below 0.90.
OI needs to increase moderately; it cannot keep falling. Binance spot cannot be the first to hold above 74.58. BTC cannot simultaneously and validly hold above 64,780.
After conditions are met, the lowest allowed executed trade price is 74.02. If it has already broken below this level, do not chase a short.
Cancellation conditions:
1-hour close above 74.58;
Two consecutive 5-minute Taker buy/sell ratios above 1.10;
OI declining;
Spot breaks above 74.58 first with increased volume;
BTC effectively holds above 64,780;
Time is after 10:30 UTC.
Stop loss: calculate once upgraded to an executable state, based on the 74.50 high and 15-minute ATR.
Take profit: take profit in batches
First target: calculate once upgraded to an executable state.
Second target: calculate once upgraded to an executable state.
Third target: calculate once upgraded to an executable state.
Extreme target: calculate once upgraded to an executable state.
Handling after the first target: lock after upgrading.
Trading fee and slippage assumptions: round-trip fee 0.10%, base round-trip slippage 0.05%.
Potential R after weighting by cost: calculate once upgraded to an executable state.
Alternative plan—after a 1-hour hold above 74.58, switch to breakout-long observation:
For SOL: it needs a 1-hour close above 74.58, followed by a pullback to 74.30—74.50 that does not break. At the breakout, the 15-minute trading volume must reach 1.30x of the median of the previous 20 bars; two consecutive 5-minute Taker buy/sell ratios must be above 1.10; OI increases moderately; and at the same time BTC must effectively hold above 64,780.
Long-entry zone or short-entry zone: observe longs at 74.30—74.50.
Entry conditions: once the 1-hour breakout, pullback confirmation, spot/perp synchronization, and BTC directional confirmation are all completed, recalculate the official plan.
Cancellation conditions:
On the pullback: the 1-hour chart closes back below 74.05;
OI enters an abnormal expansion phase;
Funding rate rises rapidly;
BTC falls back to 64,480;
Time is after 10:30 UTC.
Stop loss: calculate once upgraded to an executable state.
Take profit: take profit in batches
First target: calculate once upgraded to an executable state.
Second target: calculate once upgraded to an executable state.
Third target: calculate once upgraded to an executable state.
Extreme target: calculate once upgraded to an executable state.
Handling after the first target: lock after upgrading.
Trading fee and slippage assumptions: round-trip fee 0.10%, base round-trip slippage 0.05%.
Potential R after weighting by cost: calculate once upgraded to an executable state.
Analysis logic:
SOL’s gain over the past 24 hours is slightly higher than BTC and ETH, but from the previous snapshot to now, price is still slightly lower while open interest has increased by about 1.2%. Price is not strengthening while leverage is increasing again, meaning both long and short sides are rebuilding positions within the range.
Across all market accounts, the long/short ratio is about 2.56; for large-holder accounts about 2.90; and for large-holder positions about 1.66. SOL is still the most long-crowded among the three instruments at the account level. This increases the likelihood of a pullback on the upside, but it cannot be used alone as a reason to short.
The latest full 1-hour Taker buy/sell ratio is about 1.03, close to balanced. Some recent 5-minute bars show a recovery in active buy orders, but it still does not meet continuous short confirmation. Therefore, opening a short right now lacks active-trade support.
Funding rate is about +0.0078%, not at an extreme level. Mark price is slightly below index price, with no clear positive premium. Binance spot trading and liquidity are normal. No abnormal spikes exceeding the 15-minute volatility circuit-breaker threshold have been found, and there is no reliable project-specific event that is sufficient to change the trading direction on its own.
74.15—74.50 is the upper supply zone after the event; 72.26—72.60 is the lower consolidation/support zone. Current position at 73.49 is in the middle of both, with no cost advantage.
SOL’s volatility and long crowding are both higher than BTC and ETH, but it’s not worth betting at the current location. Only after it returns near the boundaries and obtains full confirmation should it be reassessed.
4. My execution plans for the three coins:
BTCUSDT execution plan:
I will not establish any new BTC positions at the current price today. On the upside, I only watch whether the 1-hour chart can close effectively above 64,780, then wait for a pullback to 64,580—64,720. On the downside, I only watch whether it can drop below 63,170 on the 1-hour chart, then wait for a rebound to 63,230—63,420 to fail. Volume, two consecutive 5-minute Taker signals, and OI do not synchronize to meet the requirements, so I will not chase long or short based on a single probe wick. After 10:30 UTC, all new BTC position plans are cancelled.
ETHUSDT execution plan:
I will not establish any new positions at ETH’s current price today. On the upside, ETH must first hold steady above 1,937, and BTC must also break above 64,780. On the downside, it must drop below 1,868, and BTC must also break below 63,170. ETH’s active sell orders are currently somewhat strong, but it is still in the middle of the range; there is no suitable risk-reward for directly shorting. Without boundaries, closes, and BTC filter confirmation, I will keep waiting.
SOLUSDT execution plan:
I will not establish any new SOL positions at its current price today. Only if price returns to 74.15—74.50 and we see complete upper-boundary rejection conditions, will I reassess the short. If it holds above 74.58 for 1 hour, I will cancel the short observation and switch to waiting for a breakout pullback. If price directly falls toward 72.26, I also won’t chase a short; I will only observe whether the lower boundary forms new support or a valid breakdown occurs. After 10:30 UTC, no new plans will be executed.
5. Position suggestion:
BTC single-trade risk ratio: 0. The current execution level is only observing.
ETH single-trade risk ratio: 0. The current execution level is only observing.
SOL single-trade risk ratio: 0. The current execution level is only observing.
First entry position ratio: not applicable currently. When later upgraded to executable, the first use will take 40% of the plan’s notional position.
Second confirmation add-on ratio: after upgrade, 30%.
Third add-on confirmation ratio: after upgrade, 30%.
Is it allowed to add to the loss: no.
Recommended whether to use isolated margin or cross margin: if later upgrades add more instruments, use isolated margin uniformly.
Reasonable leverage range for BTC: after upgrading to executable, 2—3x. No new positions are opened currently.
ETH reasonable leverage range: after upgrading to executable, 2—3x. No new positions are opened currently.
Reasonable leverage range for SOL: after upgrading to executable, 1.5—2x. No new positions are opened currently.
Total risk cap when holding all three instruments at the same time: currently 0. When valid upgrades occur later, the total risk of all open but unclosed plans calculated from the initial stop-loss must not exceed 0.40% of the account net value.
Combined risk cap when BTC, ETH, and SOL are in the same direction: treat the three as one correlated risk group; total risk must not exceed 0.35% of the account net value. In principle, only execute the one with the highest score.
Risk limit before major events: after 10:30 UTC, no new positions may be established. After GDP and PCE are released, wait at least 30 minutes and reanalyze the 1-hour structure.
Risks of abnormal volatility, probes/wicks, spread, slippage, and liquidity:
During FOMC, there have already been obvious two-way probe wicks. When GDP and PCE are released, similar behavior may occur again. The order books for BTC and ETH are usually deeper, but in an instant event spike, stop-loss penetration can still happen. SOL depth is lower than BTC and ETH, so slippage and rapid price jumps are higher. Ordinary technical stop losses cannot fully cover event risk, so I won’t let today’s observation plan cross the data release time.
When the subsequent plan is upgraded to executable, the notional position is still calculated using the following formula:
Account net value × allowed single-trade risk ratio ÷ distance percentage from entry price to stop-loss price.
Leverage only affects margin usage; it does not determine the allowed loss amount. If the stop-loss distance doubles, the notional position must be halved accordingly.
The above is a conditional plan built based on the current market structure. It does not mean that once price reaches the entry zone, trading is mandatory. Whether to execute still depends on whether candle closes, trading volume, active buy/sell, open interest, and funding rates work together. If conditions are not met, keep waiting; if you can’t see clearly, don’t trade.
#美联储何时降息? $BTC $ETH $SOL