

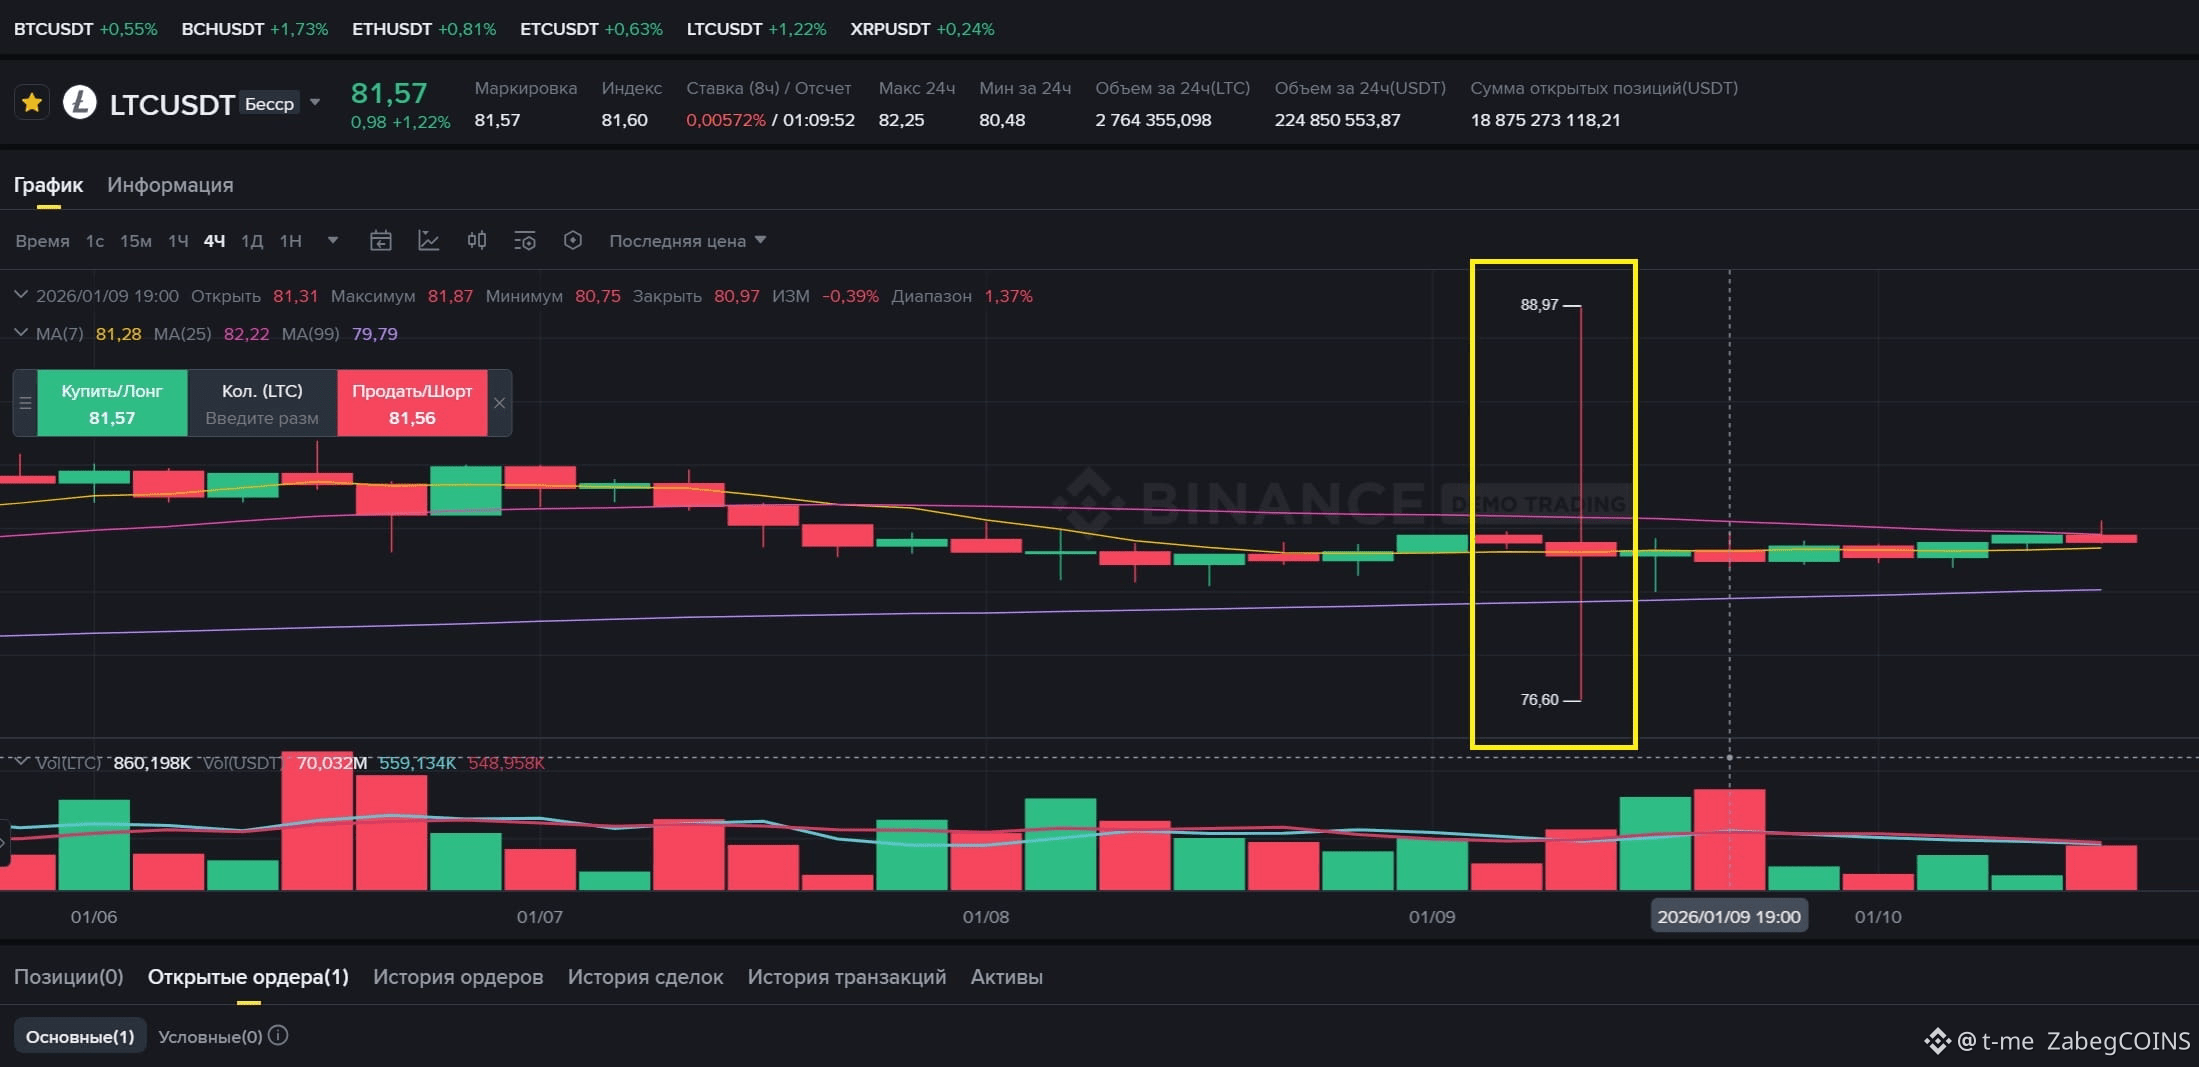
Need the opinion of more experienced people, here's such a chart. Opening and closing within normal range, but the maximum and minimum are definitely not. Such a wick could knock down both longs and shorts. Moreover, if you look at the chart for 1 second, the wick doesn't change. That is, all the change happened within 1 second, which is highly unlikely. There was no such price change on other exchanges. There are verification mechanisms to ensure the chart is accurate or whether someone drew it as they wanted.
Join global crypto users on Binance Square
⚡️ Get latest and useful information about crypto.
💬 Trusted by the world’s largest crypto exchange.
👍 Discover real insights from verified creators.
Email / Phone number