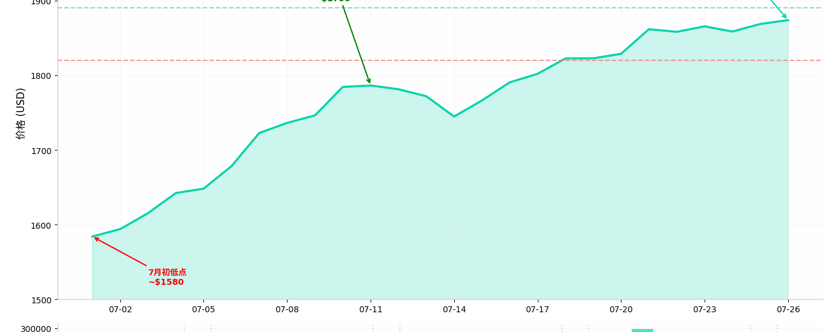
Ethereum is currently in the repair phase after a decline. On the daily timeframe, there is a bullish engulfing pattern (a positive candle engulfing the prior bearish one), but trading volume is insufficient, and short-term bullish momentum is only weakly released. On the four-hour timeframe, price has already moved out of the consolidation range, but the rally lacks the necessary volume to support it. $1890 is the near-term pivot level between buyers and sellers. The one-hour timeframe is also showing low volume, and the overall market remains in a range-bound consolidation between $1828 and $1890. On the macro front, the FOMC meeting on July 28–29 is approaching. Geopolitical tensions involving Iran and the region are boosting risk-off sentiment, and the cryptocurrency market as a whole is in a “Fear” zone (Fear & Greed Index at 27). Strategy-wise, it is recommended to wait for a pullback and confirmation. If $1820 holds and does not break, the bottom-higher-low and top structure remains intact. If the pullback is shallow, a long position could be considered, with strict stop-loss controls.
I. Market backdrop: fragile bounces during a bear-market repair
In 2026, the cryptocurrency market experienced a deep adjustment in the first half of the year. As of early July, Bitcoin has fallen by more than 30% from its 2025 all-time high. Ethereum, too, has dropped from near $5,000 to below $1,600. Over the entire crypto market, total market capitalization has evaporated by about 47% from the peak, falling to around $2.3 trillion. June was one of Bitcoin’s worst months in four years. Spot Bitcoin ETFs saw a monthly net outflow of about $4.5 billion, the worst performance since their launch.
However, in July the market showed signs of seasonal repair. At the start of July, U.S. Nonfarm Payrolls came in far below expectations (only about 57,000 new jobs, roughly half of what was expected). This significantly reduced market worries about further rate hikes by the Federal Reserve, driving a rebound in risk assets. Bitcoin rebounded from a low of around $57,950 on July 1 to the $64,000 area. Ethereum also recovered from around $1,580 to the current $1,873.
But it’s important to note that the foundation for this rebound is not solid. The Fear & Greed Index is still in the "Fear" range around 27. ETF fund flows showed signs of stabilizing at the start of July, but they have not yet formed sustained, large-scale net inflows. More worth focusing on is that the Iran–U.S. geopolitical tension escalated again in mid-July, pushing Brent crude oil above $95 per barrel. Gold hit a new all-time high, and some safe-haven funds rotated out of the crypto market into traditional safe-haven assets. Stablecoin supply has begun to contract.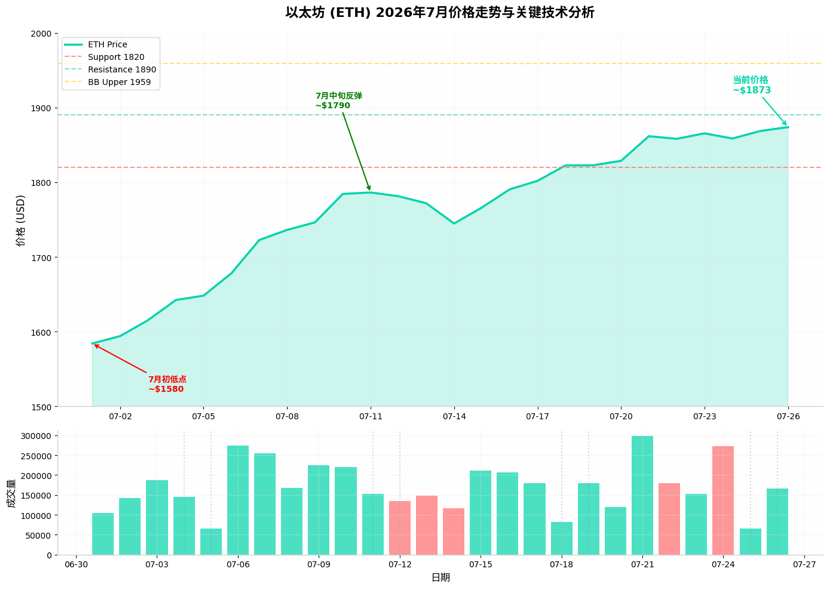
II. Daily timeframe analysis: the weak rebound structure is unchanged
On the daily timeframe, Ethereum’s current price action shows a typical "repair after a drop" characteristic. The candlesticks are trading above the EMA15 and EMA30. The short-term moving averages are forming a bullish alignment, which is a positive signal indicating that short-term buying pressure is accumulating. In the MACD indicator, DIF has crossed above DEA, and the red histogram bars have expanded slightly, further confirming the faint release of short-term bullish momentum.
However, the medium- to long-term moving averages (EMA60, EMA90, EMA120) are still diverging downward, which means the overall trend has not yet turned. The Bollinger Bands are currently in a tight/contracted state. Price is hovering around the $1,842 mid-band; the upper band at $1,959 creates short-term pressure; and the lower band at $1,724 offers support on the far side. The Fibonacci 78.6% retracement at $2,242 remains a strong resistance level, and the current price still has significant room before reaching it.
Over the weekend, the daily line closed with a bullish engulfing-like pattern (a bullish candle containing a prior bearish body). This is a technically bullish signal, but the trading volume is clearly insufficient. In technical analysis, "volume leads price" is a fundamental principle—price rallies without volume confirmation are often difficult to sustain. Therefore, although the daily pattern looks relatively warm, the lack of volume support means the bulls have not yet formed a consensus. Stay alert for the risk of a false breakout.
III. Analysis of the four-hour timeframe: stalemate at the bull-bear dividing line
The four-hour outlook is more complex. The candlesticks are currently below EMA15. The short-term moving averages are sticking together, showing that both bulls and bears are aggressively competing for control. In the MACD indicator, DIF is still running below DEA. The green histogram bars have shortened slightly, indicating that bearish momentum has weakened somewhat, but it has not fully disappeared.
The Bollinger Bands are opening in a narrowing direction, with price moving near the mid-band. The upper band at $1,943 acts as short-term resistance, while the lower band at $1,832 provides support. Most importantly, the Fibonacci 38.2% retracement at $1,870 closely overlaps with the current price, forming a short-term dividing line between bulls and bears. Price has tested this level multiple times without breaking through effectively, showing that selling pressure above remains relatively heavy.
The four-hour timeframe has already moved out of the prior consolidation range. This is a positive structural change, but during the rally, trading volume has continued to shrink, indicating there is not enough follow-through buying. In technical analysis, the combination of "price rising while volume decreases" is typically viewed as a sign that the rally lacks strength. Therefore, although the four-hour timeframe shows some bullish hints, it is still not enough to confirm a trend reversal.
IV. One-hour timeframe analysis: choosing direction within consolidation
Hourly-level analysis further confirms the judgment of short-term weakness. Price is oscillating within the $1,828–$1,890 range, with limited volatility. In terms of trading volume, there is clearly no selling pressure-less upside—when prices rise, volume is notably thin; when prices fall, there is also no panic-like dumping. Overall, the market is showing a volume-contraction consolidation pattern.
In terms of chart structure, as long as price does not fall below $1,820, the normal upward structure of higher lows and higher highs remains intact. This means the market is still trying to build an ascending structure, but every attempt to push higher meets with selling pressure, and every pullback finds buyers to absorb. For now, the forces of both sides are temporarily balanced. This equilibrium usually does not last long. As the Federal Reserve FOMC meeting approaches, the market is very likely to make a directional choice this week.
V. Macro environment: the dual variables of the FOMC meeting and geopolitical risk
At present, there are mainly two macro factors affecting the crypto market:
First, the Federal Reserve’s FOMC meeting on July 28–29. This is the most important macro event of July. Although this meeting does not include any new Economic Projections Summary (SEP), the Fed’s remarks on inflation, employment, and future rate policy will directly affect market risk appetite. Weak June employment data has already cooled market expectations for further rate hikes significantly. If the Fed releases a dovish signal, it could provide additional momentum for a rebound in risk assets. Conversely, if the Fed maintains a hawkish stance, the market may reprice rate expectations again, putting pressure on crypto assets.
Second is the heightened Iran–U.S. geopolitical tension. Since mid-July, the escalation of the Iran–U.S. conflict has driven a sharp rise in oil prices, bringing inflation expectations back into focus. This may cause the Federal Reserve to be more cautious on the anti-inflation front, and it may also prompt some capital to rotate out of high-risk assets (including cryptocurrencies) into traditional safe havens such as gold. The contraction in stablecoin supply is a signal worth paying attention to—institutional investors are converting digital dollars into U.S. Treasuries, which reduces liquidity in the crypto market.
In addition, Citibank recently lowered its 12-month target prices for Bitcoin and Ethereum—reducing Bitcoin from $112,000 to $82,000 and Ethereum from $3,175 to $2,240. This reflects the cautious stance of traditional financial institutions toward the short-term prospects of crypto assets and may also influence market sentiment.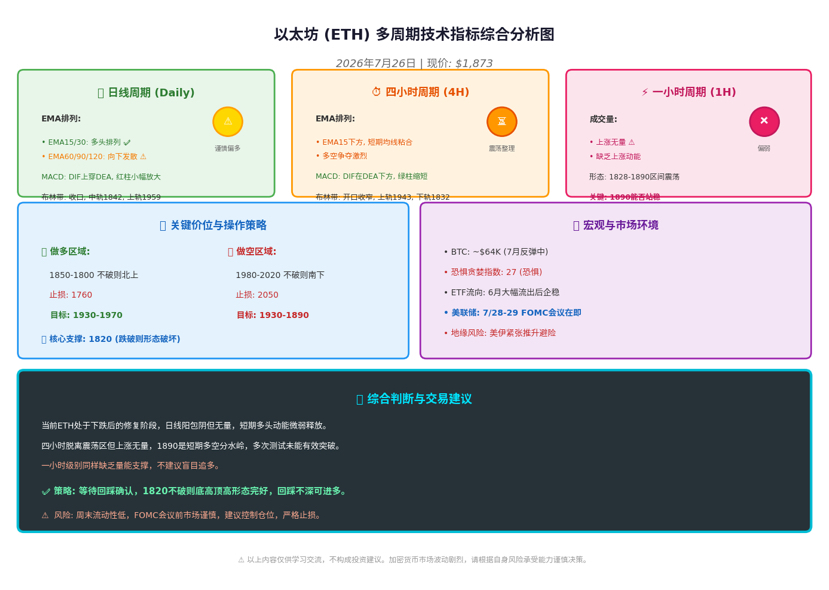
VI. Trading strategy and risk management
Based on the analysis above, the current operating strategy for Ethereum should follow the principles of "wait for confirmation, control position size, and use strict stop-loss."
Long-side strategy: Wait for a pullback into the $1,850–$1,800 zone. If this area is supported and a high-volume stabilization/holdout signal appears, you may consider setting up long positions. Set the stop-loss at $1,760, with targets looking toward $1,930–$1,970. The core premise is that $1,820 is not broken effectively—once it breaks, the higher-lows/higher-highs upward structure will be damaged, and the market structure must be reassessed.
Short-side strategy: If price rebounds and gets blocked in the $1,980–$2,020 range, you may consider initiating a small position short. Set the stop-loss at $2,050. Targets are $1,930–$1,890.
Key observation points:
• Whether $1,890 can hold effectively and break out with volume
• Whether the $1,820 support is effective
• Market reaction after the Federal Reserve’s FOMC meeting
• Whether ETF fund flows continue to improve
Risk management: For each trade, keep position size within 20% of total capital, and set a strict stop-loss. Weekend liquidity is lower, so it is not recommended to take a heavy position without confirmation signals. Volatility around and before/after the FOMC meeting may increase; investors holding positions overnight should pay special attention to risk.
VII. Conclusion: patience is the best trading strategy
Trading is something you can’t rush—especially in this kind of choppy market, patience matters more than anything. Don’t get thrown off just because others are making money. Stick to your own plan, protect your own principal—nothing is more important than that. Ethereum’s move is not over yet; there are plenty of opportunities. Stay in the game first, and you can wait for the big move that belongs to you.
The market is currently at a critical crossroads: on the daily timeframe, the repair structure and the bearish alignment of the medium- to long-term trend are contradictory; on the four-hour timeframe, breakout attempts and thin-volume rallies are contradictory; on the one-hour timeframe, range-bound consolidation and upcoming macro events are also in conflict. In such a complex situation involving multiple cycles and multiple factors, the wisest approach is not to predict direction, but to wait for the market to reveal the answer itself.
Remember: in the market, not losing money is making money. When the direction is unclear, staying on the sidelines is itself a strategy.
Disclaimer: The above content is for learning and交流 only and does not constitute any investment advice. The cryptocurrency market is highly volatile. Make decisions carefully based on your own risk tolerance. Market conditions can change rapidly—any specific actions should be based on real-time order book data.#CLARITY法案拟奖励白帽黑客 #SpaceX星舰完成上市后首次成功试飞 #英伟达与SK海力士达成5000亿美元AI合作 #伊朗迎两周来首个无美军空袭夜 #美国初请失业金降至近60年低点 $BTC