At the moment BTC has been continuing its gradual decline since yesterday’s news.
After fluctuating around 64,900, it kept falling and broke through 64,384 and 64,272; at the extreme, it may even break through 63,562.
After the pullback is complete, the price will recover to above 64,900.
In the long term, the prior view still holds: the recent high is expected to occur around 70,000.
Note that the above is a projection based on the assumption that long-term accumulation has not yet started. Once long-term accumulation begins, the trend will change accordingly.
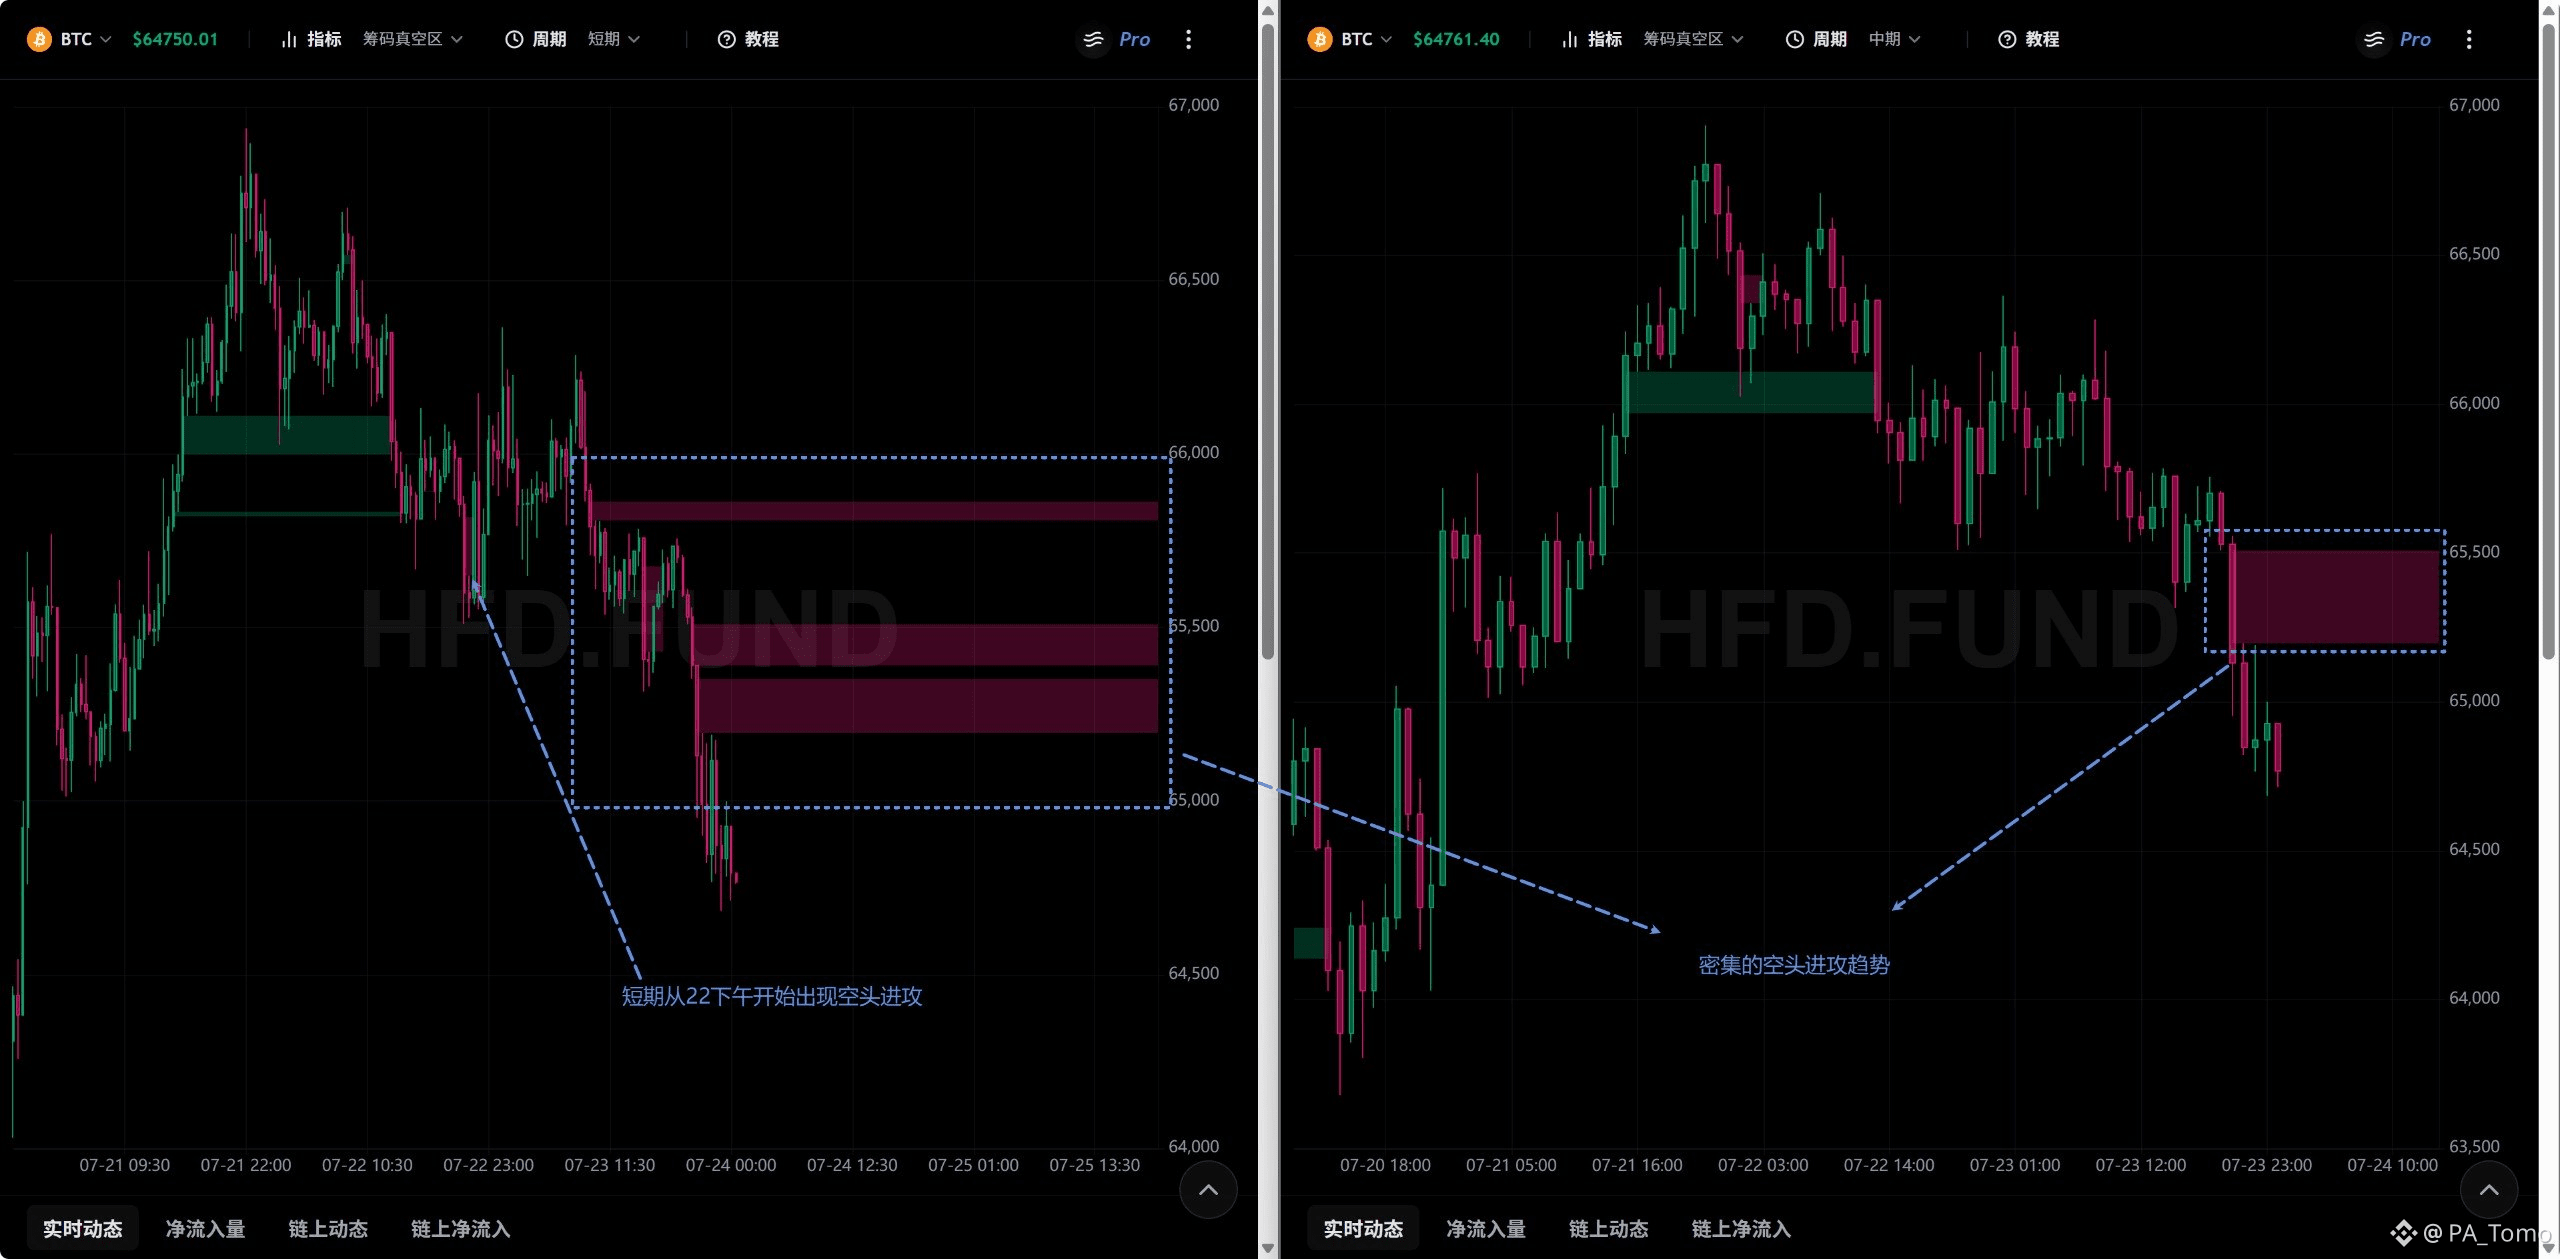
In the short term, 65,870–65,196 is entirely a bearish attack zone; in the medium term, 65,517–65,198 is also a bearish attack zone.
Based on the indicator so far, both are bearish attack phases, with a relatively strong downward momentum, and there is no meaningful bullish support beneath.
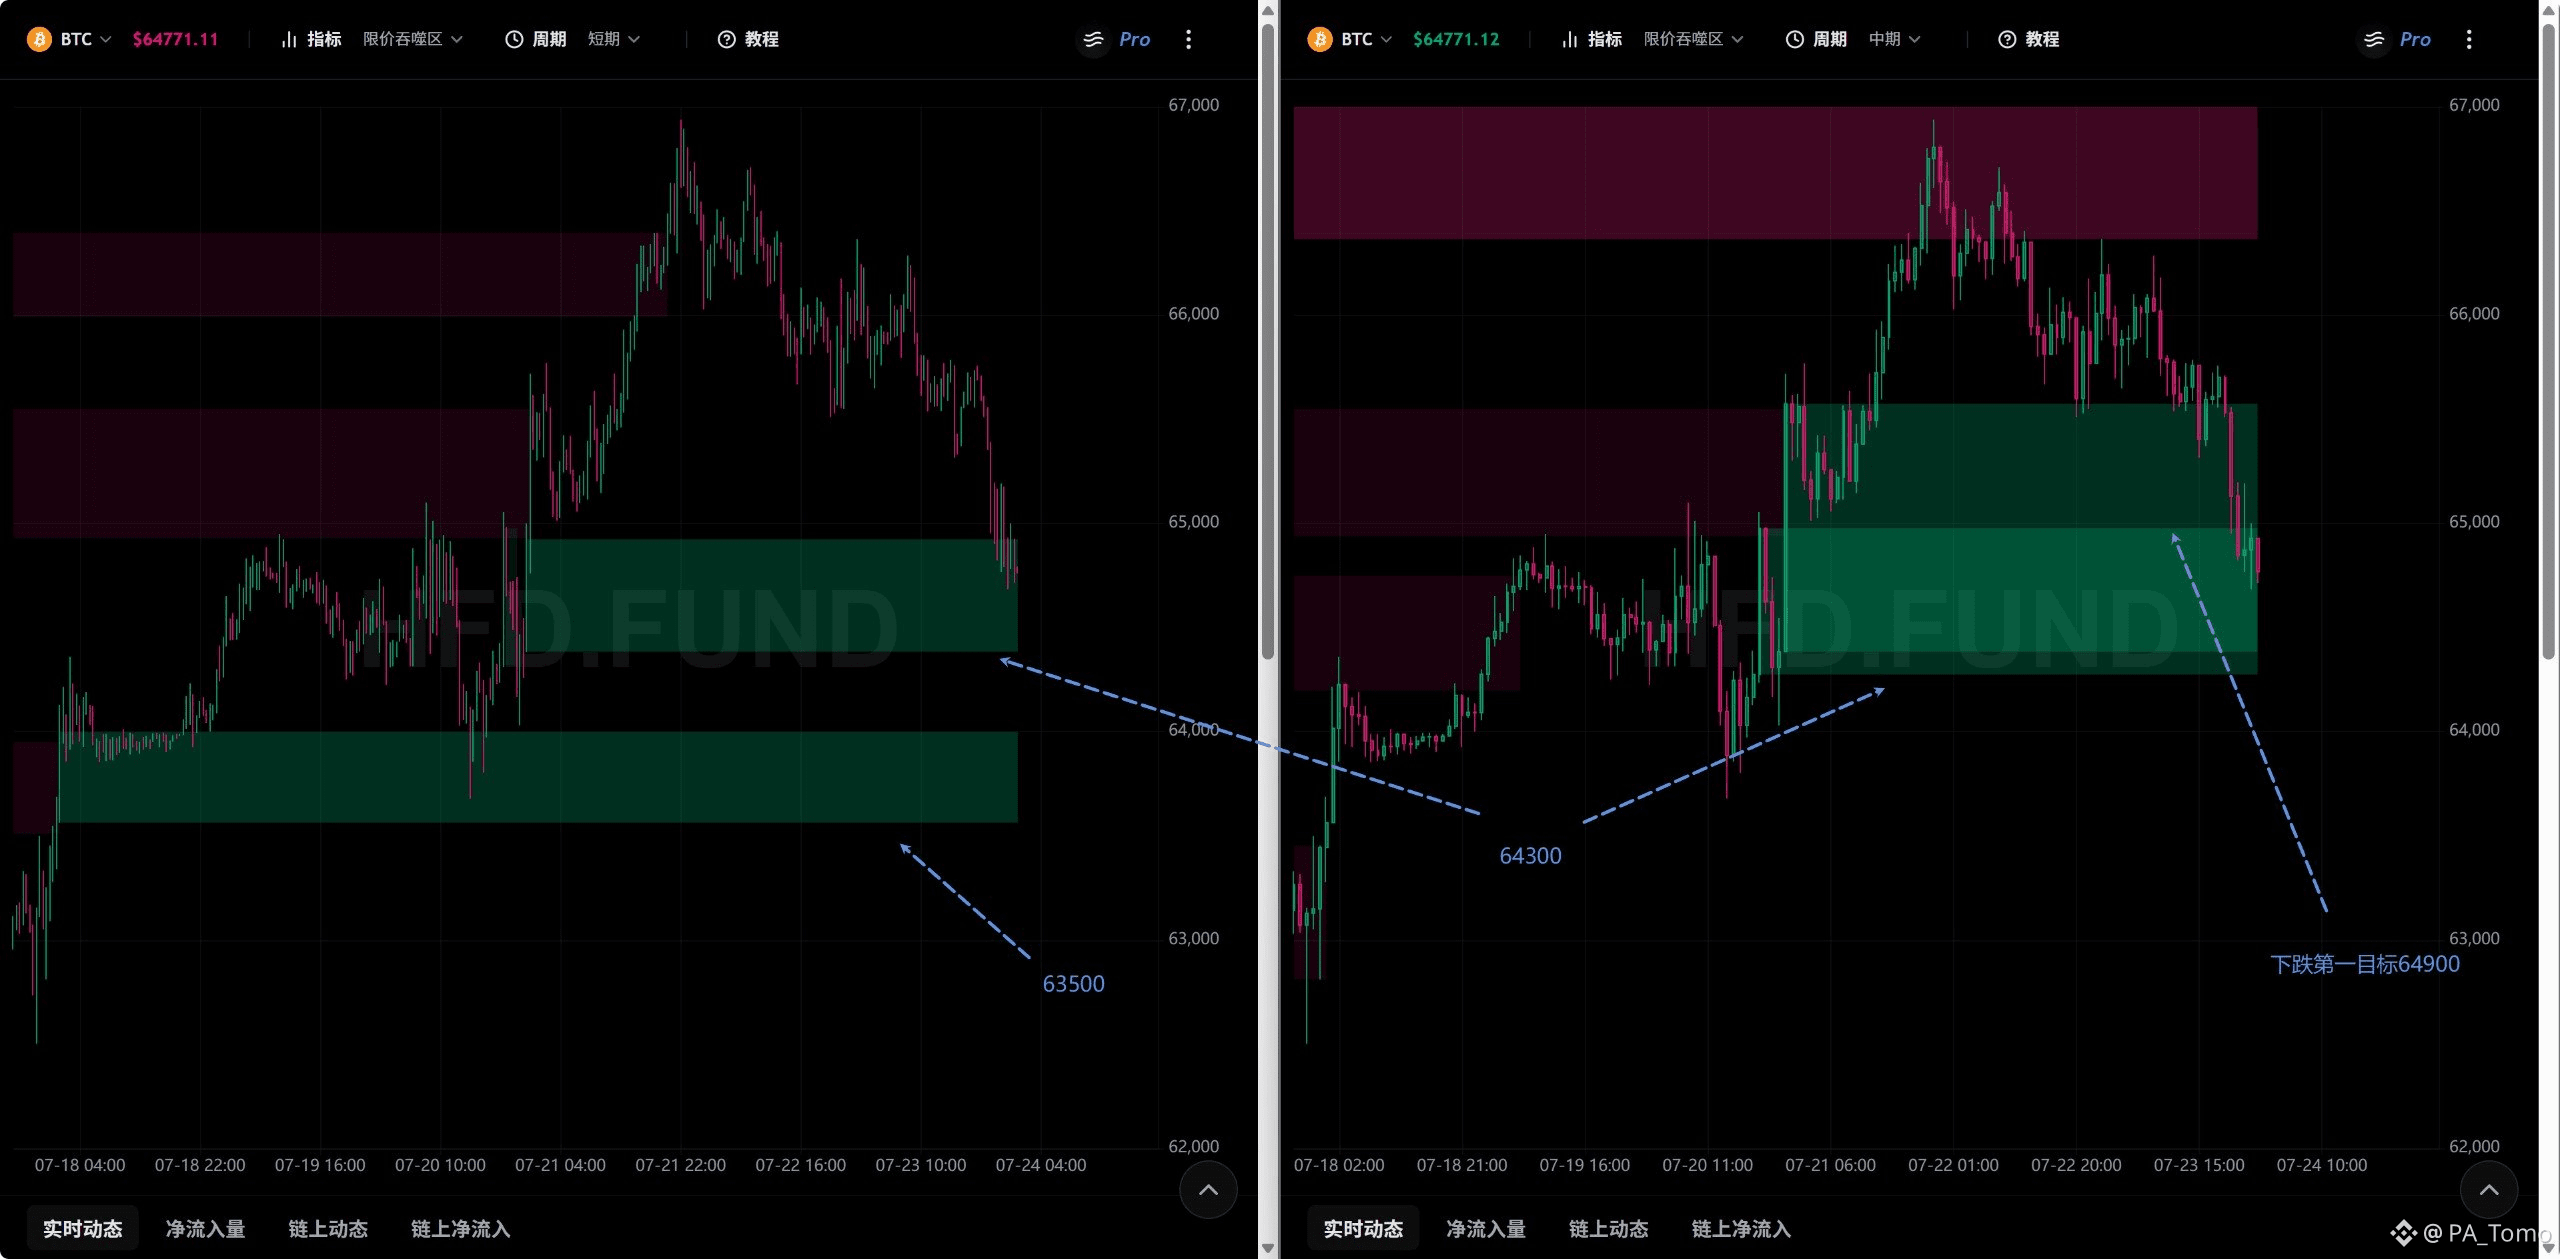
For the short term, the bearish historical support line below 64,384 can be viewed as a downside target. For the medium term, the bullish historical support line below 64,272 is another target. Once both targets are broken, the next target will be another short-term bullish historical support line at 63,562.
If accumulation starts in the short and medium term, the trend will likely remain volatile while drifting downward.
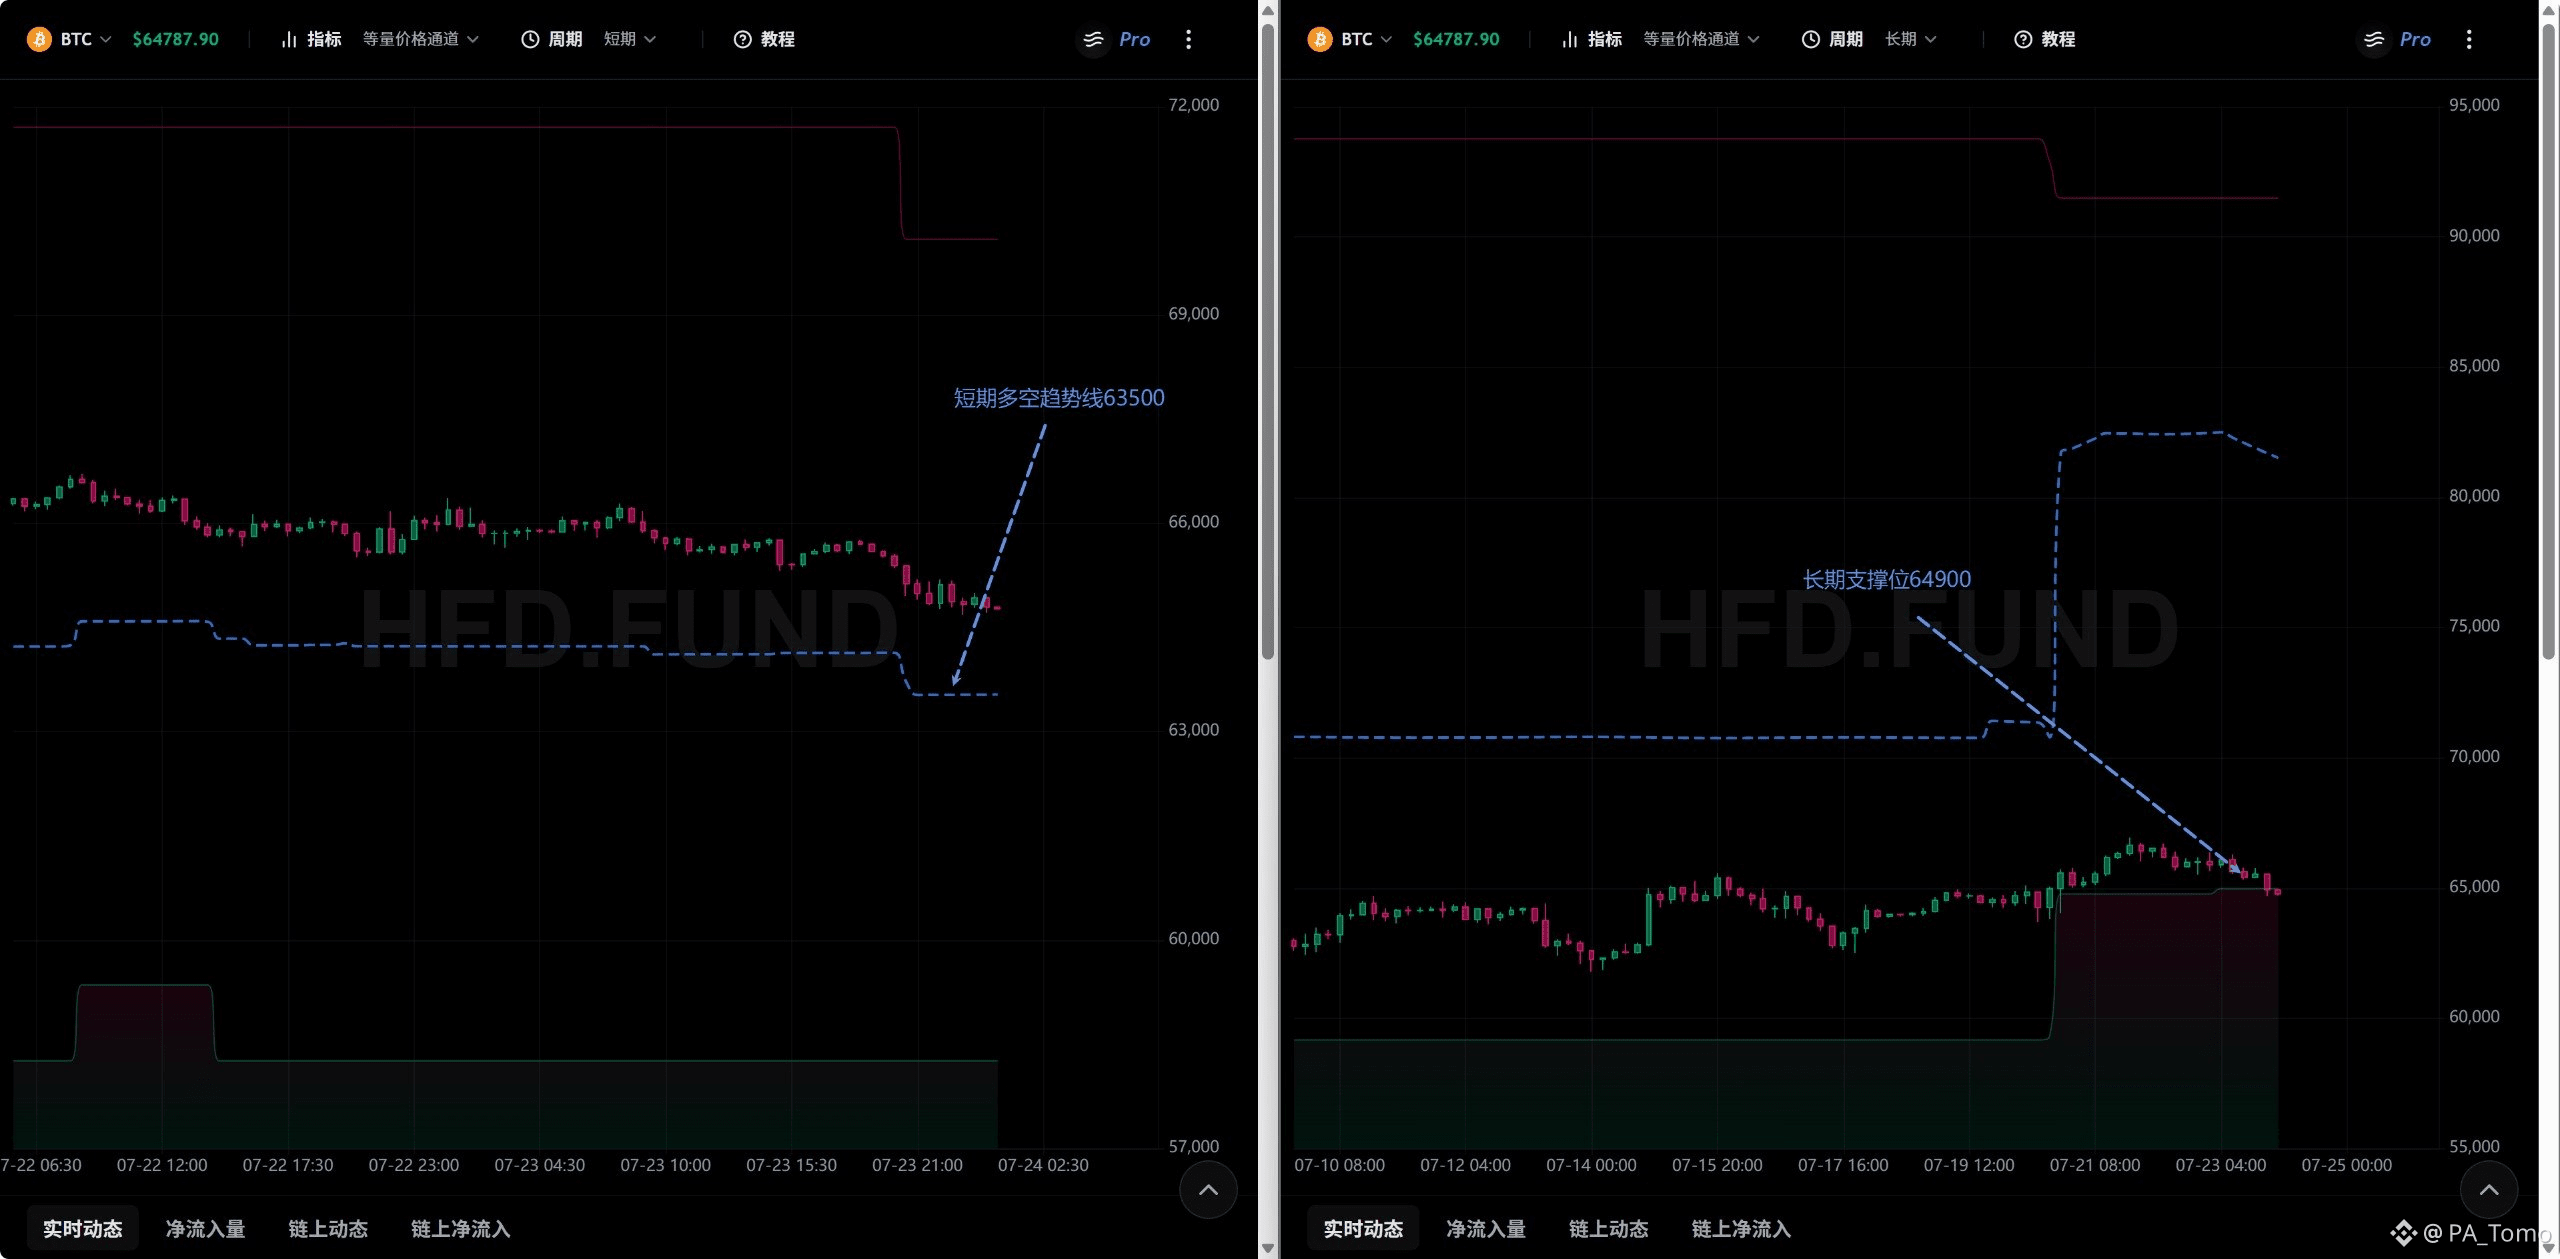
Looking at the price channel: around 64,900 is currently the long-term lower bound and provides strong support. If it breaks and long-term accumulation starts, then the lower bound will shift downward and the price will likely continue falling. Meanwhile, the short- and medium-term trend support lines are both around 63,500, which can be regarded as the second support area.
As for the lower edge of the long-term distribution cost band, it is around 63,600. Only if the price drops well below 63,600 would it be possible to trigger long-term accumulation. So, based on the current outlook, it is very likely that after the price falls near 63,500, it will receive short- and medium-term support.
The downward path provided by the limit-price engulfing is 64,384, 64,272, and 63,562.
Putting it all together: 64,900 as the first support level may be pierced by a wick, but the body likely won’t break through by too much.
After fluctuating around 64,900, it kept falling and broke through 64,384 and 64,272; at the extreme, it may even break through 63,562.
After the pullback is complete, the price will recover to above 64,900.
In the long term, the prior view still holds: the recent high is expected to occur around 70,000.
Note that the above is a projection based on the assumption that long-term accumulation has not yet started. Once long-term accumulation begins, the trend will change accordingly.
In the short term, 65,870–65,196 is entirely a bearish attack zone; in the medium term, 65,517–65,198 is also a bearish attack zone.
Based on the indicator so far, both are bearish attack phases, with a relatively strong downward momentum, and there is no meaningful bullish support beneath.
For the short term, the bearish historical support line below 64,384 can be viewed as a downside target. For the medium term, the bullish historical support line below 64,272 is another target. Once both targets are broken, the next target will be another short-term bullish historical support line at 63,562.
If accumulation starts in the short and medium term, the trend will likely remain volatile while drifting downward.
Looking at the price channel: around 64,900 is currently the long-term lower bound and provides strong support. If it breaks and long-term accumulation starts, then the lower bound will shift downward and the price will likely continue falling. Meanwhile, the short- and medium-term trend support lines are both around 63,500, which can be regarded as the second support area.
As for the lower edge of the long-term distribution cost band, it is around 63,600. Only if the price drops well below 63,600 would it be possible to trigger long-term accumulation. So, based on the current outlook, it is very likely that after the price falls near 63,500, it will receive short- and medium-term support.
The downward path provided by the limit-price engulfing is 64,384, 64,272, and 63,562.
Putting it all together: 64,900 as the first support level may be pierced by a wick, but the body likely won’t break through by too much.