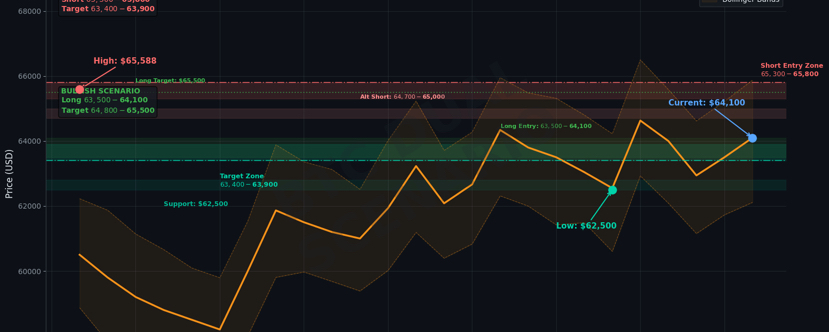
As of July 19, 2026, Bitcoin is trading in a tight range around $64,100, while Ethereum is at about $1,833. The current market is at an extremely delicate crossroads: on the one hand, the four-hour MACD has formed a golden cross and continues to diverge upward, with the price showing the standard bullish uptrend structure—higher lows and higher highs—along with expectations that capital will flow back in after the World Cup, supporting the bullish thesis. On the other hand, at the daily level the MACD has also formed a golden cross, but the histogram has started to shrink; in June, ETF outflows set a record at approximately $4.51 billion; the Fed’s hawkish stance suppresses expectations for easier policy; negotiations on the CLARITY crypto bill have stalled; and although the bearish structure has not truly been reversed. This article deeply dissects the current technical structure from both bullish and bearish angles, providing differentiated strategic frameworks for traders across different timeframes.
I. Macro backdrop: threefold headwinds suppress price, but the worst selling may have already passed
The 2026 Bitcoin market is experiencing a “downturn with no villains.” Unlike endogenous crises such as the 2022 Terra collapse or the FTX blow-up, the driving force behind this pullback is almost entirely external: Federal Reserve monetary policy, ETF institutional fund outflows, and regulatory policy uncertainty.
ETF outflows hit a record high, but the structure is starting to diverge. In June 2026, US spot Bitcoin ETFs recorded net outflows of about $4.06 billion to $4.51 billion, the worst single-month performance since ETF approval in January 2024. From May 15 to June 3, ETFs saw net outflows for 13 consecutive trading days totaling roughly $4.33 billion. BlackRock’s IBIT alone lost about $1.34 billion in a single week. However, a deeper look at the outflow structure shows that hedge funds reduced ETF holdings by about 39%, brokers cut by 53%, while investment advisers managing long-term client portfolios only reduced holdings by 5.9%. This indicates that more selling came from taking profits by short-term tactical funds rather than a collapse of long-term conviction. More importantly, historical data show that extreme ETF outflow readings are often closer to the stage bottom than the top—record-level outflows may actually signal that sentiment has hit its low point.
The Fed’s hawkish stance is the core suppressing factor. At the June FOMC meeting, newly appointed Fed Chair Kevin Warsh kept interest rates unchanged in the 3.50%–3.75% range, but removed the within-year rate-cut guidance that the market had expected. Of the 18 officials, 9预计2026年可能加息. The futures market implies about a 70% probability that the FOMC meeting on July 28–29 will keep rates unchanged, with the remaining probability pointing to a hike rather than a cut. This means the “higher for longer” rate environment will continue to suppress the appeal of non-yielding assets like Bitcoin.
Uncertainty around the CLARITY Act is intensifying the wait-and-see sentiment. The bill aims to clarify how the SEC and CFTC regulate digital assets, establish rules for registering trading platforms, and set consumer protection standards. However, negotiations have hit an impasse. Although polls show 52% of voters support the bill and cross-party support is significantly high, the uncertainty in the legislative process has led some institutions to choose “exit first, then wait and see.”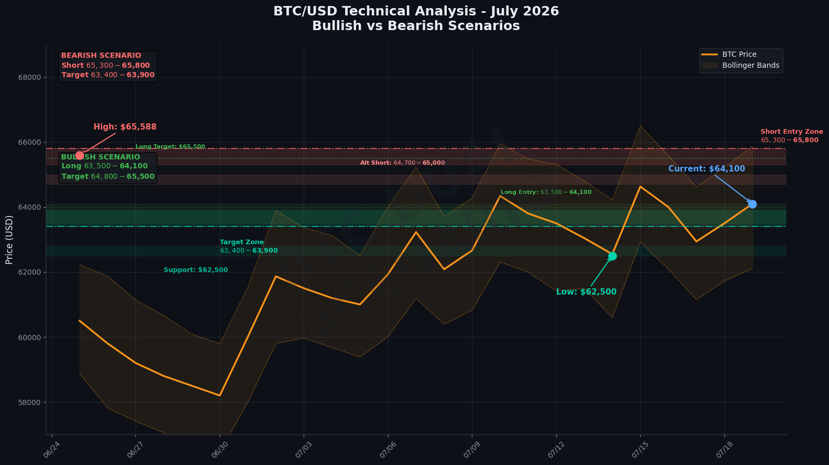
II. From the short-side perspective: no volume on the rebound; structure unchanged; the resistance zone is the best window to short
From the perspective of short sellers, multiple technical signals point to the view that “rallies are opportunities to sell.”
Trading volume is the biggest soft spot of the rebound. Bitcoin rebounded from the June 30 low of about $57,747 to the July 15 high of about $64,630, up about 12%, but this entire rebound lacked volume confirmation. At the intraday low around $62,500, some spot inflows have been picking up, which temporarily slowed the downward pace, but every time price probes upward it gets pushed back down by short-term moving averages. Without volume support, the rebound is essentially short covering and oversold repair—not an active offensive by new longs.
The four-hour MACD remains in a death cross and continues downward (from the short-side perspective). On the daily timeframe, although the MACD forms a golden cross and the histogram is positive—showing some short-term upward momentum—the latest histogram bars have started to show contraction, suggesting that upward momentum is fading. The market appears to lack follow-through on breakouts and may require consolidation. For short-term shorts, this implies that long momentum is running out—each upward push is a better short entry point.
Key resistance creates a rigid overhead supply. After previously probing higher and testing a peak around $65,588, Bitcoin quickly faced pressure and pulled back. That level has become a psychological barrier that longs find hard to cross. Looking at the Bollinger Bands structure, the upper band has locked in upside space all along; whenever price approaches the $65,000 area, it encounters clear overhead selling pressure.
Short-seller strategy framework:
• Short BTC (the big coin): Wait for a rebound into the $65,300–$65,800 range to enter a short. This is the core resistance band extending from the prior swing high. If the rebound lacks strength, you can position earlier in the $64,700–$65,000 range. Set the stop-loss strictly above $65,800; once price breaks out convincingly and holds, it indicates the short structure has been damaged. Targets are sequentially $63,900 and $63,400.
• Short ETH (the two-coin): Ethereum and Bitcoin are highly correlated and are also in the post-rebound consolidation phase. Against the backdrop of overall long momentum fading, ETH’s surge faces pressure from moving averages and the dense prior positioning area. Wait for a rebound into the $1,890–$1,930 range to short; set the stop-loss above $1,930. Targets are $1,830 and $1,790.
III. From the long-side perspective: golden cross confirmation; structure forming; pullbacks are the opportunity to get in
However, when switching to a four-hour timeframe, a completely different technical picture is unfolding.
After the four-hour MACD forms a golden cross, it continues to diverge upward. The DIF line remains consistently above the DEA line. Bull momentum with red histogram bars keeps expanding, and intermediate-term upside momentum reserves are abundant. The two lines are rising steadily in sync, and there are not yet any bearish signals such as a hidden top divergence or a turn downward. Bullish momentum has not entered a phase of exhaustion, supporting the continuation of this rebound.
A standard long-side rising structure has already formed. After a prior pullback to a low level, price printed a long lower shadow to probe the bottom, followed by several consecutive bullish candles with coherent bodies, stepping up higher highs and higher lows. The bearish pullback candles have short bodies, and the pressure from shorts is weak. Overall, the candlestick pattern shows higher lows continuously and rising highs—textbook bullish rising structure—indicating strong control by the bulls.
Expected capital inflows after the World Cup ends. The 2026 World Cup will conclude on July 19, and global attention will shift from sports events back to financial markets. Historical experience suggests that after major sporting events, some defensive capital tends to flow back into risk assets. For the cryptocurrency market, this implies that potential incremental funds may gradually enter over the next one to two weeks.
Long-side strategy framework:
• Go long BTC (the big coin): Wait for a pullback into the $63,500–$64,100 support zone to enter long. This area is the upper edge of the recent trading range base and a key defensive position for longs. Set the stop-loss below $63,000. Targets are sequentially $64,800 and $65,500.
• Go long ETH (the two-coin): Buy after Ethereum retraces into the $1,800–$1,830 range. Set the stop-loss below $1,780. Targets are $1,860 and $1,890.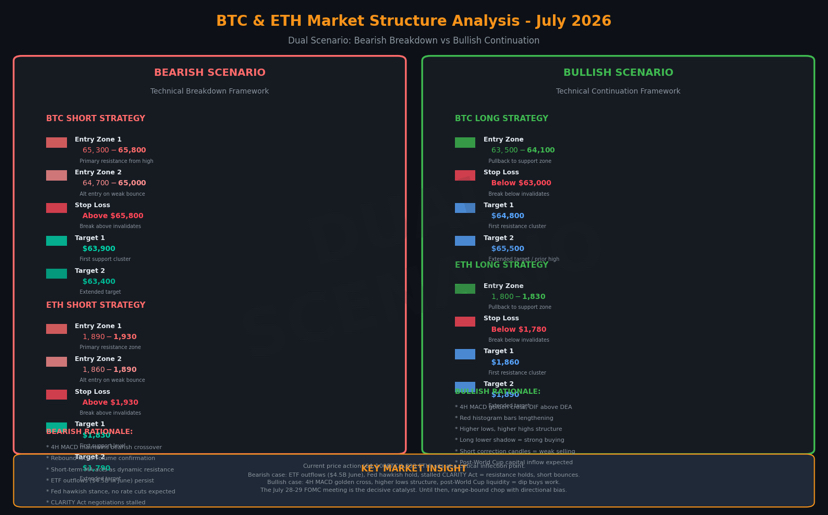
IV. Key decision point: The FOMC meeting on July 28–29 is the directional catalyst
The most honest description of the current market is a “waiting market.” Both bulls and bears have their own technical rationales, but neither side has enough power to break the deadlock. A real directional decision likely won’t become clear until after the Fed’s FOMC meeting on July 28–29.
Three scenario simulations:
Base scenario (highest probability): The Fed keeps interest rates unchanged, but maintains a hawkish tone. Bitcoin is likely to trade in a roughly $56,000–$65,000 range, and every attempt to push above $65,000 will likely run into resistance and pull back. In this environment, a range-trading strategy is most suitable—short near resistance and go long near support.
Bearish scenario: If inflation data comes in above expectations, the Fed releases signals for further rate hikes, or events occur where companies are forced to sell Bitcoin, price could break below the $58,000 support, drop to the $56,200 Fibonacci support, and in extreme cases could test the $50,000–$53,000 range.
Bullish scenario: If inflation cools off, ETF funds flow back in, or the Fed softens its wording, Bitcoin could hold above $60,000, break through the key resistance at $63,800, and open a path toward $70,000.
V. Trading philosophy: respect structure, not directional predictions
In the face of the current complex situation where both longs and shorts are intertwined, the most dangerous approach is to “pick a side”—to be firmly bullish or bearish, then seek evidence to support your bias. A more mature trading mindset is to prepare two sets of strategies at the same time, letting the market tell you which one should be triggered.
For short-term traders: Volatility is currently high (daily range can reach $1,500–$2,500). Tight risk control matters more than directional judgment. Whether going long or short, you must set a clear stop-loss level, and the risk exposure per trade should not exceed 2–3% of principal.
For medium- to long-term investors: The current price (about $64,100 for Bitcoin) is down about 49% from Bitcoin’s historical high of $126,000 in October 2025 and down about 45% from a year ago. From a valuation perspective, Bitcoin has entered a historically “fear zone”—the Fear and Greed Index once fell to 8 in early June, indicating an “extreme fear” state. Historical experience suggests that extreme fear often corresponds to a window for long-term positioning rather than the starting point of a collapse. Long-term holders’ holdings remain near cycle highs, suggesting experienced investors are not following short-term panic selling.
Final advice: In a choppy market with no clear direction, “not doing” is often wiser than “doing wrong.” If price neither reaches your short resistance level nor retraces to your long support level, the best trade is to stay flat and wait. The market never lacks opportunities—what’s missing is discipline to wait for the right moment to appear.
Risk warning: The cryptocurrency market is highly volatile. The strategies discussed in this article are for reference only for technical analysis and do not constitute investment advice. Make prudent decisions based on your own risk tolerance, and set stop-loss orders strictly.#2026足球风潮 #美国错过GENIUS稳定币规则期限 #美国动用301条款针对巴西支付系统 #SpaceX空头持仓达流通量29% #Cardano将于7月19日激活VanRossem升级 $BTC