
星期天-77
18.2k Posts

星期天-77
 Square Verified+
人在星期天,心在Web3 ,财神公会在此,牛市埋伏走起!
3.8K+ Following
90.2K+ Followers
99.4K+ Liked
Posts
All
Quotes
Videos
PINNED
$SOL This week is up 20%, now it’s at the crossroads where you have to decide whether to chase
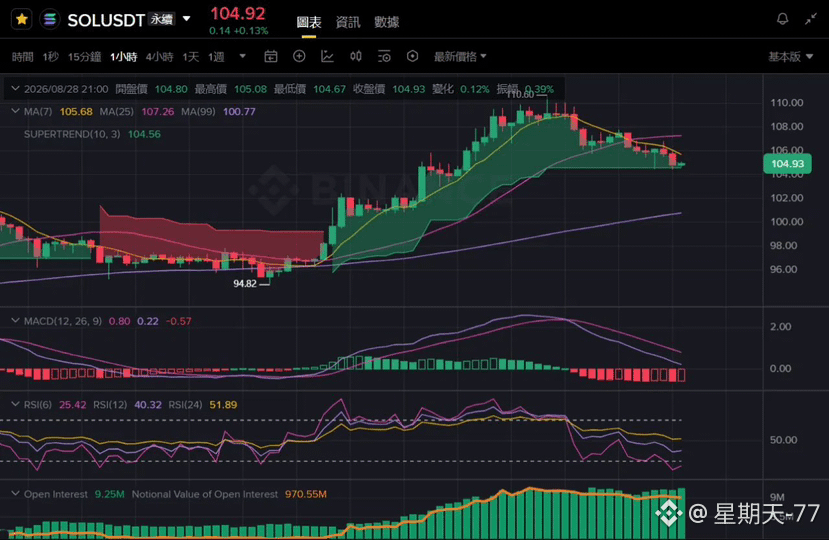
Current price is 104.92. This week’s cumulative gain is 20%. It’s one of the most standout performers in this round of altcoin rebounds. It stepped up from the low of 94.82 to the previous high of 110.60 in a fairly steep, stair-step climb. After that, several consecutive bearish candles pulled back to consolidate around the current 104.
What’s interesting is that the open interest has been steadily rising during this period. From the chart, it’s already climbed to 9.25M units, with a notional value of $970.55M. This suggests the rally wasn’t a “volume-less” spike; there is real capital continuously entering and adding positions. It’s not just a pure sentiment-driven trade.
However, the technicals are already signaling a cooldown: RSI6 is down to 25.42, and RSI12 is 40.32—clearly weaker in the short term. The MACD histogram has flipped from green to red, and momentum has been fading since the peak. Price is currently sitting below MA7 (105.68). The Supertrend line around 104.56 has become the near-term line separating bulls and bears.
This kind of “violent rally followed by a lower-volume pullback” is something that the most aggressively up coins this week commonly go through. It doesn’t mean the trend has ended, but the risk-reward for chasing at current levels has noticeably worsened in the short term. Holding the 104.56 line is the key.
This week is up 20%—do you think SOL can still run up again next week?
For personal opinion only and does not constitute investment advice.
#sol #solana #SOL本周上涨20% #英伟达开盘140分钟成交335亿美元 $BTC $NVDA
Current price is 104.92. This week’s cumulative gain is 20%. It’s one of the most standout performers in this round of altcoin rebounds. It stepped up from the low of 94.82 to the previous high of 110.60 in a fairly steep, stair-step climb. After that, several consecutive bearish candles pulled back to consolidate around the current 104.
What’s interesting is that the open interest has been steadily rising during this period. From the chart, it’s already climbed to 9.25M units, with a notional value of $970.55M. This suggests the rally wasn’t a “volume-less” spike; there is real capital continuously entering and adding positions. It’s not just a pure sentiment-driven trade.
However, the technicals are already signaling a cooldown: RSI6 is down to 25.42, and RSI12 is 40.32—clearly weaker in the short term. The MACD histogram has flipped from green to red, and momentum has been fading since the peak. Price is currently sitting below MA7 (105.68). The Supertrend line around 104.56 has become the near-term line separating bulls and bears.
This kind of “violent rally followed by a lower-volume pullback” is something that the most aggressively up coins this week commonly go through. It doesn’t mean the trend has ended, but the risk-reward for chasing at current levels has noticeably worsened in the short term. Holding the 104.56 line is the key.
This week is up 20%—do you think SOL can still run up again next week?
For personal opinion only and does not constitute investment advice.
#sol #solana #SOL本周上涨20% #英伟达开盘140分钟成交335亿美元 $BTC $NVDA
PINNED
$BTC Consolidation continues. The KDJ has formed a dead cross
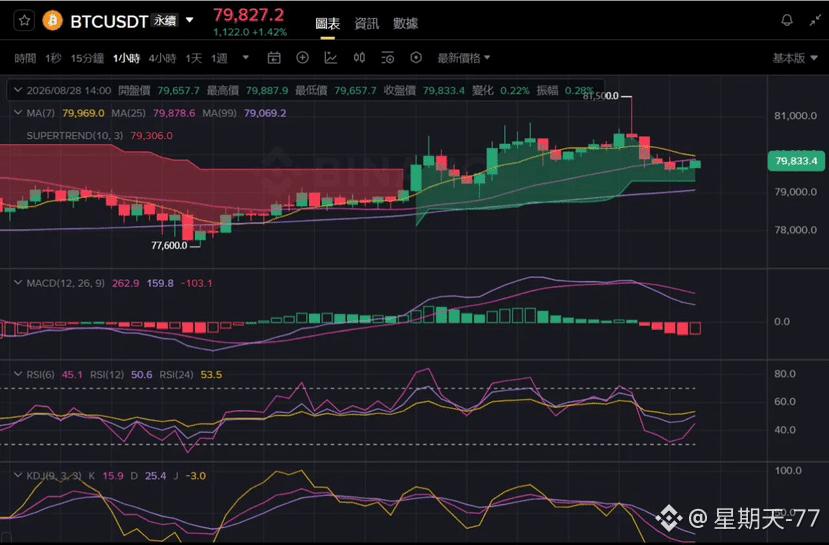
Current price: 79,827.2, up 1.42%. It topped at 81,500.0, then a single bearish candle quickly pulled back, breaking below the 80,000 integer level. It is currently hovering around 79,827.
The technical picture has turned clearly weaker: the KDJ has already formed a dead cross, with K at 15.9, D at 25.4, and J at -3.0. The MACD histogram has narrowed continuously from a high of 159.8 to -103.1; the green bars have turned red, and momentum confirmation suggests fading. RSI6 has also fallen to 45.1, hovering near neutral but slightly weak.
Price is currently sitting below the MA7 (79,969.0). It is ranging and tugging around the MA25 (79,878.6). The Super Trend line is at 79,306.0. As long as this level is not broken downward, the uptrend structure that started from 77,600 is still relatively intact—more like a strong consolidation rather than a trend reversal.
Based on the earlier analyst Ali Charts’ assessment, Bitcoin’s current movement may be forming a fractal structure similar to the late-2022 bottoming phase. The key resistance zone is around $83,000. This recent push upward has not yet reached that area. After the pullback, whether support can hold near 83,000 is worth ongoing observation.
Do you think this pullback is just a shakeout, or a sign of renewed weakness?
This is only my personal opinion and does not constitute investment advice.
#比特币守于7.94万美元 #BTC #WTI原油涨1.6%至84美元 #标普500涨0.7%科技板块涨3.3% $ETH $SOL
Current price: 79,827.2, up 1.42%. It topped at 81,500.0, then a single bearish candle quickly pulled back, breaking below the 80,000 integer level. It is currently hovering around 79,827.
The technical picture has turned clearly weaker: the KDJ has already formed a dead cross, with K at 15.9, D at 25.4, and J at -3.0. The MACD histogram has narrowed continuously from a high of 159.8 to -103.1; the green bars have turned red, and momentum confirmation suggests fading. RSI6 has also fallen to 45.1, hovering near neutral but slightly weak.
Price is currently sitting below the MA7 (79,969.0). It is ranging and tugging around the MA25 (79,878.6). The Super Trend line is at 79,306.0. As long as this level is not broken downward, the uptrend structure that started from 77,600 is still relatively intact—more like a strong consolidation rather than a trend reversal.
Based on the earlier analyst Ali Charts’ assessment, Bitcoin’s current movement may be forming a fractal structure similar to the late-2022 bottoming phase. The key resistance zone is around $83,000. This recent push upward has not yet reached that area. After the pullback, whether support can hold near 83,000 is worth ongoing observation.
Do you think this pullback is just a shakeout, or a sign of renewed weakness?
This is only my personal opinion and does not constitute investment advice.
#比特币守于7.94万美元 #BTC #WTI原油涨1.6%至84美元 #标普500涨0.7%科技板块涨3.3% $ETH $SOL
$SOL callback to 104, yet the position size is still at a high level and hasn’t been reduced; on-chain big whales are also acting in sync
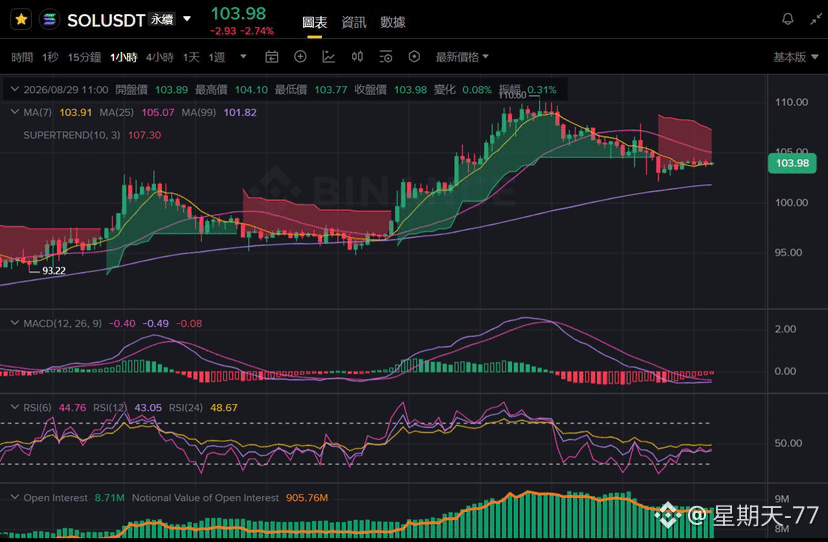
Current price 103.98, down 2.74% over the past 24 hours. After falling all the way from the prior high at 110.60, it broke below MA7 (103.91). Price is trading just below MA25 (105.07), and the Super Trend line at 107.30 is capping from above. From the chart, we can see that this rally that started at 93.22 has gone through two phases of upswing, with one deep pullback in between. Now it’s the second high-level pullback, and the slope is a bit steeper than the prior wave.
Open interest is currently 8.71M coins, with a notional value of $905.76M. From the chart, this round of open interest has been steadily rising to a high level and then holding there; it hasn’t shrunk noticeably alongside the price pullback. This detail is worth noting—if in-market capital were truly panic-selling and exiting, open interest would usually drop rapidly together with price. But right now, the price is down while open interest hasn’t moved much, suggesting most positions are staying on-exchange to watch rather than cutting losses and leaving.
This matches the on-chain whale activity at the same time. According to Lookonchain monitoring, address 5p6zPz withdrew 281,446 SOL from Binance about 9 hours ago, worth approximately $29.68M; another address 3WzfuP withdrew 37,272 SOL from Kraken about 1 hour ago, worth approximately $3.87M. Together, that’s $33.55M. Large on-chain withdrawals typically mean they don’t plan to sell in the short term; they’re more inclined to hold long-term or participate in staking. It’s the same type of signal as the open interest staying elevated on the derivatives side.
On the technical side, the MACD histogram is still negative but narrowing. The DIF line at -0.49 is moving toward the DEA line at -0.08, and the rate at which momentum is fading has slowed down. The RSI three lines are stabilizing in the 43–48 range, which is typical of a sideways base-building pattern—there’s no strong signal for further downside for now.
With positions in the market not being reduced and on-chain whales accumulating, both clues point in the same direction: this pullback looks more like positions waiting through disagreement rather than the start of a trend reversal. Of course, sentiment-based factors are only reference; the real path still depends on whether price can regain and hold above MA7.
After this pullback, do you think SOL will form a more solid bottom?
For personal opinion only and does not constitute investment advice. #sol #solana #SOL本周上涨20% $BTC $ETH
Current price 103.98, down 2.74% over the past 24 hours. After falling all the way from the prior high at 110.60, it broke below MA7 (103.91). Price is trading just below MA25 (105.07), and the Super Trend line at 107.30 is capping from above. From the chart, we can see that this rally that started at 93.22 has gone through two phases of upswing, with one deep pullback in between. Now it’s the second high-level pullback, and the slope is a bit steeper than the prior wave.
Open interest is currently 8.71M coins, with a notional value of $905.76M. From the chart, this round of open interest has been steadily rising to a high level and then holding there; it hasn’t shrunk noticeably alongside the price pullback. This detail is worth noting—if in-market capital were truly panic-selling and exiting, open interest would usually drop rapidly together with price. But right now, the price is down while open interest hasn’t moved much, suggesting most positions are staying on-exchange to watch rather than cutting losses and leaving.
This matches the on-chain whale activity at the same time. According to Lookonchain monitoring, address 5p6zPz withdrew 281,446 SOL from Binance about 9 hours ago, worth approximately $29.68M; another address 3WzfuP withdrew 37,272 SOL from Kraken about 1 hour ago, worth approximately $3.87M. Together, that’s $33.55M. Large on-chain withdrawals typically mean they don’t plan to sell in the short term; they’re more inclined to hold long-term or participate in staking. It’s the same type of signal as the open interest staying elevated on the derivatives side.
On the technical side, the MACD histogram is still negative but narrowing. The DIF line at -0.49 is moving toward the DEA line at -0.08, and the rate at which momentum is fading has slowed down. The RSI three lines are stabilizing in the 43–48 range, which is typical of a sideways base-building pattern—there’s no strong signal for further downside for now.
With positions in the market not being reduced and on-chain whales accumulating, both clues point in the same direction: this pullback looks more like positions waiting through disagreement rather than the start of a trend reversal. Of course, sentiment-based factors are only reference; the real path still depends on whether price can regain and hold above MA7.
After this pullback, do you think SOL will form a more solid bottom?
For personal opinion only and does not constitute investment advice. #sol #solana #SOL本周上涨20% $BTC $ETH
Machi Big Brother’s long positions keep being topped up, but this time he also absorbed a real loss
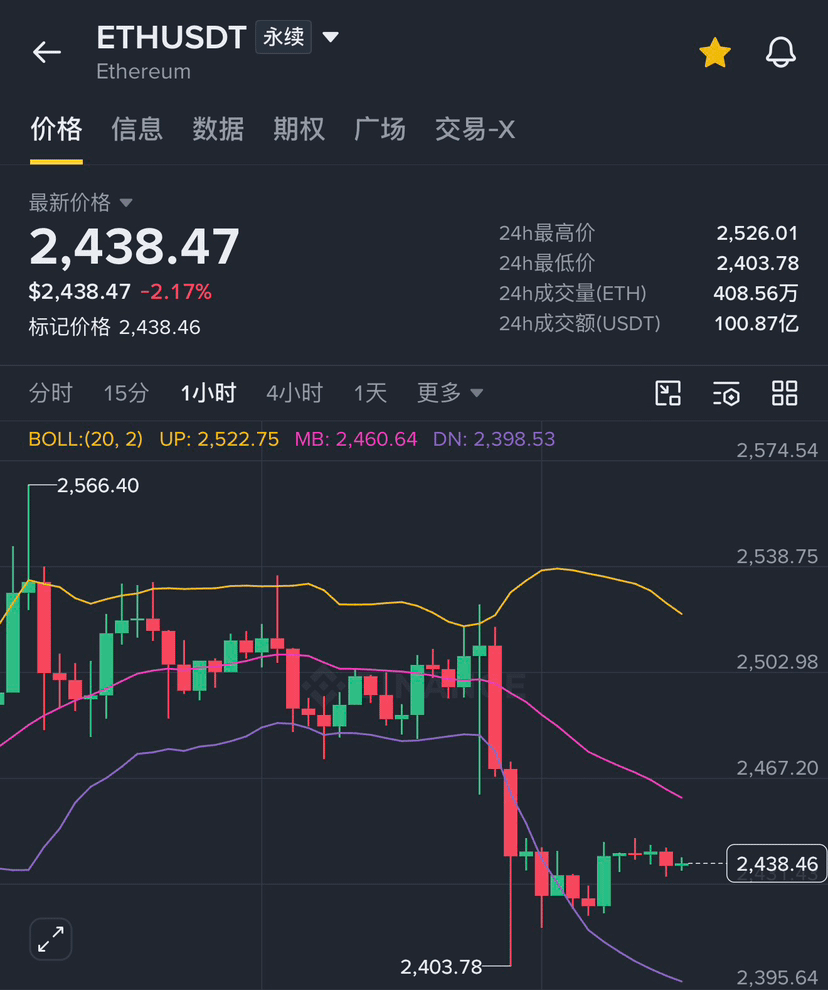
According to monitoring by TradingBeats (formerly Hyperinsight), “Machi Big Brother” Huang Licheng’s address still currently holds about 41,000 ETH, worth roughly $100 million—making it the largest on-chain ETH long position by current size. As the market pulled back, Machi about 7 hours ago closed part of his ETH longs, realizing a loss of approximately $1.96 million.
His wallet’s main holdings currently include: 41,000 ETH ($ETH ) (about $100.01 million), 75,000 HYPE (about $6.03 million), and 45 BTC (about $3.5 million). Combined, the three positions are worth more than $110 million—one of the few on-chain whales whose size is large enough to be analyzed in isolation.
This is the same ongoing thread as what was mentioned earlier about him “slightly reducing ETH longs to take profit,” but this time the roles reverse—from taking profit to cutting at a loss. Last time he actively cashed out; the remaining position still had about $1.59 million in unrealized profit. This time, however, it was the market pullback that forced him to trim, and the loss was a concrete $1.96 million. Put together, these two moves show that even the largest on-chain long holder isn’t “winning forever.” Position management still has to follow market conditions.
Worth noting is that he did not clear his ETH holdings. His core long position of 41,000 ETH remains, indicating this is not a turning point in trend judgment—it’s more like routine adjustments to a leveraged position: controlling risk exposure by closing part of the position, rather than outright going bearish.
This also indirectly reinforces a principle: the size of holdings by on-chain whales and the “making a fortune” myths they spark can easily create the illusion of “copying trades guarantees easy profits.” But the normal state for leveraged longs is that they go up and down. Stories of surviving 500 liquidations and turning around are rare; in most cases, positions like this experience the same kind of unrealized profit-and-loss fluctuations as ordinary traders.
#麻吉 #ETH #黄金8月上涨约14% #BTC #SOL本周上涨20% $BTC $SOL
According to monitoring by TradingBeats (formerly Hyperinsight), “Machi Big Brother” Huang Licheng’s address still currently holds about 41,000 ETH, worth roughly $100 million—making it the largest on-chain ETH long position by current size. As the market pulled back, Machi about 7 hours ago closed part of his ETH longs, realizing a loss of approximately $1.96 million.
His wallet’s main holdings currently include: 41,000 ETH ($ETH ) (about $100.01 million), 75,000 HYPE (about $6.03 million), and 45 BTC (about $3.5 million). Combined, the three positions are worth more than $110 million—one of the few on-chain whales whose size is large enough to be analyzed in isolation.
This is the same ongoing thread as what was mentioned earlier about him “slightly reducing ETH longs to take profit,” but this time the roles reverse—from taking profit to cutting at a loss. Last time he actively cashed out; the remaining position still had about $1.59 million in unrealized profit. This time, however, it was the market pullback that forced him to trim, and the loss was a concrete $1.96 million. Put together, these two moves show that even the largest on-chain long holder isn’t “winning forever.” Position management still has to follow market conditions.
Worth noting is that he did not clear his ETH holdings. His core long position of 41,000 ETH remains, indicating this is not a turning point in trend judgment—it’s more like routine adjustments to a leveraged position: controlling risk exposure by closing part of the position, rather than outright going bearish.
This also indirectly reinforces a principle: the size of holdings by on-chain whales and the “making a fortune” myths they spark can easily create the illusion of “copying trades guarantees easy profits.” But the normal state for leveraged longs is that they go up and down. Stories of surviving 500 liquidations and turning around are rare; in most cases, positions like this experience the same kind of unrealized profit-and-loss fluctuations as ordinary traders.
#麻吉 #ETH #黄金8月上涨约14% #BTC #SOL本周上涨20% $BTC $SOL

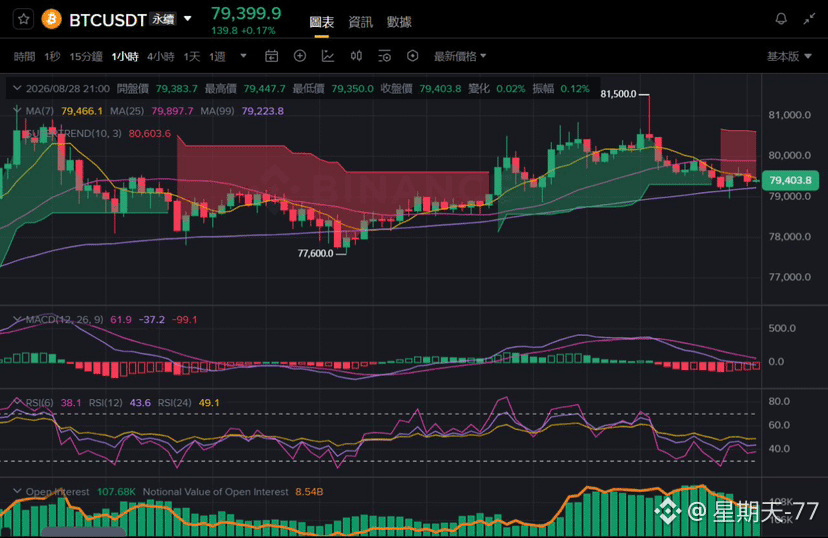
$BTC 踩整理,holdings volume surges against the trend
Current price 79,399.9, up 0.17% over the past 24 hours. The high touched 81,500.0, then followed by consecutive pullbacks. It is currently consolidating around 79,399 with an amplitude of 0.12%, which is a narrow-range oscillation.
This round started from 77,600. Along the way, there were two instances of surge followed by a pullback. MA7 (79,466.1) is currently running below MA25 (79,897.7). The short-term moving averages have not yet managed to regain the medium-term ones, leaving the price caught in a tug-of-war between them.
Technically, the outlook is weak: the MACD histogram is -99.1. The DIF line at -37.2 has fallen below the DEA line at 61.9, and momentum contraction is clearly evident. RSI6 is only 38.1, while RSI12 is 43.6—short-term pressure remains.
However, the derivatives market tells a different story. Open Interest is 107.68K contracts, with a notional value of $8.54 billion. Judging by the trend, Open Interest has been steadily rising and has not shrunk as price has pulled back. This combination of "price stalling higher while Open Interest increases" usually suggests that in-market capital is not withdrawing significantly; instead, it tends to imply turnover at higher levels rather than panic liquidation.
The super trend line at 80,603.6 is currently capping above the price. As long as it cannot reclaim this level, the probability of near-term range-bound consolidation is higher.
For personal opinion only and does not constitute investment advice.
#BTC #英伟达开盘140分钟成交335亿美元 #台股TAIEX受芯片股带动重返46500点 #ETH $ETH $NVDA
Current price 79,399.9, up 0.17% over the past 24 hours. The high touched 81,500.0, then followed by consecutive pullbacks. It is currently consolidating around 79,399 with an amplitude of 0.12%, which is a narrow-range oscillation.
This round started from 77,600. Along the way, there were two instances of surge followed by a pullback. MA7 (79,466.1) is currently running below MA25 (79,897.7). The short-term moving averages have not yet managed to regain the medium-term ones, leaving the price caught in a tug-of-war between them.
Technically, the outlook is weak: the MACD histogram is -99.1. The DIF line at -37.2 has fallen below the DEA line at 61.9, and momentum contraction is clearly evident. RSI6 is only 38.1, while RSI12 is 43.6—short-term pressure remains.
However, the derivatives market tells a different story. Open Interest is 107.68K contracts, with a notional value of $8.54 billion. Judging by the trend, Open Interest has been steadily rising and has not shrunk as price has pulled back. This combination of "price stalling higher while Open Interest increases" usually suggests that in-market capital is not withdrawing significantly; instead, it tends to imply turnover at higher levels rather than panic liquidation.
The super trend line at 80,603.6 is currently capping above the price. As long as it cannot reclaim this level, the probability of near-term range-bound consolidation is higher.
For personal opinion only and does not constitute investment advice.
#BTC #英伟达开盘140分钟成交335亿美元 #台股TAIEX受芯片股带动重返46500点 #ETH $ETH $NVDA
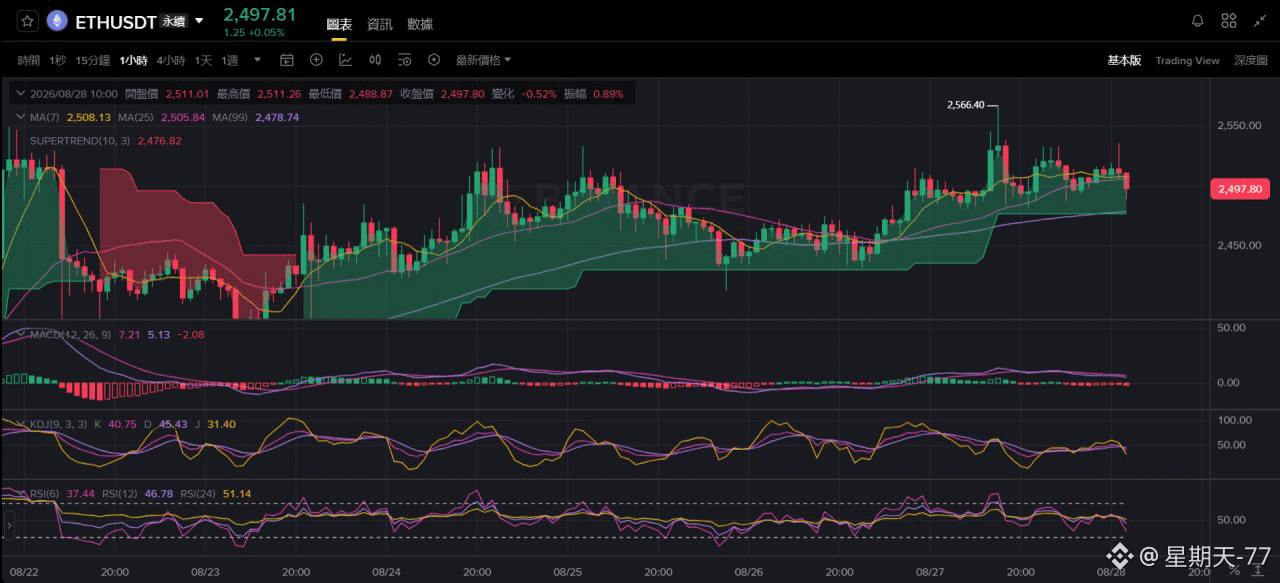
$ETH current price $2497.81, 24h change +0.05%. After spiking to 2566.40, it pulled back. The hourly chart has entered a high-range consolidation and pullback phase.
Indicator breakdown
• Moving Averages & Supertrend: MA7=2508.13, MA25=2505.84, MA99=2478.74; Supertrend support at 2476.82. The current price has fallen below the short-term moving average, raising near-term pressure. Supertrend and MA99 form a key support zone.
• MACD: MACD value 7.21, signal line 5.13, histogram difference -2.08. The red histogram is converging and weakening; bullish momentum is gradually fading, with potential signs of a death cross.
• KDJ: K=40.75, D=45.43, J=31.40. The three lines are diverging downward. A short-term pullback trend has started; it has not entered oversold yet, so there is still room to drop.
• RSI: RSI(6)=37.44, RSI(12)=46.78, RSI(24)=51.14. The short-cycle RSI is falling; bullish strength is weakening and price is in a neutral-to-weak range.
Market conclusion and trading reference
Upper resistance: previous high 2566.40, short-term moving average 2508;
Lower support: Supertrend 2476.82, MA99 at 2478.74.
After the spike, bullish momentum has weakened. On the hourly timeframe, a pullback-and-repair phase has started. The overall larger uptrend has not fully turned bad, but the short term is under pressure.
• No position: Don’t rush to bottom-fish. Wait for a pullback and watch for stabilization signals around the 2476–2478 support zone before considering any opportunity.
• In position: 2476 is an important line of defense. If it holds, you can continue to hold and bet on a rebound. If there is an effective breakdown of this level, it is recommended to reduce exposure to avoid the risk of further pullback.
This content is only a technical analysis interpretation and does not constitute investment advice.
#ETH #比特币升破8万美元创三月新高 #比特币守于7.94万美元 $SOL $BTC
Indicator breakdown
• Moving Averages & Supertrend: MA7=2508.13, MA25=2505.84, MA99=2478.74; Supertrend support at 2476.82. The current price has fallen below the short-term moving average, raising near-term pressure. Supertrend and MA99 form a key support zone.
• MACD: MACD value 7.21, signal line 5.13, histogram difference -2.08. The red histogram is converging and weakening; bullish momentum is gradually fading, with potential signs of a death cross.
• KDJ: K=40.75, D=45.43, J=31.40. The three lines are diverging downward. A short-term pullback trend has started; it has not entered oversold yet, so there is still room to drop.
• RSI: RSI(6)=37.44, RSI(12)=46.78, RSI(24)=51.14. The short-cycle RSI is falling; bullish strength is weakening and price is in a neutral-to-weak range.
Market conclusion and trading reference
Upper resistance: previous high 2566.40, short-term moving average 2508;
Lower support: Supertrend 2476.82, MA99 at 2478.74.
After the spike, bullish momentum has weakened. On the hourly timeframe, a pullback-and-repair phase has started. The overall larger uptrend has not fully turned bad, but the short term is under pressure.
• No position: Don’t rush to bottom-fish. Wait for a pullback and watch for stabilization signals around the 2476–2478 support zone before considering any opportunity.
• In position: 2476 is an important line of defense. If it holds, you can continue to hold and bet on a rebound. If there is an effective breakdown of this level, it is recommended to reduce exposure to avoid the risk of further pullback.
This content is only a technical analysis interpretation and does not constitute investment advice.
#ETH #比特币升破8万美元创三月新高 #比特币守于7.94万美元 $SOL $BTC
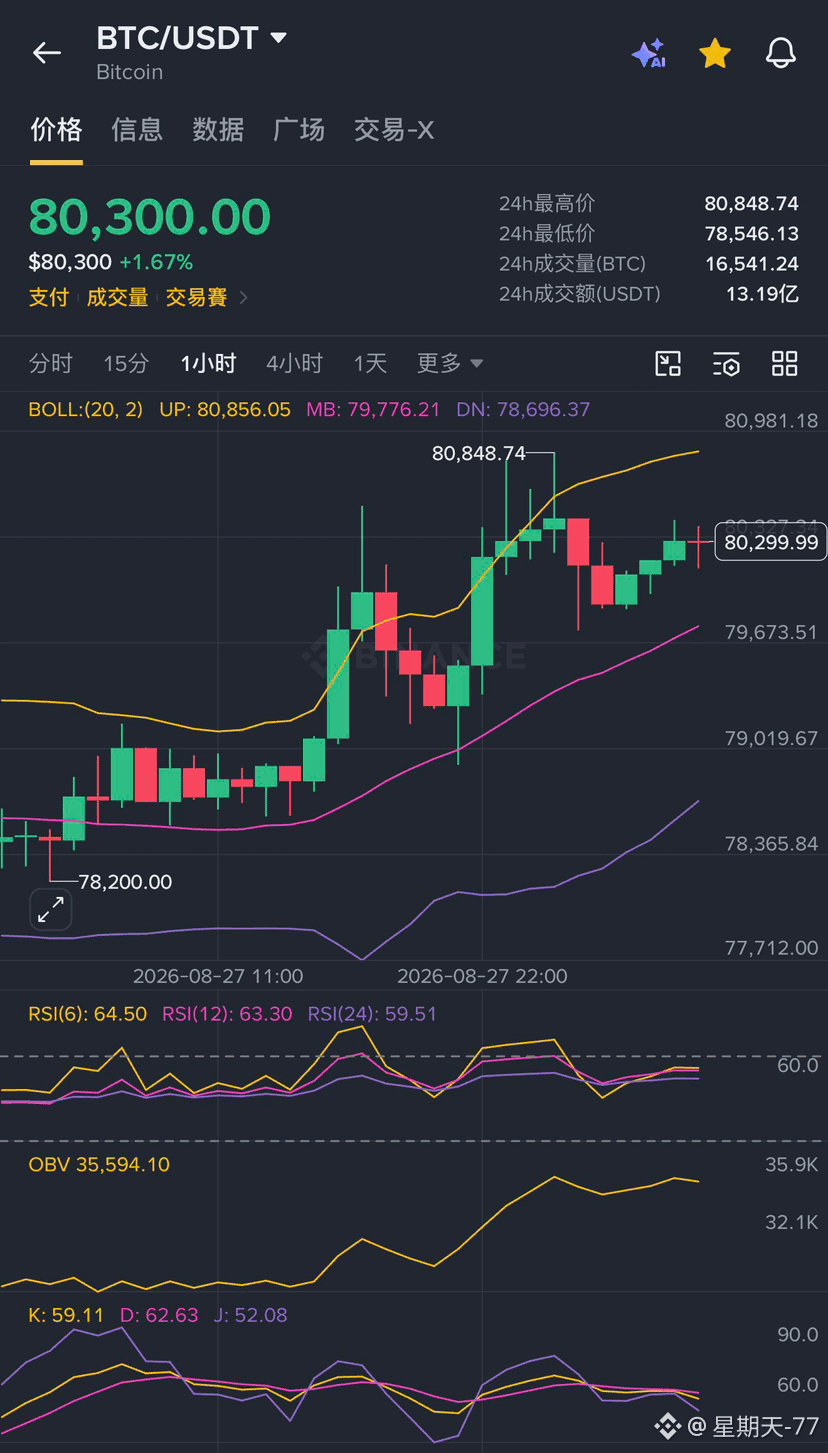
$BTC Holding steady at 80,000; after pushing up to 80,848 and then pulling back to consolidate
Current price: 80,300.00. In the past 24 hours it’s up 1.67%. The high reached 80,848.74, and the low was 78,546.13. Compared with the previous breakout above 80,000, this time the move is the second round of rally after the price has stabilized above 80,000—rising in a step-like climb from 78,200 up to 80,848, then pulling back moderately to where it is now, with no trend of rapidly dumping back below 80,000.
The technical picture is mildly neutral-to-strong: RSI(6) is 64.50. KDJ’s K value is 59.11 and J value is 52.08—both are in a neutral zone, with no overbought pressure. OBV has been climbing steadily to 35,594, indicating that this rally is supported by real trading volume rather than a fake spike. Price is holding above the BOLL middle band at 79,776.21, and the short-term structure remains bullish.
This movement matches what we discussed earlier from the HODL15Capital data: "there were lots of sell orders stacked near 80,000 that had been sitting for nearly a hundred days." Now the price has been trading above 80,000 for some time, suggesting some of those sell orders may be getting absorbed. However, around the upper band near 80,856 is still a key near-term level that needs to be broken through.
Do you think BTC can make a strong push and surge all the way up to 82,500, the thicker sell wall there?
For personal opinion only; not investment advice.
#btc #美元创近四周最大涨幅 #中国反对美国拟加征7.5%关税 #韩国央行加息25基点至3% $ETH $SOL
Current price: 80,300.00. In the past 24 hours it’s up 1.67%. The high reached 80,848.74, and the low was 78,546.13. Compared with the previous breakout above 80,000, this time the move is the second round of rally after the price has stabilized above 80,000—rising in a step-like climb from 78,200 up to 80,848, then pulling back moderately to where it is now, with no trend of rapidly dumping back below 80,000.
The technical picture is mildly neutral-to-strong: RSI(6) is 64.50. KDJ’s K value is 59.11 and J value is 52.08—both are in a neutral zone, with no overbought pressure. OBV has been climbing steadily to 35,594, indicating that this rally is supported by real trading volume rather than a fake spike. Price is holding above the BOLL middle band at 79,776.21, and the short-term structure remains bullish.
This movement matches what we discussed earlier from the HODL15Capital data: "there were lots of sell orders stacked near 80,000 that had been sitting for nearly a hundred days." Now the price has been trading above 80,000 for some time, suggesting some of those sell orders may be getting absorbed. However, around the upper band near 80,856 is still a key near-term level that needs to be broken through.
Do you think BTC can make a strong push and surge all the way up to 82,500, the thicker sell wall there?
For personal opinion only; not investment advice.
#btc #美元创近四周最大涨幅 #中国反对美国拟加征7.5%关税 #韩国央行加息25基点至3% $ETH $SOL
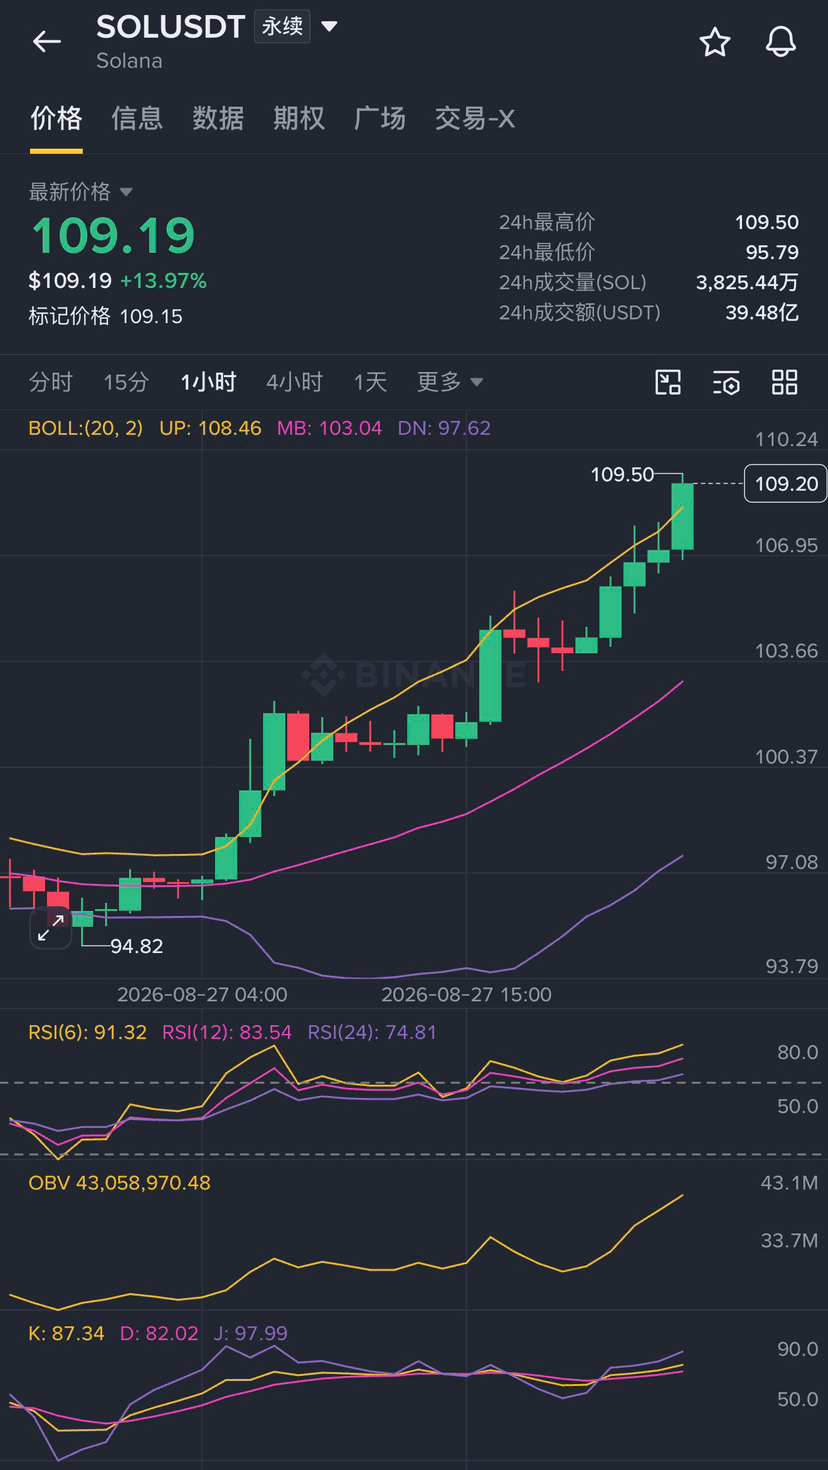
$SOL current price $109.19, 24h change +13.97%, 24h trading volume $3.948B (USDT). On an hourly timeframe, the uptrend remains strongly accelerated. The price holds above the upper Bollinger Band, and the momentum-driven bullish rally is continuing.
Indicator breakdown
• Bollinger Bands: Upper band 108.46, middle band 103.04, lower band 97.62. The price keeps breaking above the upper band; the channel has opened upward significantly. The upper band has turned into a short-term support level. The middle band at 103.04 is an important defense level for this leg up.
• RSI: RSI(6)=91.32, RSI(12)=83.54, RSI(24)=74.81. RSI-6 has entered the severe overbought zone. Bullish momentum is releasing at high levels, and the risk of a short-term pullback has increased significantly.
• OBV: OBV continues to make new highs. During the uptrend, volume keeps supporting the move, and buyers’ intent remains strong.
• KDJ: K=87.34, D=82.02, J=97.99. The J value is in an extremely overbought area. The indicator is seriously “flattened” (losing responsiveness), and a pullback/mean-reversion repair from a high level is possible at any time.
Market conclusion & trading reference
Resistance above: 24h high 109.50;
Supports below: 108.46 (upper Bollinger band), 103.04 (middle Bollinger band), 97.62 (lower Bollinger band).
The overall trend is clearly bullish, but short-term indicators are fully in severe overbought conditions, making the risk-reward of chasing very poor.
• No position: Do not chase. Wait for a pullback and digestion. Focus on reassessing opportunities after price stabilizes around 108.46 and 103.04.
• In position: Use the upper Bollinger band at 108.46 as the short-term defensive level. As long as it holds, you can continue to hold to bet on new highs. If there is an effective breakdown below it, it’s recommended to reduce exposure. Below, focus on the middle band area at 103.04.
This content is only a technical analysis interpretation and does not constitute investment advice.
#solana #sol #美元创近四周最大涨幅 #XRP领跌加密市场跌近7% $BTC $XRP
Indicator breakdown
• Bollinger Bands: Upper band 108.46, middle band 103.04, lower band 97.62. The price keeps breaking above the upper band; the channel has opened upward significantly. The upper band has turned into a short-term support level. The middle band at 103.04 is an important defense level for this leg up.
• RSI: RSI(6)=91.32, RSI(12)=83.54, RSI(24)=74.81. RSI-6 has entered the severe overbought zone. Bullish momentum is releasing at high levels, and the risk of a short-term pullback has increased significantly.
• OBV: OBV continues to make new highs. During the uptrend, volume keeps supporting the move, and buyers’ intent remains strong.
• KDJ: K=87.34, D=82.02, J=97.99. The J value is in an extremely overbought area. The indicator is seriously “flattened” (losing responsiveness), and a pullback/mean-reversion repair from a high level is possible at any time.
Market conclusion & trading reference
Resistance above: 24h high 109.50;
Supports below: 108.46 (upper Bollinger band), 103.04 (middle Bollinger band), 97.62 (lower Bollinger band).
The overall trend is clearly bullish, but short-term indicators are fully in severe overbought conditions, making the risk-reward of chasing very poor.
• No position: Do not chase. Wait for a pullback and digestion. Focus on reassessing opportunities after price stabilizes around 108.46 and 103.04.
• In position: Use the upper Bollinger band at 108.46 as the short-term defensive level. As long as it holds, you can continue to hold to bet on new highs. If there is an effective breakdown below it, it’s recommended to reduce exposure. Below, focus on the middle band area at 103.04.
This content is only a technical analysis interpretation and does not constitute investment advice.
#solana #sol #美元创近四周最大涨幅 #XRP领跌加密市场跌近7% $BTC $XRP
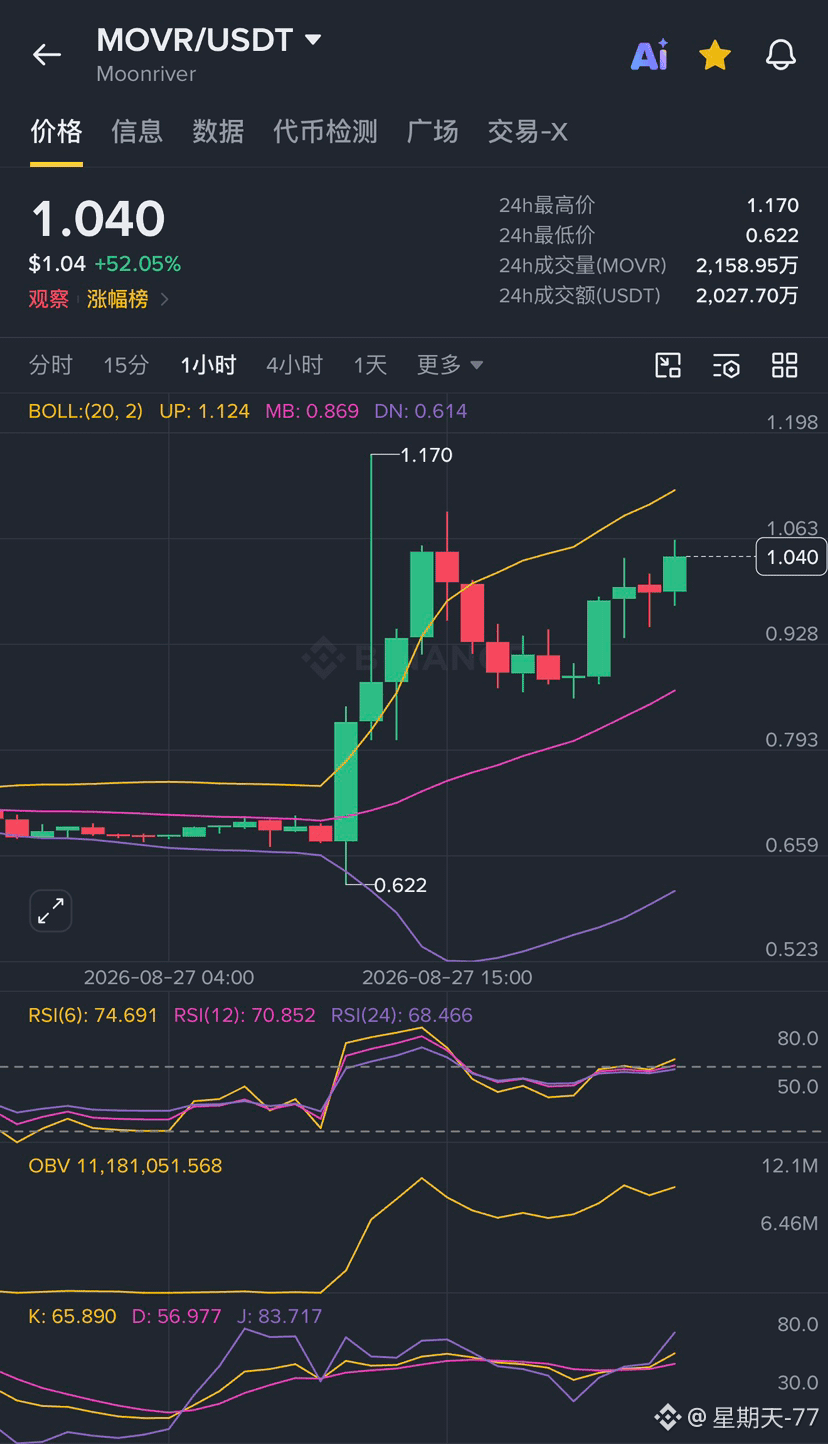
$MOVR Current price $1.040, 24h change +52.05%, 24h trading volume 20.27770 million USDT. After a violent surge from the lower range, the price entered consolidation at higher levels. Once the pullback is completed, it repaired and moved upward again.
Indicator breakdown
• Bollinger Bands: Upper band 1.124, middle band 0.869, lower band 0.614. Price holds above the middle band; there is still room to the upper band. The middle band at 0.869 is the key support for this upswing.
• RSI: RSI(6)=74.691, RSI(12)=70.852, RSI(24)=68.466. RSI6 is in the overbought zone. Short-term long momentum is strong, but there is pressure for a pullback to digest.
• OBV: OBV rises sharply. During the peak-and-retrace phase, it did not show any obvious decline, indicating strong fund follow-through.
• KDJ: K=65.890, D=56.977, J=83.717. The J value rises again; bulls are warming up, but it is near the overbought area—watch for a high-level pullback.
Market outlook and trading references
Resistance overhead: Bollinger upper band 1.124, 24h high 1.170;
Support below: Bollinger middle band 0.869, intraday low 0.622.
After a breakout surge on the hourly timeframe, it completed a pullback-and-washout cycle and rebounded again. Volume remains relatively strong, but multiple indicators have returned to the overbought zone, so chasing is relatively risky.
• No position: Do not chase. Wait for a pullback near 0.869 and observe how strong the support is before considering an entry.
• With position: Use the Bollinger middle band at 0.869 as the defense line. If it holds, you can continue to probe the overhead resistance. If it breaks down effectively, reduce positions in time to avoid giving back profits.
This content is only a technical analysis interpretation and does not constitute investment advice.
#movr #MOVR/USDT #美元创近四周最大涨幅 $BTC $SOL
Indicator breakdown
• Bollinger Bands: Upper band 1.124, middle band 0.869, lower band 0.614. Price holds above the middle band; there is still room to the upper band. The middle band at 0.869 is the key support for this upswing.
• RSI: RSI(6)=74.691, RSI(12)=70.852, RSI(24)=68.466. RSI6 is in the overbought zone. Short-term long momentum is strong, but there is pressure for a pullback to digest.
• OBV: OBV rises sharply. During the peak-and-retrace phase, it did not show any obvious decline, indicating strong fund follow-through.
• KDJ: K=65.890, D=56.977, J=83.717. The J value rises again; bulls are warming up, but it is near the overbought area—watch for a high-level pullback.
Market outlook and trading references
Resistance overhead: Bollinger upper band 1.124, 24h high 1.170;
Support below: Bollinger middle band 0.869, intraday low 0.622.
After a breakout surge on the hourly timeframe, it completed a pullback-and-washout cycle and rebounded again. Volume remains relatively strong, but multiple indicators have returned to the overbought zone, so chasing is relatively risky.
• No position: Do not chase. Wait for a pullback near 0.869 and observe how strong the support is before considering an entry.
• With position: Use the Bollinger middle band at 0.869 as the defense line. If it holds, you can continue to probe the overhead resistance. If it breaks down effectively, reduce positions in time to avoid giving back profits.
This content is only a technical analysis interpretation and does not constitute investment advice.
#movr #MOVR/USDT #美元创近四周最大涨幅 $BTC $SOL
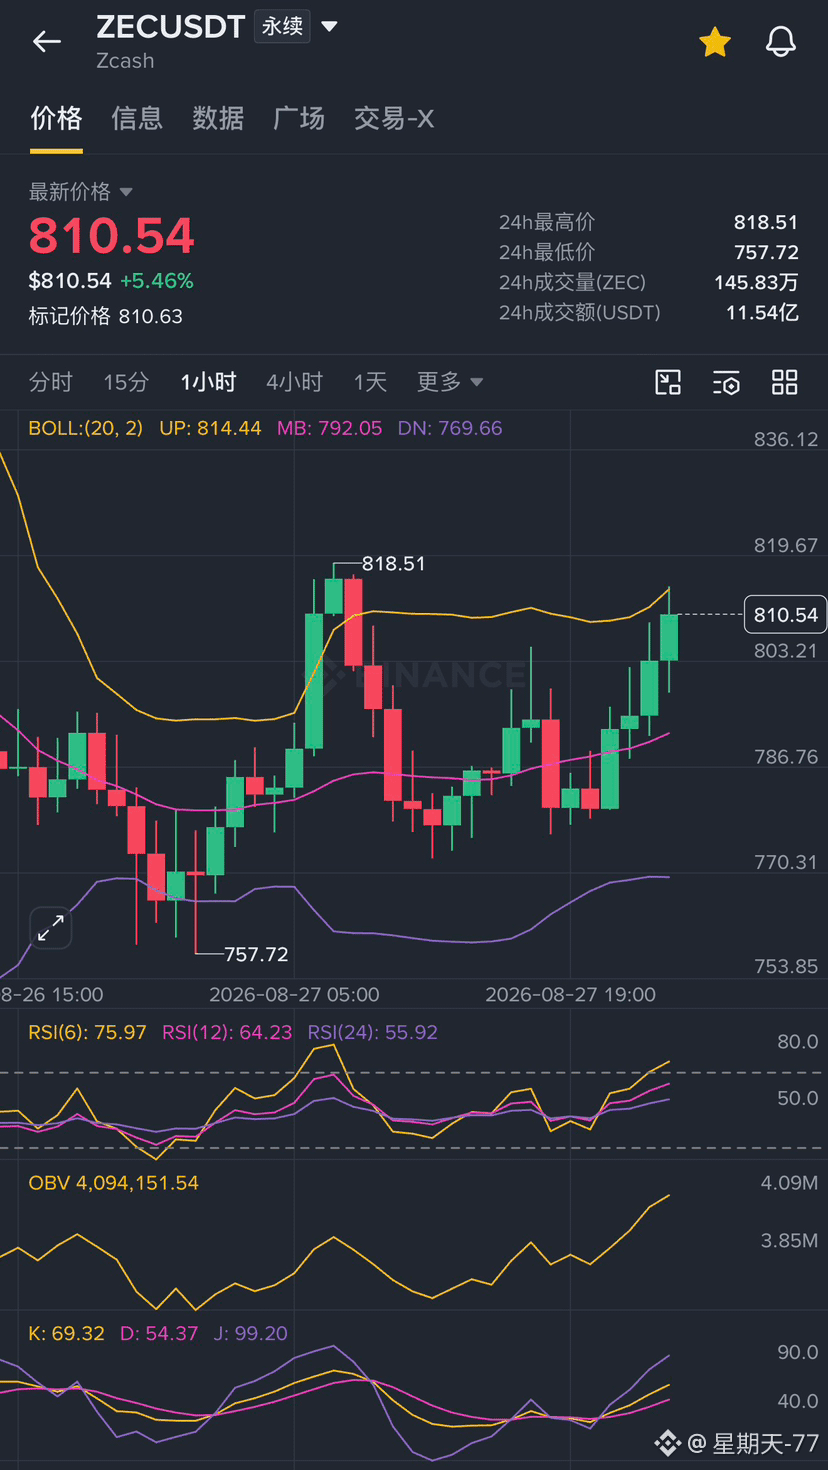
$ZEC Order book details: OBV continues to rise, indicating this rebound is backed by real buying
Current price 810.54, up 5.46% in 24 hours; highest 818.51, lowest 757.72. Combined with the earlier point about Grayscale’s “undervaluation” thesis, there’s a more noteworthy detail in this market move—OBV (On-Balance Volume) has been steadily climbing from a low near 757 to now about 4.09 million. As the price rebounds, volume is expanding in sync; it’s not a low-volume rebound. This suggests the move isn’t just a hollow lift.
Price has already reclaimed the BOLL midline at 792.05 and is edging toward the upper band at 814.44. KDJ shows K at 69.32 and J at 99.20—short-term momentum is fairly strong, but it hasn’t become excessively dull/overstretched yet. RSI6 is 75.97, while RSI24 is only 55.92, indicating this rally is driven more by short-term capital pushing, and the longer-term trend is still in a repair phase; it hasn’t overheated to a level that warrants serious caution.
Grayscale’s logic that “ZEC’s market cap is still not enough to reach 1% of Bitcoin” aligns with the current OBV strength on the chart, adding a bit of capital-flow support to the “undervaluation” view. However, Grayscale has also reminded that high volatility is normal for ZEC—don’t expect it to rise in a straight line.
For personal opinion only and does not constitute investment advice. #ZECUSDT #zec #美元创近四周最大涨幅 #XRP领跌加密市场跌近7%
$BTC $ETH
Current price 810.54, up 5.46% in 24 hours; highest 818.51, lowest 757.72. Combined with the earlier point about Grayscale’s “undervaluation” thesis, there’s a more noteworthy detail in this market move—OBV (On-Balance Volume) has been steadily climbing from a low near 757 to now about 4.09 million. As the price rebounds, volume is expanding in sync; it’s not a low-volume rebound. This suggests the move isn’t just a hollow lift.
Price has already reclaimed the BOLL midline at 792.05 and is edging toward the upper band at 814.44. KDJ shows K at 69.32 and J at 99.20—short-term momentum is fairly strong, but it hasn’t become excessively dull/overstretched yet. RSI6 is 75.97, while RSI24 is only 55.92, indicating this rally is driven more by short-term capital pushing, and the longer-term trend is still in a repair phase; it hasn’t overheated to a level that warrants serious caution.
Grayscale’s logic that “ZEC’s market cap is still not enough to reach 1% of Bitcoin” aligns with the current OBV strength on the chart, adding a bit of capital-flow support to the “undervaluation” view. However, Grayscale has also reminded that high volatility is normal for ZEC—don’t expect it to rise in a straight line.
For personal opinion only and does not constitute investment advice. #ZECUSDT #zec #美元创近四周最大涨幅 #XRP领跌加密市场跌近7%
$BTC $ETH
Relic

舍利子 yunyun
·
--
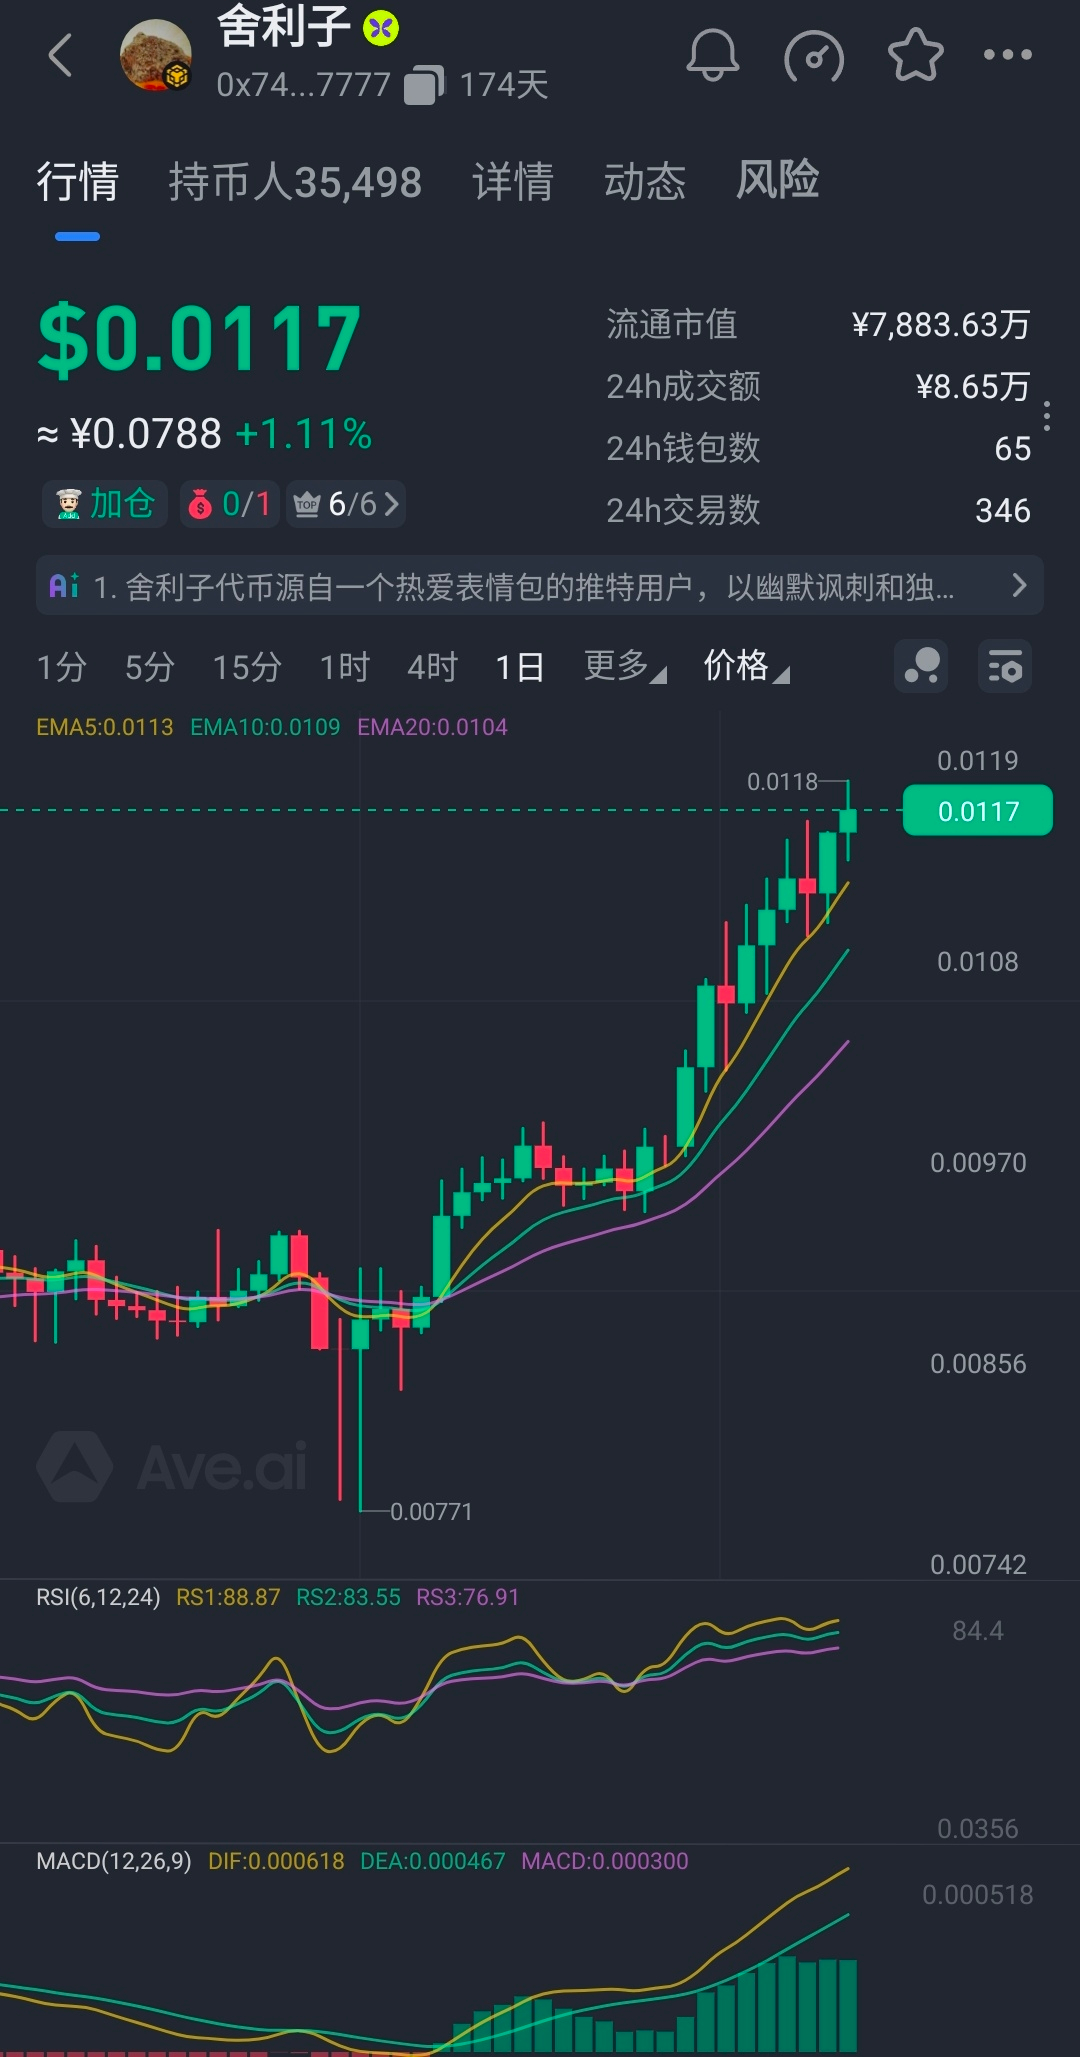
【Sarira】The true appeal of Sarira is right here:
It has cultural roots, not hollow narratives; it has a strong community, not a one-person fight; it has a long-term vision, not a short-term game!
Built on belief and consensus, not on emotional buying and selling.
Maybe even to this day, many people still haven’t truly come to understand【Sarira】Sarira
But many real opportunities often appear when most people haven’t even started paying serious attention yet!!
Sarira is not just as simple as “holding one coin,”
It’s about becoming part of a shared belief—an ever-growing, increasingly powerful force of consensus.
Commonly known as the Bitcoin of young people, one day on-chain equals ten years in the real world. If you want to shine, if you want the sun, if you want to reach the top, it depends on how many【Sarira】tokens you’ve accumulated ✊✊✊
It has cultural roots, not hollow narratives; it has a strong community, not a one-person fight; it has a long-term vision, not a short-term game!
Built on belief and consensus, not on emotional buying and selling.
Maybe even to this day, many people still haven’t truly come to understand【Sarira】Sarira
But many real opportunities often appear when most people haven’t even started paying serious attention yet!!
Sarira is not just as simple as “holding one coin,”
It’s about becoming part of a shared belief—an ever-growing, increasingly powerful force of consensus.
Commonly known as the Bitcoin of young people, one day on-chain equals ten years in the real world. If you want to shine, if you want the sun, if you want to reach the top, it depends on how many【Sarira】tokens you’ve accumulated ✊✊✊


Verified
When reading the whitepaper, everyone’s attention is basically on the question of “what contracts are on this chain,” and few people notice a syntax-level detail: when talking about different contracts, the tenses used are actually different.
Section 6.2 of the whitepaper covers “genesis contracts,” namely the transfer contract and the stake contract. These are deployed at the very initial launch of the Dusk blockchain. In the original text, the present tense is used to describe what they are doing— the transfer contract manages DUSK transfers and deducts gas fees, while the stake contract manages the staking process, verifies the minimum staking amount, and locks the token vesting period. Then in Section 6.3, when discussing the Zedger contract and the Citadel contract, the wording changes to phrases like “these contracts are designed to be deployed on the Dusk blockchain” and “this contract will allow users to obtain permissions”—and throughout the entire section, it is written in the future tense, describing what the plans are, not what is currently running.
This grammar detail, I think, is worth more thought than it might seem at first glance. The two genesis contracts for transfer and staking are core infrastructure that must exist the moment this chain launches its mainnet. Without them, the chain can’t even get basic transfers and consensus participation running—so they’re described in the “present tense.” Zedger and Citadel, on the other hand, are contracts the whitepaper itself positions as being “for long-term functional evolution and future applications.” They aren’t necessities for the initial launch, so the “will” future tense is used. In other words, functions like securities settlement and identity credentials—often presented as Dusk’s core selling points—are, in the tense choices of the original whitepaper text, actually categorized as “planned,” not “already built in.” This differs from many secondary retellings, including my own previous articles, which described them as established facts.
My own view is that when using a technical document as a source of truth, even details like whether “this sentence” uses present or future tense are worth checking. Tense often tells us more clearly whether a capability is “already in existence” versus “still being planned,” than the wording itself.
#dusk $DUSK @Dusk
What do you think—when judging whether a technical capability has already been implemented, should we focus more on the specific wording in the original whitepaper, or on whether there are supporting real product pages?
Section 6.2 of the whitepaper covers “genesis contracts,” namely the transfer contract and the stake contract. These are deployed at the very initial launch of the Dusk blockchain. In the original text, the present tense is used to describe what they are doing— the transfer contract manages DUSK transfers and deducts gas fees, while the stake contract manages the staking process, verifies the minimum staking amount, and locks the token vesting period. Then in Section 6.3, when discussing the Zedger contract and the Citadel contract, the wording changes to phrases like “these contracts are designed to be deployed on the Dusk blockchain” and “this contract will allow users to obtain permissions”—and throughout the entire section, it is written in the future tense, describing what the plans are, not what is currently running.
This grammar detail, I think, is worth more thought than it might seem at first glance. The two genesis contracts for transfer and staking are core infrastructure that must exist the moment this chain launches its mainnet. Without them, the chain can’t even get basic transfers and consensus participation running—so they’re described in the “present tense.” Zedger and Citadel, on the other hand, are contracts the whitepaper itself positions as being “for long-term functional evolution and future applications.” They aren’t necessities for the initial launch, so the “will” future tense is used. In other words, functions like securities settlement and identity credentials—often presented as Dusk’s core selling points—are, in the tense choices of the original whitepaper text, actually categorized as “planned,” not “already built in.” This differs from many secondary retellings, including my own previous articles, which described them as established facts.
My own view is that when using a technical document as a source of truth, even details like whether “this sentence” uses present or future tense are worth checking. Tense often tells us more clearly whether a capability is “already in existence” versus “still being planned,” than the wording itself.
#dusk $DUSK @Dusk
What do you think—when judging whether a technical capability has already been implemented, should we focus more on the specific wording in the original whitepaper, or on whether there are supporting real product pages?
A. 措辞更关键,原始文档的表述最不容易被营销美化
100%
B. 产品页面更关键,文档写了不代表真的上线了
0%
C. 两个都得核对,单看一个都容易被误导
0%
1 votes • Voting closed
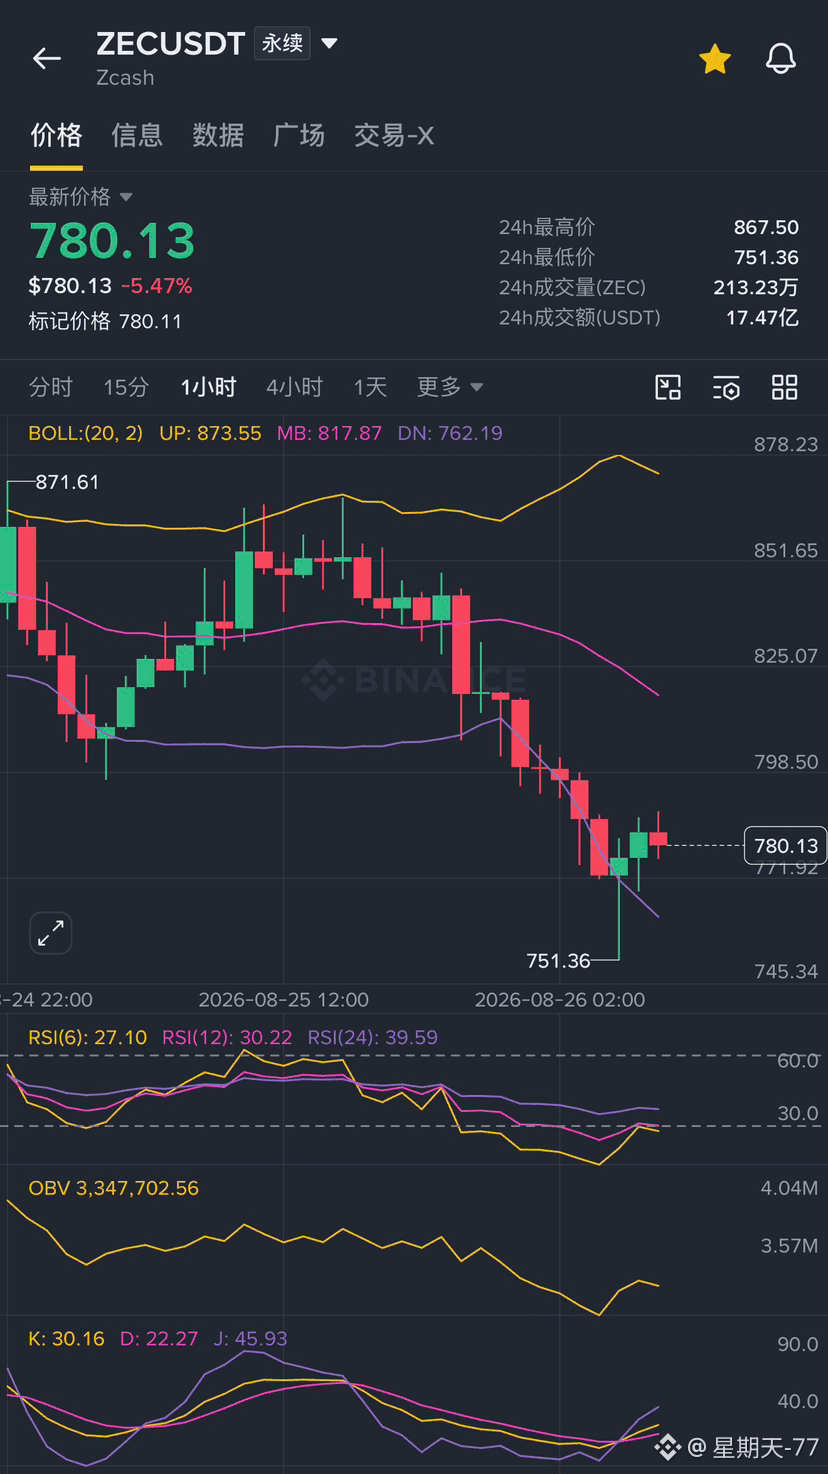
$ZEC current price $780.13, 24h change -5.47%, 24h trading volume 1.747 billion USDT. The price has been making continuous declines at the higher levels; in the short term, it is in a deep pullback.
Indicator breakdown
• Bollinger Bands: Upper band 873.55, middle band 817.87, lower band 762.19. Price has already fallen below the middle band and is trading near the lower band; the middle band has turned into a strong resistance level.
• RSI: RSI(6)=27.10, RSI(12)=30.22, RSI(24)=39.59. The short-term RSI6 has entered the oversold zone and downward momentum has somewhat eased, but there is not yet a clear reversal/turning signal.
• OBV: OBV is moving down in sync. The selling phase is accompanied by volume, indicating real selling pressure; bargain-hunting capital has not entered in large scale yet.
• KDJ: K=30.16, D=22.27, J=45.93. The J value is turning upward from a low level, suggesting the possibility of a mild rebound and repair, but the bigger trend remains bearish.
Market conclusion & trading reference
Upward resistance: Bollinger middle band 817.87, 24h high 867.50;
Downward support: Bollinger lower band 762.19, intraday low 751.36.
The order book/price action has been weakening continuously. With indicators showing oversold conditions, it is only suitable to take a chance on a short-term rebound, not to directly open large positions for bottom-fishing. If you are not currently holding, it is advisable to wait for confirmation that the rebound is under pressure or that support has stabilized before making any consideration. If you are holding, when the price rebounds to around 817, pay close attention to whether the resistance can be broken; if it fails and falls back, be sure to manage risk. On the downside, focus on defending the 751 low.
This content is only a technical interpretation and does not constitute investment advice.
#zec #ZECUSDT #BTC触及80000美元 #ZEC突破关键阻力涨75.5% $BTC $ETH
Indicator breakdown
• Bollinger Bands: Upper band 873.55, middle band 817.87, lower band 762.19. Price has already fallen below the middle band and is trading near the lower band; the middle band has turned into a strong resistance level.
• RSI: RSI(6)=27.10, RSI(12)=30.22, RSI(24)=39.59. The short-term RSI6 has entered the oversold zone and downward momentum has somewhat eased, but there is not yet a clear reversal/turning signal.
• OBV: OBV is moving down in sync. The selling phase is accompanied by volume, indicating real selling pressure; bargain-hunting capital has not entered in large scale yet.
• KDJ: K=30.16, D=22.27, J=45.93. The J value is turning upward from a low level, suggesting the possibility of a mild rebound and repair, but the bigger trend remains bearish.
Market conclusion & trading reference
Upward resistance: Bollinger middle band 817.87, 24h high 867.50;
Downward support: Bollinger lower band 762.19, intraday low 751.36.
The order book/price action has been weakening continuously. With indicators showing oversold conditions, it is only suitable to take a chance on a short-term rebound, not to directly open large positions for bottom-fishing. If you are not currently holding, it is advisable to wait for confirmation that the rebound is under pressure or that support has stabilized before making any consideration. If you are holding, when the price rebounds to around 817, pay close attention to whether the resistance can be broken; if it fails and falls back, be sure to manage risk. On the downside, focus on defending the 751 low.
This content is only a technical interpretation and does not constitute investment advice.
#zec #ZECUSDT #BTC触及80000美元 #ZEC突破关键阻力涨75.5% $BTC $ETH
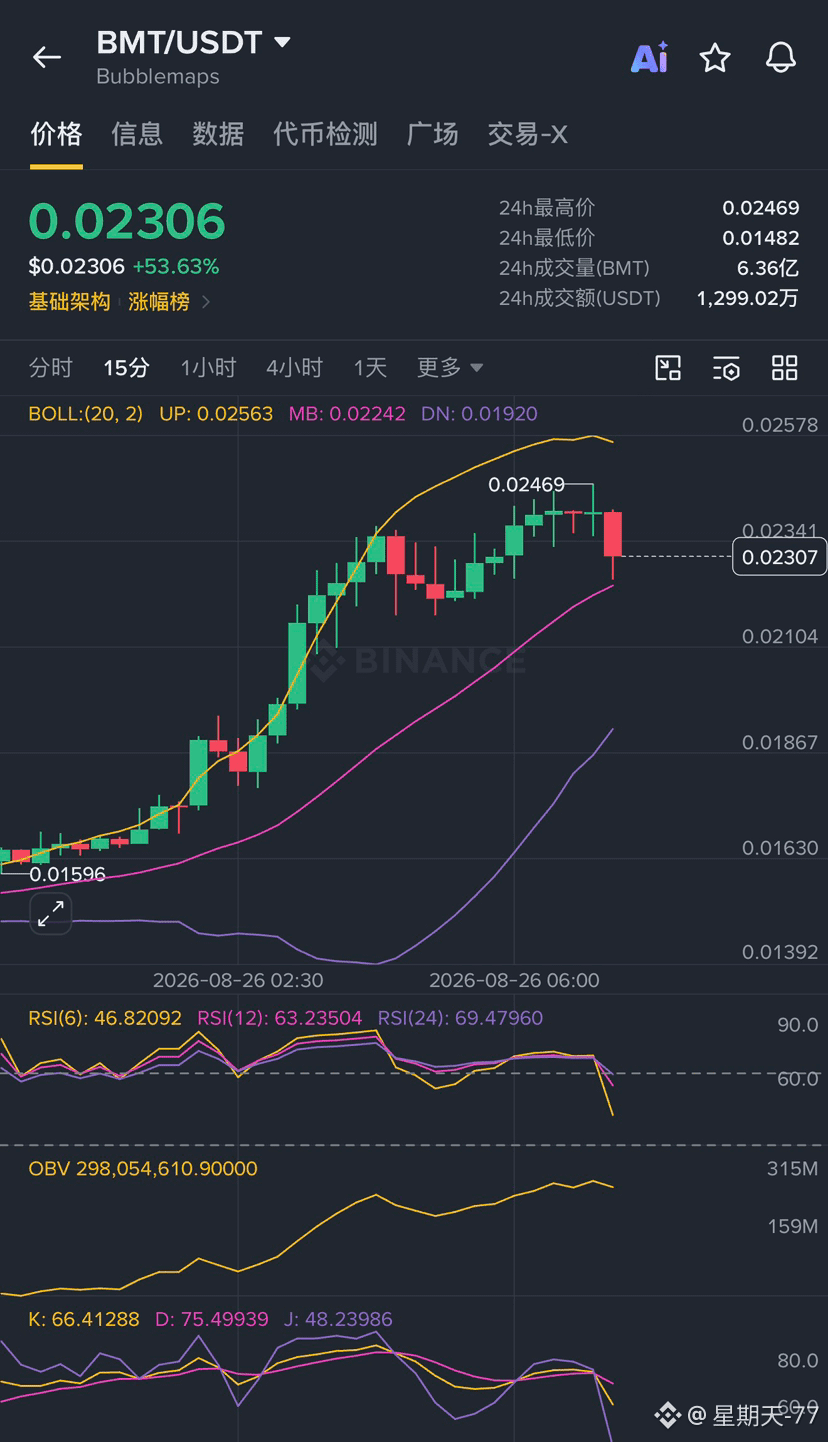
$BMT Current price $0.02306, 24h change +53.63%. 24h trading volume 12.99M USDT. After a short-term spike, a high-volume bearish candle appeared; there are signs of a pullback at higher levels.
Indicator breakdown
• Bollinger Bands: Current price 0.02306, upper band 0.02563, middle band 0.02242, lower band 0.01920. Price has just pulled back from the upper band area; the middle band at 0.02242 is the first tier of short-term support.
• RSI: RSI6=46.82, RSI12=63.23, RSI24=69.48. Short-term RSI6 is falling rapidly; bullish momentum is clearly weakening and it has moved downward from the overbought zone.
• OBV: OBV remains high, but is no longer making new highs. Volume follow-through has weakened, and the willingness of funds to chase has decreased.
• KDJ: K=66.41, D=75.50, J=48.24. The J value quickly turns downward, forming a short-term dead-cross signal, and pullback pressure increases.
Market conclusion & trading reference
Resistance above: 0.02469 (24h high), Bollinger upper band 0.02563;
Support below: Bollinger middle band 0.02242, Bollinger lower band 0.01920.
After a wave of sharp gains, KDJ forms a dead cross and RSI drops sharply; sell pressure at high levels has been released. If you are not holding a position, it is not recommended to chase. Wait for a pullback near the middle band and observe the strength of support; holders should watch the 0.02242 support—if it breaks, further downside may be toward 0.01920. Manage position risk accordingly.
This content is for technical analysis only and does not constitute investment advice.
#BTC触及80000美元 #油价维持跌势 #ZEC突破关键阻力涨75.5% $BTC $ZEC
Indicator breakdown
• Bollinger Bands: Current price 0.02306, upper band 0.02563, middle band 0.02242, lower band 0.01920. Price has just pulled back from the upper band area; the middle band at 0.02242 is the first tier of short-term support.
• RSI: RSI6=46.82, RSI12=63.23, RSI24=69.48. Short-term RSI6 is falling rapidly; bullish momentum is clearly weakening and it has moved downward from the overbought zone.
• OBV: OBV remains high, but is no longer making new highs. Volume follow-through has weakened, and the willingness of funds to chase has decreased.
• KDJ: K=66.41, D=75.50, J=48.24. The J value quickly turns downward, forming a short-term dead-cross signal, and pullback pressure increases.
Market conclusion & trading reference
Resistance above: 0.02469 (24h high), Bollinger upper band 0.02563;
Support below: Bollinger middle band 0.02242, Bollinger lower band 0.01920.
After a wave of sharp gains, KDJ forms a dead cross and RSI drops sharply; sell pressure at high levels has been released. If you are not holding a position, it is not recommended to chase. Wait for a pullback near the middle band and observe the strength of support; holders should watch the 0.02242 support—if it breaks, further downside may be toward 0.01920. Manage position risk accordingly.
This content is for technical analysis only and does not constitute investment advice.
#BTC触及80000美元 #油价维持跌势 #ZEC突破关键阻力涨75.5% $BTC $ZEC
Verified
When people evaluate whether a chain is decentralized or not, they often rely on the instinctive belief that you should count how many validator nodes there are—more nodes means more safety. That intuition may be misapplied in Dusk’s voting mechanism.
The whitepaper’s Section 3.3 describes it in quite specific detail: in Dusk’s voting committee, members are not given equal voting power. Instead, voting power is weighted by credit. The committee has a fixed total number of credit shares (currently set to 64). These credit shares are distributed to committee members according to their pledged amounts, and when tallying results, each vote is multiplied by the number of credits held by that member. In other words, even if two people are both committee members, the one with more credits has voting weight several times heavier than someone else—not just a simple headcount.
This design differs from the “decentralization” narrative promoted by many PoS chains in terms of how decentralization is evaluated. If you only count “how many different addresses are in the committee,” it looks nicely distributed. But if you account for credit-weighted voting power, the actual outcome may be determined by just a few members who hold the most credits. In that case, numerical dispersion does not necessarily mean dispersed power. The whitepaper also mentions that vote records use BLS signatures for aggregation, allowing all votes to be compressed into a single signature for verification—this efficiency optimization is a different matter from the weight distribution. The efficiency is indeed clean, but it does not address whether “counting nodes” is the correct decentralization metric.
My own view is that when evaluating how decentralized a committee-based consensus is, the question shouldn’t be “how many different participants are there?” but rather “what does the distribution curve of voting power look like?” If only a few members with large voting weights can sway most of the key votes, then even if the node count looks good, the real power structure may still be relatively concentrated.
#dusk $DUSK @Dusk
So what do you think: when assessing the decentralization of consensus, which is more indicative—the number of nodes, or the distribution of voting weight?
The whitepaper’s Section 3.3 describes it in quite specific detail: in Dusk’s voting committee, members are not given equal voting power. Instead, voting power is weighted by credit. The committee has a fixed total number of credit shares (currently set to 64). These credit shares are distributed to committee members according to their pledged amounts, and when tallying results, each vote is multiplied by the number of credits held by that member. In other words, even if two people are both committee members, the one with more credits has voting weight several times heavier than someone else—not just a simple headcount.
This design differs from the “decentralization” narrative promoted by many PoS chains in terms of how decentralization is evaluated. If you only count “how many different addresses are in the committee,” it looks nicely distributed. But if you account for credit-weighted voting power, the actual outcome may be determined by just a few members who hold the most credits. In that case, numerical dispersion does not necessarily mean dispersed power. The whitepaper also mentions that vote records use BLS signatures for aggregation, allowing all votes to be compressed into a single signature for verification—this efficiency optimization is a different matter from the weight distribution. The efficiency is indeed clean, but it does not address whether “counting nodes” is the correct decentralization metric.
My own view is that when evaluating how decentralized a committee-based consensus is, the question shouldn’t be “how many different participants are there?” but rather “what does the distribution curve of voting power look like?” If only a few members with large voting weights can sway most of the key votes, then even if the node count looks good, the real power structure may still be relatively concentrated.
#dusk $DUSK @Dusk
So what do you think: when assessing the decentralization of consensus, which is more indicative—the number of nodes, or the distribution of voting weight?
A. 权重分布更关键,节点数字容易误导
100%
B. 节点数量更直观,权重太抽象难核实
0%
C. 两个都得看,分开看都不完整
0%
4 votes • Voting closed
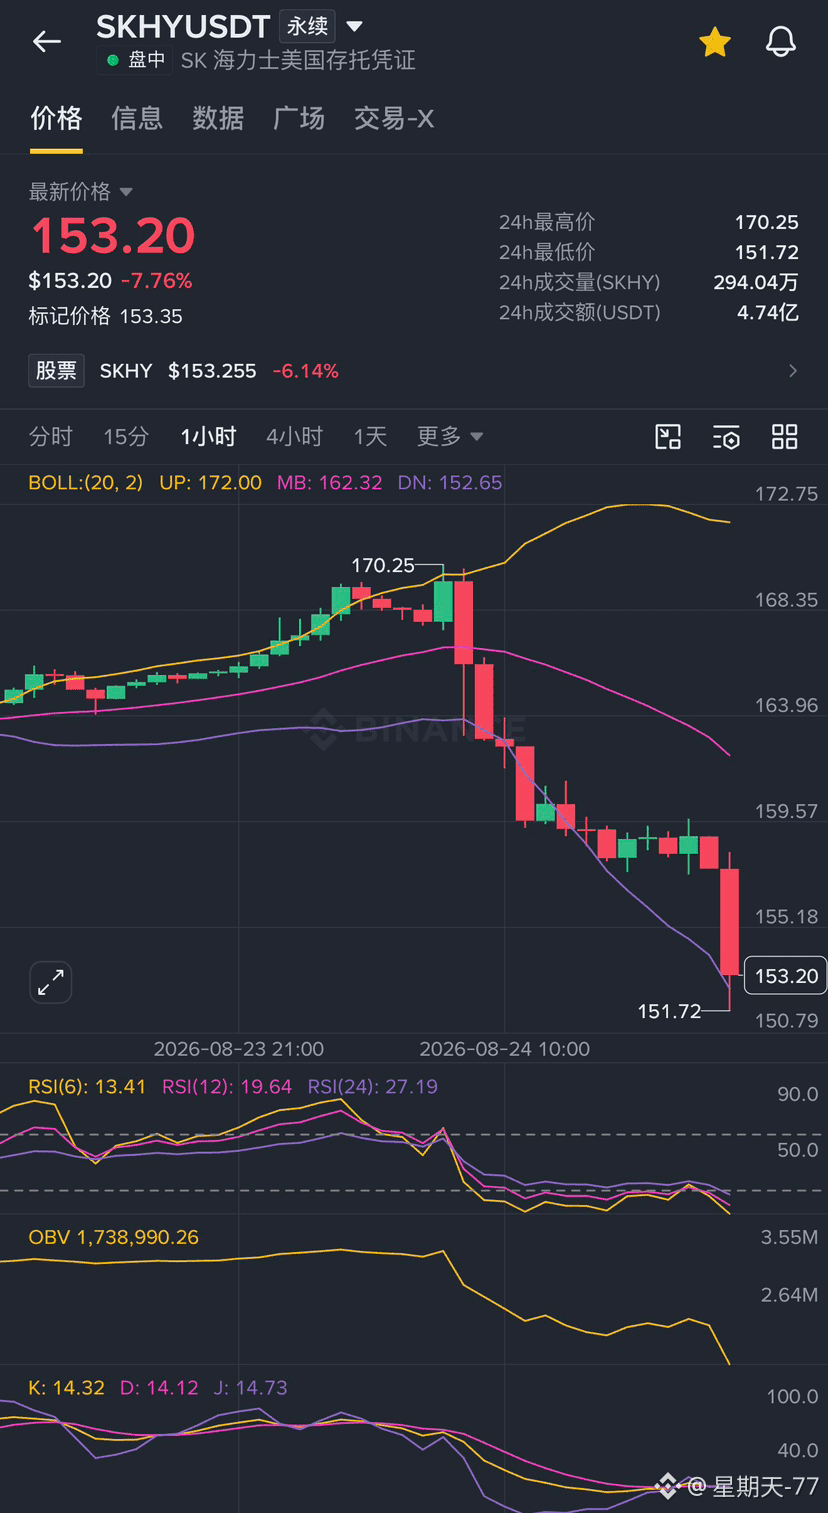
$SKHY Current price $153.20, 24h change -7.76%, 24h trading volume $474 million USDT. After hitting a high, it broke down and moved lower, showing a trend of continuous and sharp pullbacks.
Indicator breakdown
• Bollinger Bands: Price is retracing toward the lower band around 152.65. The Bollinger midline at 162.32 has turned into strong short-term resistance. The upper band at 172.00 is an important resistance level above.
• RSI: RSI6 is 13.41, already in a severely oversold range. There is a short-term technical rebound/relief rally need.
• OBV: The OBV indicator continues falling, with clear capital outflows; selling pressure has not been fully released yet.
• KDJ: K is 14.32 and D is 14.12, in an extremely oversold zone. There is a possibility of triggering an oversold rebound, but the overall bearish trend has not reversed.
Market conclusion and trading references
Resistance above: Bollinger lower band 152.65, Bollinger midline 162.32;
Support below: intraday low 151.72.
On the hourly timeframe, there is continued selling pressure and extremely oversold indicators. A technical pullback rebound may occur, but it is only a correction—not a trend reversal.
• Positions held: Focus on the rebound at the Bollinger midline resistance level of 162.32. If the rebound approaches this resistance area, prioritize reducing positions. Do not blindly hold long positions.
• No positions held: Absolutely do not try to bottom-fish and bet on a reversal during the oversold phase. The risk is very high. Wait for clear signs of stabilization on the chart before evaluating participation opportunities.
The above is only a technical analysis interpretation and does not constitute investment advice.
#SKHy #布伦特原油跌1.87% #三星跌8.97%拖累KOSPI跌3.24% #阿里巴巴港股募资102亿美元
$BTC $ETH
Indicator breakdown
• Bollinger Bands: Price is retracing toward the lower band around 152.65. The Bollinger midline at 162.32 has turned into strong short-term resistance. The upper band at 172.00 is an important resistance level above.
• RSI: RSI6 is 13.41, already in a severely oversold range. There is a short-term technical rebound/relief rally need.
• OBV: The OBV indicator continues falling, with clear capital outflows; selling pressure has not been fully released yet.
• KDJ: K is 14.32 and D is 14.12, in an extremely oversold zone. There is a possibility of triggering an oversold rebound, but the overall bearish trend has not reversed.
Market conclusion and trading references
Resistance above: Bollinger lower band 152.65, Bollinger midline 162.32;
Support below: intraday low 151.72.
On the hourly timeframe, there is continued selling pressure and extremely oversold indicators. A technical pullback rebound may occur, but it is only a correction—not a trend reversal.
• Positions held: Focus on the rebound at the Bollinger midline resistance level of 162.32. If the rebound approaches this resistance area, prioritize reducing positions. Do not blindly hold long positions.
• No positions held: Absolutely do not try to bottom-fish and bet on a reversal during the oversold phase. The risk is very high. Wait for clear signs of stabilization on the chart before evaluating participation opportunities.
The above is only a technical analysis interpretation and does not constitute investment advice.
#SKHy #布伦特原油跌1.87% #三星跌8.97%拖累KOSPI跌3.24% #阿里巴巴港股募资102亿美元
$BTC $ETH
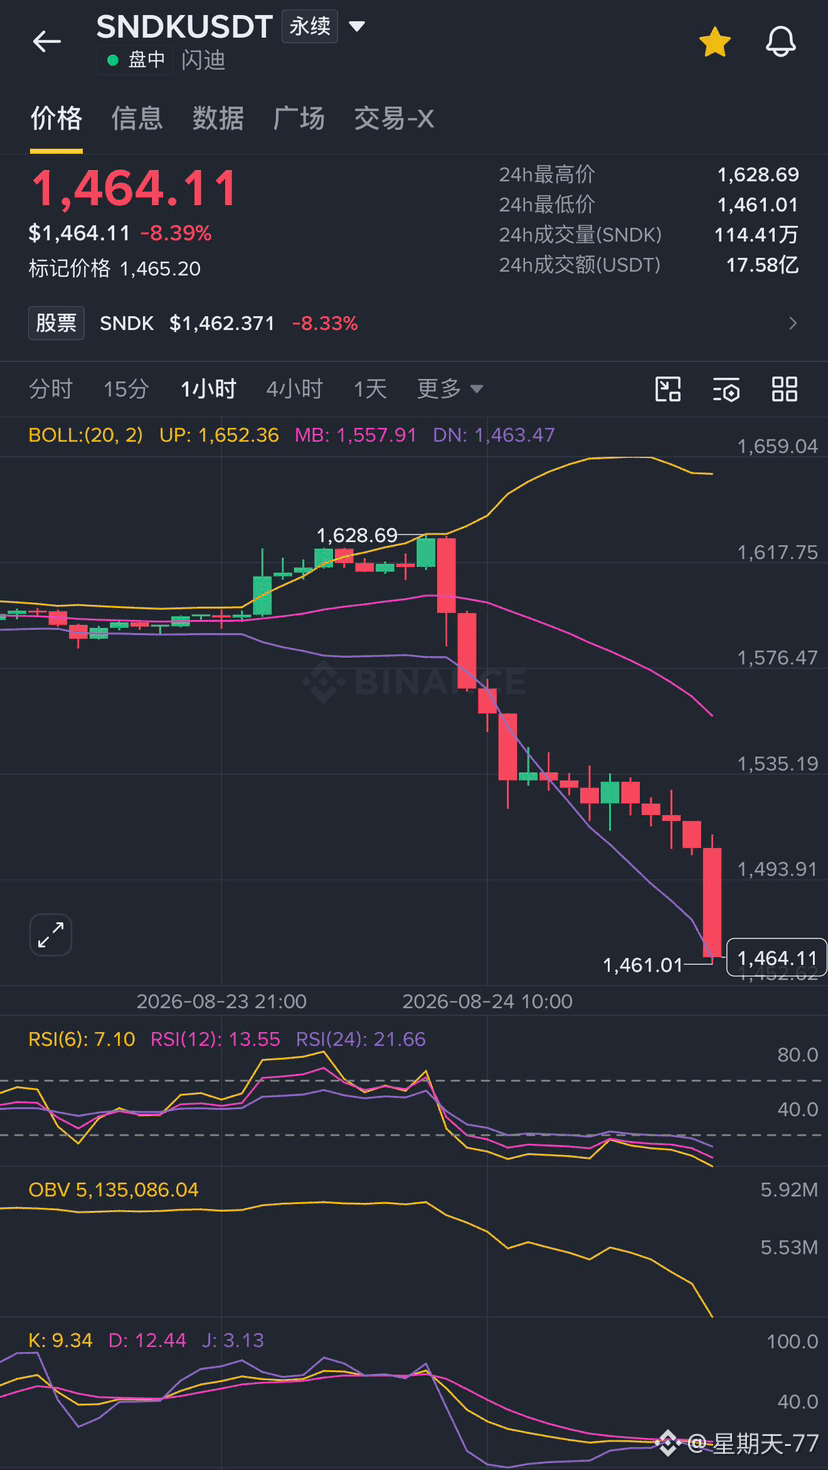
$SNDK current price $1464.11, 24h change -8.39%, 24h trading volume 1.758 billion USDT. A breakdown below a high level has triggered a continuous deep pullback pattern.
Indicator breakdown
• Bollinger Bands: Price has fallen below the lower Bollinger band 1463.47. The middle band 1557.91 has turned into strong resistance, and the upper band 1652.36 is an even higher resistance overhead.
• RSI: RSI6 is only 7.10, already in the severe oversold zone. There is a need for a short-term technical rebound and correction.
• OBV: OBV is persistently trending downward, with clear signs of distribution and heavy exit volume. Selling pressure has not been fully released yet.
• KDJ: K value 9.34, D value 12.44. The indicator is in an extremely oversold area and may trigger an oversold rebound at any time, but the larger trend has already weakened.
Market conclusion and trading reference
Upper resistance: Bollinger lower band 1463.47, Bollinger middle band 1557.91;
Lower support: intraday low 1461.01.
The hourly chart shows consecutive selloffs. With indicators at extreme oversold levels, a rebound and technical correction may occur, but the trend has already weakened. Any rebound is more likely to be a technical pullback rather than a full reversal.
• Current holders: Use the Bollinger middle band 1557.91 as an important defensive resistance. If the rebound approaches the resistance zone, prioritize reducing positions—do not stubbornly hold long positions blindly.
• No position: Do not try to bottom-fish for a reversal. The risk of an oversold rebound is very high. Wait for stabilization signals before reassessing whether to participate.
The above is only a technical interpretation and does not constitute investment advice.
#SNDK #布伦特原油跌1.87% #阿里巴巴港股募资102亿美元 $BTC $ETH
Indicator breakdown
• Bollinger Bands: Price has fallen below the lower Bollinger band 1463.47. The middle band 1557.91 has turned into strong resistance, and the upper band 1652.36 is an even higher resistance overhead.
• RSI: RSI6 is only 7.10, already in the severe oversold zone. There is a need for a short-term technical rebound and correction.
• OBV: OBV is persistently trending downward, with clear signs of distribution and heavy exit volume. Selling pressure has not been fully released yet.
• KDJ: K value 9.34, D value 12.44. The indicator is in an extremely oversold area and may trigger an oversold rebound at any time, but the larger trend has already weakened.
Market conclusion and trading reference
Upper resistance: Bollinger lower band 1463.47, Bollinger middle band 1557.91;
Lower support: intraday low 1461.01.
The hourly chart shows consecutive selloffs. With indicators at extreme oversold levels, a rebound and technical correction may occur, but the trend has already weakened. Any rebound is more likely to be a technical pullback rather than a full reversal.
• Current holders: Use the Bollinger middle band 1557.91 as an important defensive resistance. If the rebound approaches the resistance zone, prioritize reducing positions—do not stubbornly hold long positions blindly.
• No position: Do not try to bottom-fish for a reversal. The risk of an oversold rebound is very high. Wait for stabilization signals before reassessing whether to participate.
The above is only a technical interpretation and does not constitute investment advice.
#SNDK #布伦特原油跌1.87% #阿里巴巴港股募资102亿美元 $BTC $ETH
Verified
If a bond is brought onto the blockchain, does that mean the bond is “living on-chain”? I originally thought the answer was pretty obvious—until I noticed that Dusk itself makes a clear distinction between these two things: tokenization and native issuance are not two different names for the same action.
In plain terms, tokenization means putting an existing bundle of assets behind a “shell” and placing it on-chain. Steps like confirming ownership and distributing dividends will, in most cases, still follow the old off-chain processes. The token on-chain is more like a certificate; the asset’s real lifecycle logic remains outside the chain. Native issuance is different: it means that from the moment the asset is issued, on-chain rules directly handle dividend distribution, voting, and even forced transfers. In the whitepaper, the Zedger contracts manage the whole system (minting, burning, corporate actions, forced transfers). It’s not something you do and then you’re done after issuing the tokens.
At first glance, this distinction looks like a technical detail. But if you think about it, its weight is not small. Many projects that talk about RWA scale use numbers that are essentially “how many assets have been tokenized.” That number can rise very quickly because the technical barrier isn’t that high. But “native issuance” means the chain must truly take on more stages of the asset lifecycle on-chain—doing that is much slower, and far harder. Using tokenization scale to judge a chain’s real weight in RWAs may fundamentally be the wrong metric.
What I want to know now is: among the partnership scale figures that Dusk has disclosed, how much involves the more difficult path of native issuance, and how much is still based on the old playbook of traditional tokenization—because these two are mixed into a single number, and outsiders can’t tell the difference.
#dusk $DUSK @Dusk
Which metric do you think is more reliable when evaluating an RWA project?
In plain terms, tokenization means putting an existing bundle of assets behind a “shell” and placing it on-chain. Steps like confirming ownership and distributing dividends will, in most cases, still follow the old off-chain processes. The token on-chain is more like a certificate; the asset’s real lifecycle logic remains outside the chain. Native issuance is different: it means that from the moment the asset is issued, on-chain rules directly handle dividend distribution, voting, and even forced transfers. In the whitepaper, the Zedger contracts manage the whole system (minting, burning, corporate actions, forced transfers). It’s not something you do and then you’re done after issuing the tokens.
At first glance, this distinction looks like a technical detail. But if you think about it, its weight is not small. Many projects that talk about RWA scale use numbers that are essentially “how many assets have been tokenized.” That number can rise very quickly because the technical barrier isn’t that high. But “native issuance” means the chain must truly take on more stages of the asset lifecycle on-chain—doing that is much slower, and far harder. Using tokenization scale to judge a chain’s real weight in RWAs may fundamentally be the wrong metric.
What I want to know now is: among the partnership scale figures that Dusk has disclosed, how much involves the more difficult path of native issuance, and how much is still based on the old playbook of traditional tokenization—because these two are mixed into a single number, and outsiders can’t tell the difference.
#dusk $DUSK @Dusk
Which metric do you think is more reliable when evaluating an RWA project?
A. 看代币化总规模,数字直观
66%
B. 看原生发行占比,更能反映真实能力
17%
C. 两个都得看,单看一个会被误导
17%
6 votes • Voting closed
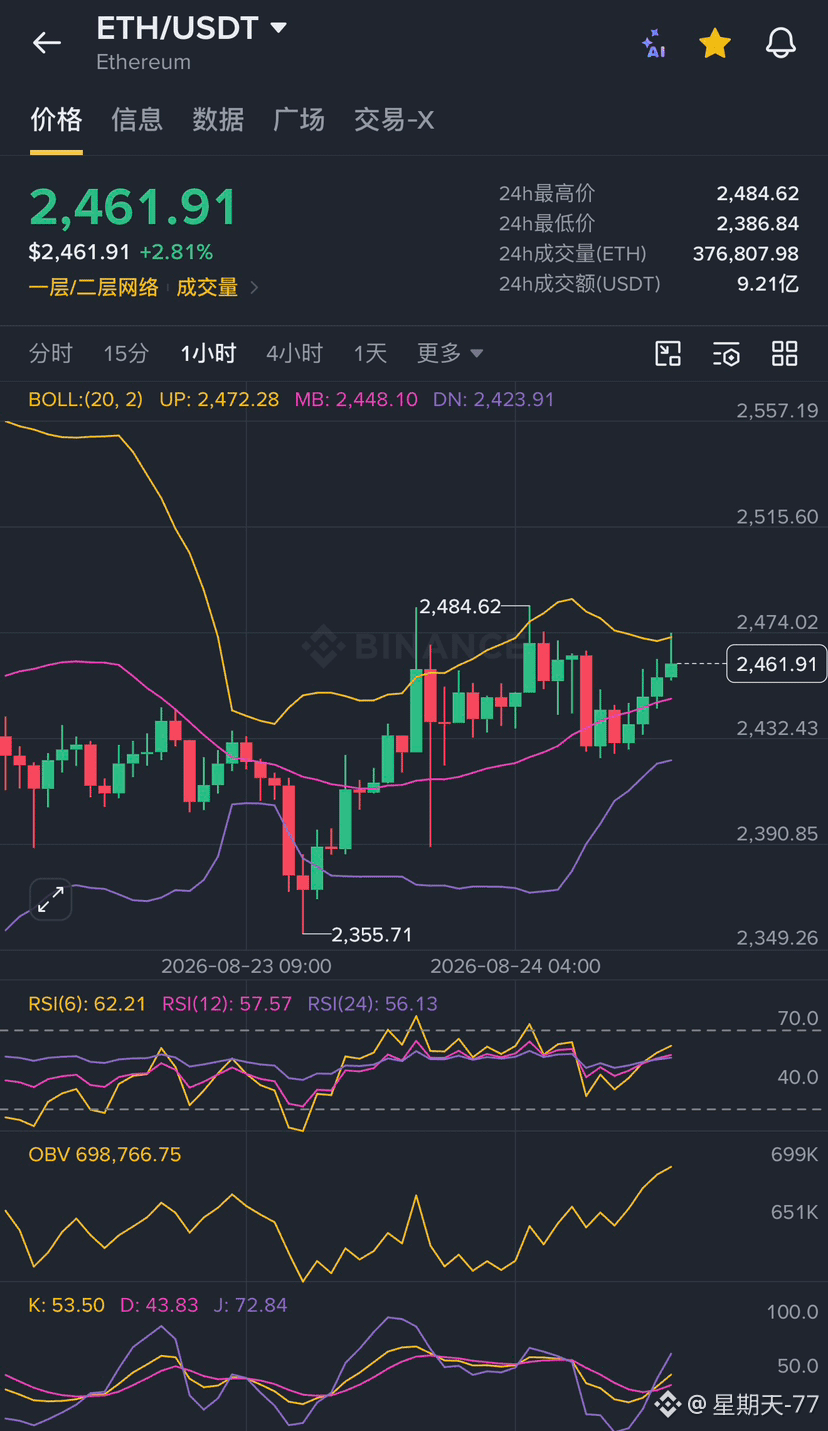
$ETH current price $2461.91, 24h change +2.81%, 24h trading volume 921 million USDT. After dipping and rebounding, the market breaks out of a ranging pattern and repairs an upward-trending recovery.
Indicator breakdown
• Bollinger Bands: The current price is trading above the Bollinger midline at 2448.10. The upper band at 2472.28 forms short-term resistance, while the lower band at 2423.91 forms support.
• RSI: RSI6 is 62.21. The indicator is moving upward; bullish momentum is recovering, and it has not entered an extreme overbought zone.
• OBV: The OBV curve continues to rise. Volume is in line with the rebound, and the buy-side follow-through is fairly strong.
• KDJ: K is 53.50, D is 43.83. The three lines turn upward and diverge, indicating improving short-term bullish sentiment.
Market conclusion and trading references
Upward resistance: Bollinger upper band 2472.28, intraday high 2484.62;
Downward support: Bollinger midline 2448.10, Bollinger lower band 2423.91.
On the hourly timeframe, the rebound is repairing the move, and the market’s focus gradually lifts higher. However, resistance remains overhead, so this is still a range-bound rebound structure.
• Positions held: Use the Bollinger midline at 2448.10 as the defense level. As long as support holds, you can continue holding; if it breaks down, reduce exposure appropriately.
• Not in position: It’s not suitable to chase higher. Wait for a pullback and stabilization around the midline, then reassess whether to enter. Be cautious of a pullback after a spike meets resistance.
The above is only a technical analysis and does not constitute investment advice.
#ETH #加美贸易谈判破裂或引发新关税 #金价逼近三个月高位 $BTC $SNDK
Indicator breakdown
• Bollinger Bands: The current price is trading above the Bollinger midline at 2448.10. The upper band at 2472.28 forms short-term resistance, while the lower band at 2423.91 forms support.
• RSI: RSI6 is 62.21. The indicator is moving upward; bullish momentum is recovering, and it has not entered an extreme overbought zone.
• OBV: The OBV curve continues to rise. Volume is in line with the rebound, and the buy-side follow-through is fairly strong.
• KDJ: K is 53.50, D is 43.83. The three lines turn upward and diverge, indicating improving short-term bullish sentiment.
Market conclusion and trading references
Upward resistance: Bollinger upper band 2472.28, intraday high 2484.62;
Downward support: Bollinger midline 2448.10, Bollinger lower band 2423.91.
On the hourly timeframe, the rebound is repairing the move, and the market’s focus gradually lifts higher. However, resistance remains overhead, so this is still a range-bound rebound structure.
• Positions held: Use the Bollinger midline at 2448.10 as the defense level. As long as support holds, you can continue holding; if it breaks down, reduce exposure appropriately.
• Not in position: It’s not suitable to chase higher. Wait for a pullback and stabilization around the midline, then reassess whether to enter. Be cautious of a pullback after a spike meets resistance.
The above is only a technical analysis and does not constitute investment advice.
#ETH #加美贸易谈判破裂或引发新关税 #金价逼近三个月高位 $BTC $SNDK
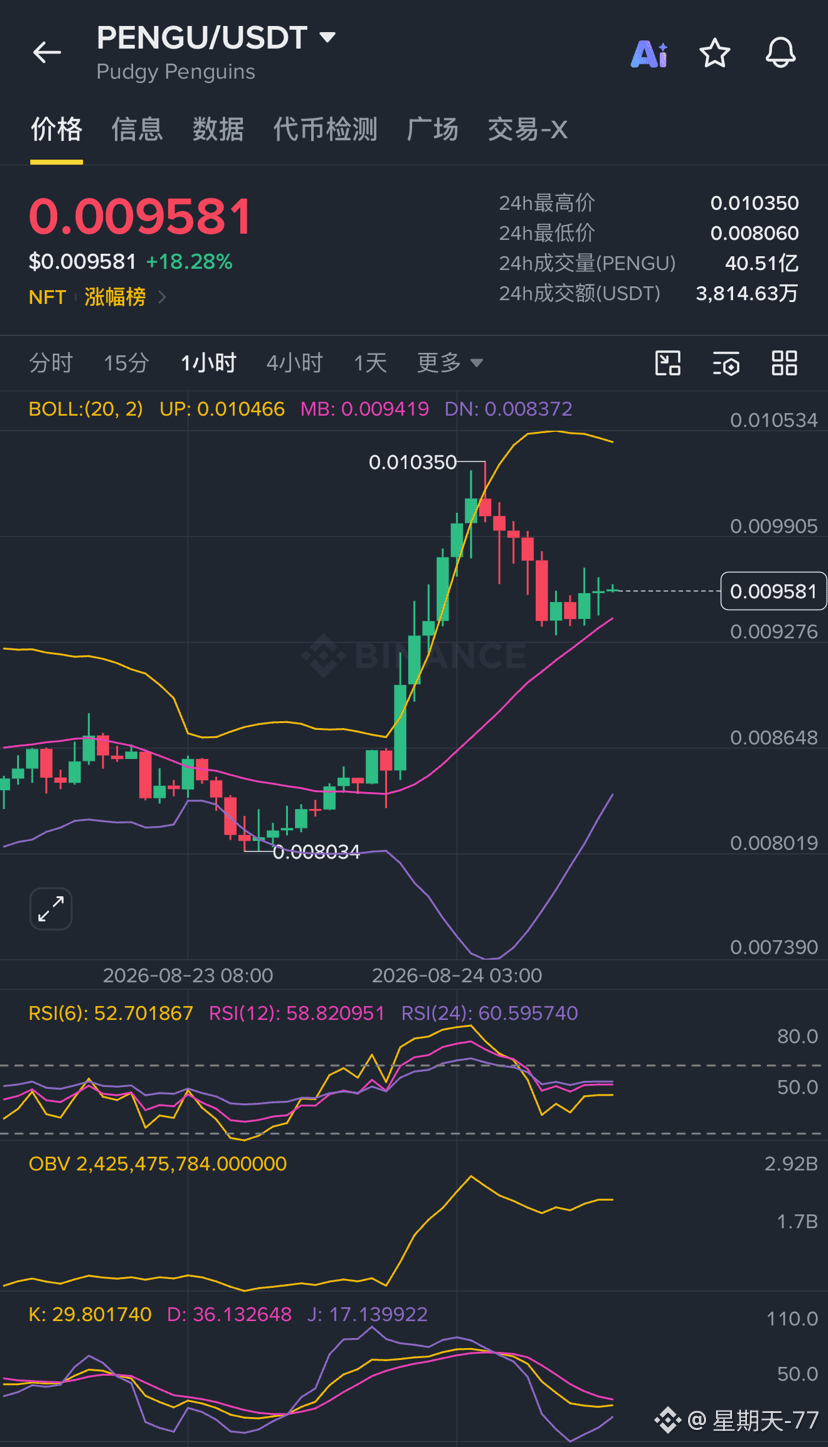
$PENGU Current price $0.009581, 24h change +18.28%, 24h trading volume $38.1463 million USDT. After a spike and pullback, the price is in a high-range consolidation and a repair uptrend.
Indicator Breakdown
• Bollinger Bands: The current price is near the Bollinger mid-band at 0.009419. The upper band at 0.010466 is resistance, and the lower band at 0.008372 is strong near-term support.
• RSI: RSI6 is 52.70. It has fallen back from the overbought zone to a neutral position, and bullish/bearish power is relatively balanced.
• OBV: The volume/energy indicator remains at a high level and has not seen a sharp collapse. There is still capital/support participation.
• KDJ: K is 29.80, D is 36.13. The indicators are moving downward toward the oversold area, suggesting a technical rebound may be needed.
• MACD: DIF has crossed below DEA. The MACD value is negative, and short-term bearish momentum has been somewhat released.
Market Conclusion and Trading Reference
Resistance levels: Bollinger upper band 0.010466, intraday high 0.010350;
Support levels: Bollinger mid-band 0.009419, Bollinger lower band 0.008372.
After a prior round of rapid upside, a pullback has occurred. Currently, price is ranging around the Bollinger mid-band, with relatively large market fluctuations.
• Current holdings: Use the Bollinger mid-band at 0.009419 as the defense/support level. If it holds, you can continue to hold; if there is a valid breakdown, consider reducing position size to mitigate risk.
• No holdings: It is not recommended to chase after a rise. Wait for a pullback to test support and stabilize before considering opportunities, and beware the risk of a second drop.
The above is only a technical analysis interpretation and does not constitute investment advice.
#pengu #比特币创2023年3月来最强周涨幅 #加美贸易谈判破裂或引发新关税 $NVDAB $BTC
Indicator Breakdown
• Bollinger Bands: The current price is near the Bollinger mid-band at 0.009419. The upper band at 0.010466 is resistance, and the lower band at 0.008372 is strong near-term support.
• RSI: RSI6 is 52.70. It has fallen back from the overbought zone to a neutral position, and bullish/bearish power is relatively balanced.
• OBV: The volume/energy indicator remains at a high level and has not seen a sharp collapse. There is still capital/support participation.
• KDJ: K is 29.80, D is 36.13. The indicators are moving downward toward the oversold area, suggesting a technical rebound may be needed.
• MACD: DIF has crossed below DEA. The MACD value is negative, and short-term bearish momentum has been somewhat released.
Market Conclusion and Trading Reference
Resistance levels: Bollinger upper band 0.010466, intraday high 0.010350;
Support levels: Bollinger mid-band 0.009419, Bollinger lower band 0.008372.
After a prior round of rapid upside, a pullback has occurred. Currently, price is ranging around the Bollinger mid-band, with relatively large market fluctuations.
• Current holdings: Use the Bollinger mid-band at 0.009419 as the defense/support level. If it holds, you can continue to hold; if there is a valid breakdown, consider reducing position size to mitigate risk.
• No holdings: It is not recommended to chase after a rise. Wait for a pullback to test support and stabilize before considering opportunities, and beware the risk of a second drop.
The above is only a technical analysis interpretation and does not constitute investment advice.
#pengu #比特币创2023年3月来最强周涨幅 #加美贸易谈判破裂或引发新关税 $NVDAB $BTC
Log in to explore more content