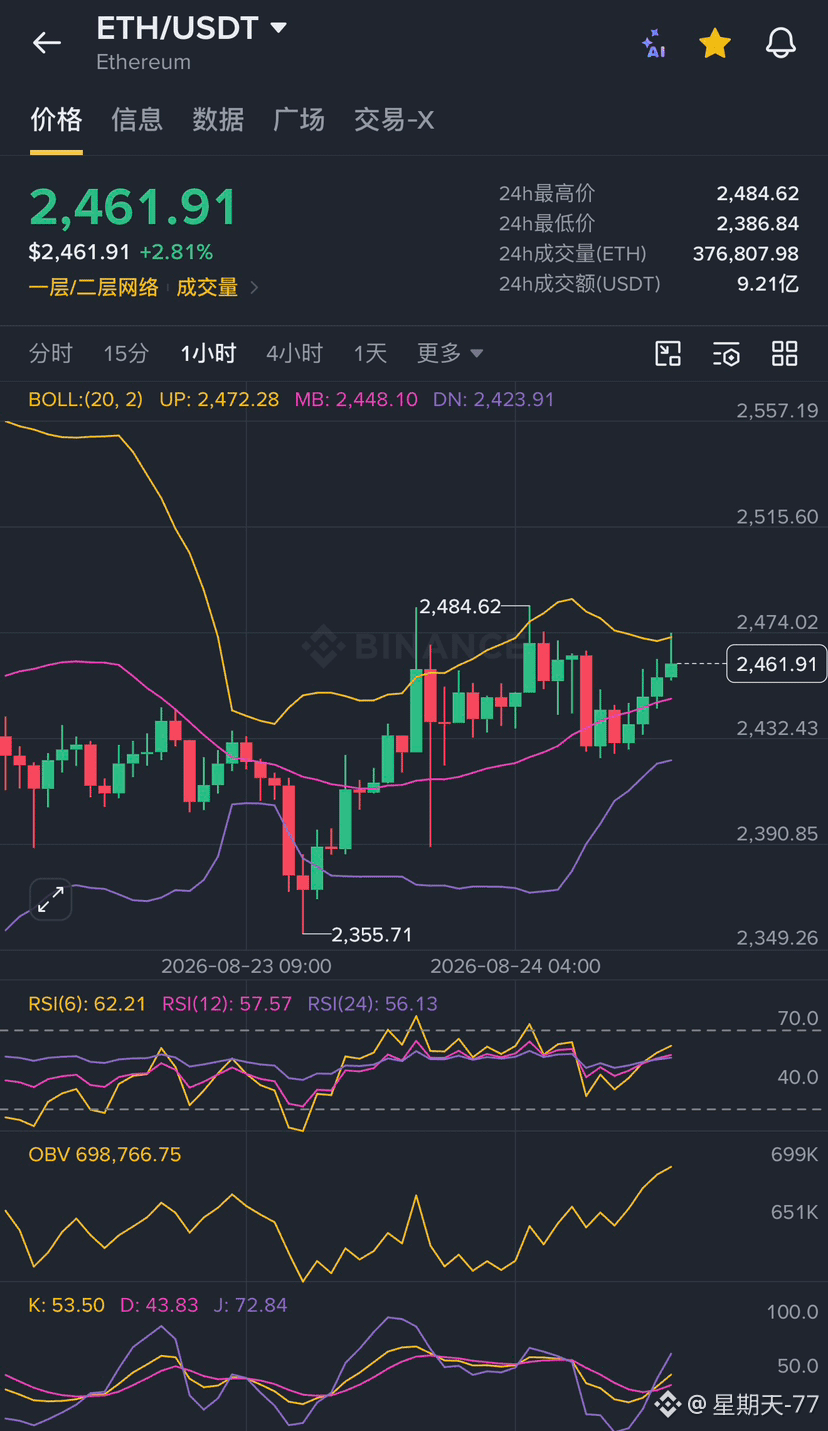

$ETH current price $2461.91, 24h change +2.81%, 24h trading volume 921 million USDT. After dipping and rebounding, the market breaks out of a ranging pattern and repairs an upward-trending recovery.
Indicator breakdown
• Bollinger Bands: The current price is trading above the Bollinger midline at 2448.10. The upper band at 2472.28 forms short-term resistance, while the lower band at 2423.91 forms support.
• RSI: RSI6 is 62.21. The indicator is moving upward; bullish momentum is recovering, and it has not entered an extreme overbought zone.
• OBV: The OBV curve continues to rise. Volume is in line with the rebound, and the buy-side follow-through is fairly strong.
• KDJ: K is 53.50, D is 43.83. The three lines turn upward and diverge, indicating improving short-term bullish sentiment.
Market conclusion and trading references
Upward resistance: Bollinger upper band 2472.28, intraday high 2484.62;
Downward support: Bollinger midline 2448.10, Bollinger lower band 2423.91.
On the hourly timeframe, the rebound is repairing the move, and the market’s focus gradually lifts higher. However, resistance remains overhead, so this is still a range-bound rebound structure.
• Positions held: Use the Bollinger midline at 2448.10 as the defense level. As long as support holds, you can continue holding; if it breaks down, reduce exposure appropriately.
• Not in position: It’s not suitable to chase higher. Wait for a pullback and stabilization around the midline, then reassess whether to enter. Be cautious of a pullback after a spike meets resistance.
The above is only a technical analysis and does not constitute investment advice.
#ETH #加美贸易谈判破裂或引发新关税 #金价逼近三个月高位 $BTC $SNDK
Indicator breakdown
• Bollinger Bands: The current price is trading above the Bollinger midline at 2448.10. The upper band at 2472.28 forms short-term resistance, while the lower band at 2423.91 forms support.
• RSI: RSI6 is 62.21. The indicator is moving upward; bullish momentum is recovering, and it has not entered an extreme overbought zone.
• OBV: The OBV curve continues to rise. Volume is in line with the rebound, and the buy-side follow-through is fairly strong.
• KDJ: K is 53.50, D is 43.83. The three lines turn upward and diverge, indicating improving short-term bullish sentiment.
Market conclusion and trading references
Upward resistance: Bollinger upper band 2472.28, intraday high 2484.62;
Downward support: Bollinger midline 2448.10, Bollinger lower band 2423.91.
On the hourly timeframe, the rebound is repairing the move, and the market’s focus gradually lifts higher. However, resistance remains overhead, so this is still a range-bound rebound structure.
• Positions held: Use the Bollinger midline at 2448.10 as the defense level. As long as support holds, you can continue holding; if it breaks down, reduce exposure appropriately.
• Not in position: It’s not suitable to chase higher. Wait for a pullback and stabilization around the midline, then reassess whether to enter. Be cautious of a pullback after a spike meets resistance.
The above is only a technical analysis and does not constitute investment advice.
#ETH #加美贸易谈判破裂或引发新关税 #金价逼近三个月高位 $BTC $SNDK