




This article provides an in-depth analysis of the historical impacts and future outlook of U.S. midterm elections on traditional equity markets (represented by the S&P 500 index) and emerging cryptocurrency markets (represented by Bitcoin). The study finds that there are significant regularities in market performance before and after midterm elections, especially in how the fading of “policy uncertainty” drives risk assets. Although the crypto market’s history is shorter, as its institutionalization accelerates, it may gradually converge with the election-cycle patterns seen in U.S. stocks. The article concludes by presenting a trading framework for the 2026 midterm election and the key observation indicators.
1. Overview of U.S. midterm elections
U.S. midterm elections are held every four years, typically on the Tuesday after the first Monday in November of the second year of a presidential term. The next midterm election is expected to be on November 3, 2026 (Tuesday) [1]. This election will elect all 435 seats in the House of Representatives, about one-third of the Senate seats, as well as multiple governors and local government positions in various states [1]. The importance of midterm elections lies in the fact that they often determine whether the president’s party can continue to control Congress, thereby directly affecting major policy directions over the next two years, such as legislation, the budget, taxes, immigration, and foreign policy. Historically, it has been fairly common for the ruling party to lose seats in Congress during midterm elections [1].
2. Impact of midterm elections on the U.S. stock market
2.1 Historical pattern: weak before the election, strong after the election
Data statistics from the past 100+ years (31 midterm elections) show that the U.S. stock market exhibits a relatively stable pattern before and after midterm elections [2] [3]:
· One year before the election: Market performance is usually relatively weak, with average returns noticeably low—about only 2%~3%, far below the level of the normal-year average of 8%~9% [2].
· One year after the election: Market performance is often very strong. Within the 12 months following the midterm election, the S&P 500 index’s average return can reach 12%~16%, and most years show an upward trend [2].
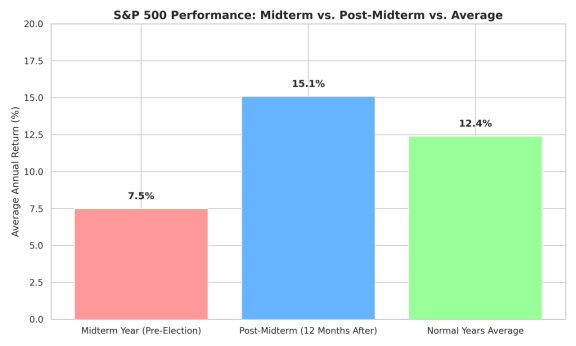
S&P 500 Performance: Midterm vs. Post-Midterm vs. Average
2.2 Core drivers: policy uncertainty
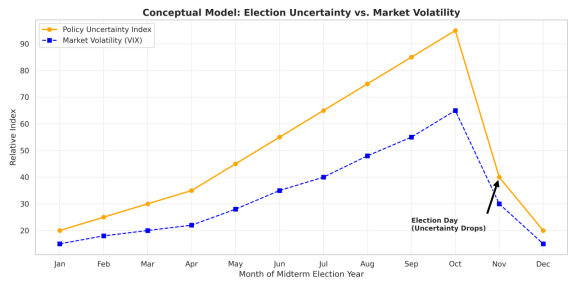
This kind of regularity in market performance is not simply determined by which party wins, but mainly influenced by “Policy Uncertainty” [2]. What the market worries most is uncertainty about the direction of future policies—for example, tax rates, fiscal spending, regulatory policies, and debt issues. This kind of unknown often makes the market more uneasy than already-known negative news [2]. Once the results of the midterm election are in place, policy uncertainty will drop substantially regardless of the outcome. Expectations for future policies become clearer, and capital will flow back into risk assets. This explains why markets typically show a strong rebound after the election ends [2].
2.3 Typical year case studies
2010: Against the backdrop of the European debt crisis, after the midterm election, the S&P 500 index began rising steadily [3].
2014: After the midterm election ended, U.S. stocks entered a big bull market going into 2015 [3].
2018: Despite facing multiple pressures such as interest-rate hikes, quantitative tightening, and the U.S.-China trade war—leading to a major market drop from September to December—after the midterm election, U.S. stocks entered a new bull market in 2019 [3].
2022: Against the backdrop of the highest inflation in 40 years, aggressive rate hikes, and a Nasdaq bear market, after the midterm election ended in November 2022, 2023 began with an AI bull market. Although the main drivers were inflation topping out, expectations of an end to rate hikes, and advances in AI technology, the easing of post-election uncertainty also played a positive role [3].
3. Impact of midterm elections on the crypto market
3.1 Historical performance: lacks stable patterns
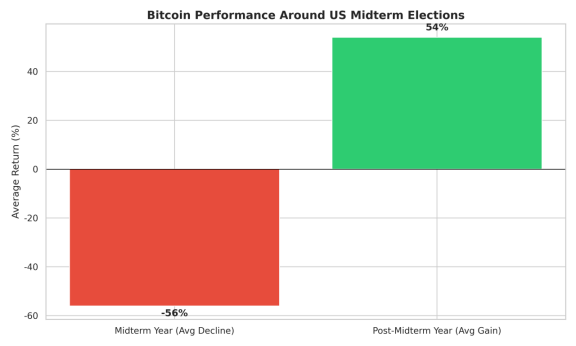
Because the historical record of crypto assets such as Bitcoin (BTC) is relatively short—having experienced only three midterm elections in 2014, 2018, and 2022—the relationship between BTC and midterm elections has not yet formed stable, U.S.-stock-like patterns [4].
2014: BTC was in a bear market, and due to the Mt. Gox bankruptcy event, the midterm election had almost no impact on its downward trend [4]. 2018: BTC was again in a bear market. Driven by the burst of the ICO bubble, it fell from $6,000 to $3,000; the election impact was limited [4].
2022: After the midterm election (November 8), the FTX exchange began to collapse on November 9, causing BTC to plunge from $21,000 to $15,000. The massive shock from the FTX event fully overwhelmed any impact the election might have brought [4].
3.2 Future trend: converging toward risk assets
Although historical data lack stable patterns, the current crypto market is different from the past. With the launch of Bitcoin ETFs and the increase in sovereign funds and institutional allocations, BTC is increasingly becoming a mainstream risk asset [4]. The biggest driver of risk assets is liquidity. And the results of midterm elections—especially potential impacts on fiscal policy, the debt ceiling, tax cuts, and fiscal stimulus—could indirectly affect global liquidity [4]. Therefore, going forward, crypto assets such as Bitcoin are increasingly likely to start replicating the rhythm of the U.S. stock market before and after midterm elections [4].
4. The 2026 midterm election trading framework and key indicators
Based on historical experience and market logic, the 2026 midterm election may show the following timeline and key market focus points [4]:

Investors should focus on the following macro indicators rather than over-interpreting polls [4]:
BTC/ETH ETF fund flows: represent institutions’ willingness to allocate to risk assets.
Fed interest-rate cut expectations (FedWatch): determines the direction of global liquidity.
U.S. 10-year Treasury yield: If it clearly falls, it usually benefits growth stocks and crypto assets.
U.S. Dollar Index (DXY): Weakness usually benefits BTC, ETH, and emerging market assets.
VIX volatility index: If it drops quickly after the election, it suggests that risk appetite is recovering.
If these indicators resonate with the easing of post-election uncertainty, then from November 2026 to 2027, it could become a risk-asset allocation window worth focusing on [4].
Conclusion
The impact of U.S. midterm elections on financial markets is a complex and multi-dimensional topic. Although historical data show a pattern of “weak before the election and strong after the election” in the U.S. stock market, the key driving force is the fading of policy uncertainty. As an emerging asset class, the relationship between the crypto market and midterm elections is evolving and may gradually converge toward the patterns of traditional risk assets as institutionalization progresses. Investors should stay rational, focusing on macroeconomic conditions and liquidity indicators rather than making investment decisions solely based on political events.
References
[1] ChatGPT - U.S. midterm election dates. https://chatgpt.com/share/6a55f05f-22d8-83e8-8f89-ec2c50861e61
[2] U.S. Bank. How midterm elections affect the stock market. https://www.usbank.com/investing/financial-perspectives/market-news/stock-market-performance-after-midterm-elections.html
[3] BlackRock. Midterm Elections and Stock Market Trends. https://www.blackrock.com/us/financial-professionals/insights/2026-midterm-elections-and-market-performance
[4] CryptoPotato. U.S. Midterm Elections and Crypto: Why Market Volatility Often Precedes a Bitcoin Rally. https://cryptopotato.com/us-midterm-elections-and-crypto-why-market-volatility-often-precedes-a-bitcoin-rally/