



$BTC Current market overview of the core situation
As of 21:00 on July 8, 2026 (UTC+8), the current spot price of Bitcoin (BTC) is $62,103. Over the past 24 hours, it is down by about 1.91%. After rebounding to an intraday high of $64,169, it quickly pulled back. The market is currently in a weak retracement phase under geopolitical risk shocks, with overall movement confined to the short-term trading range of $60,000–$64,000.
I. Analysis of the Key Fundamental Driving Factors
1. International situation: Escalation of geopolitical conflict in the Middle East leads to a rapid drop in risk appetite
The U.S. has recently launched a military strike against Iran and has restarted oil sanctions. Iran immediately retaliated, and the ceasefire agreement between the U.S. and Iran is on the verge of collapse. Shipping risk in the Strait of Hormuz has risen to a “critical level.”
- Direct impact: Brent crude rose more than 2% in a single day to $75.68 per barrel, inflation expectations resurfaced, the U.S. dollar index strengthened, global risk assets came under pressure, and Bitcoin, as a high-volatility risk asset, weakened in tandem.
- Follow-up observation: if the conflict remains limited to localized strikes and does not expand into full-scale war, the emotional shock should be gradually digested within 3-5 days; if escalation events such as blockade of a strait or mass casualties occur, it will trigger systematic risk selling, and BTC will likely fall in sync with U.S. stocks.
2. Federal Reserve policy: hawkish tone unchanged, rate-cut expectations pushed back sharply
Minutes from the June FOMC meeting were released on July 8, maintaining an overall hawkish stance: the Federal Reserve reiterated its commitment to the 2% inflation target and did not provide any forward guidance on rate cuts; new Chair Walsh had previously clearly stated that “inflation is still too high,” refusing to endorse easing for the July policy meeting.
- Market pricing: CME FedWatch shows the probability of a September rate hike has fallen from 65% before the nonfarm payrolls report to 50%, but the market has broadly pushed back the timing of the first rate cut to 2027. A high-rate environment will persist for a long time, continuing to suppress valuations of non-yielding crypto assets.
- Key event: the FOMC meeting at the end of July is the month’s biggest macro catalyst and will directly determine the overall liquidity environment in Q3.
3. U.S. stock market linkage: tech stocks pull back, risk-asset correlation strengthens
On July 7 U.S. Eastern Time, the three major U.S. stock indexes all closed lower, with the Nasdaq down 1.16% and the Philadelphia Semiconductor Index plunging 4.65%. Tech leaders such as Intel and AMD fell more than 6%, as the market shifted from AI speculation to risk-off sentiment.
- BTC’s short-term correlation with the Nasdaq has risen back above 0.7, meaning risk appetite in tech stocks is directly transmitted to the crypto market; if U.S. semiconductor stocks continue to correct, BTC will find it difficult to stage an independent rally.
4. Capital and on-chain structure: institutional ETFs stabilize temporarily, whales provide support at lower levels
U.S. spot Bitcoin ETFs ended 10 consecutive trading days of net outflows totaling more than $2.7 billion. On July 6, net inflows reached $294.8 million in a single day, with BlackRock’s IBIT recording $164.3 million in inflows, ending several consecutive days of redemptions.
- Structural divergence: this round of inflows has mainly come from top-tier asset management products, representing passive replenishment after an oversold decline rather than broad-based allocation increases; sustainability still needs to be observed. June recorded a net outflow of $4.5 billion for the full month, the highest monthly figure since spot ETFs were approved, and institutions overall remain in a deleveraging cycle.
- On-chain support: Large-holder addresses (whales) have continued accumulating in the $58,000-$60,000 range, with recent net additions exceeding $16 billion. Buying by listed companies has already surpassed miner output, providing underlying support for medium-term prices.
II. Key technical levels
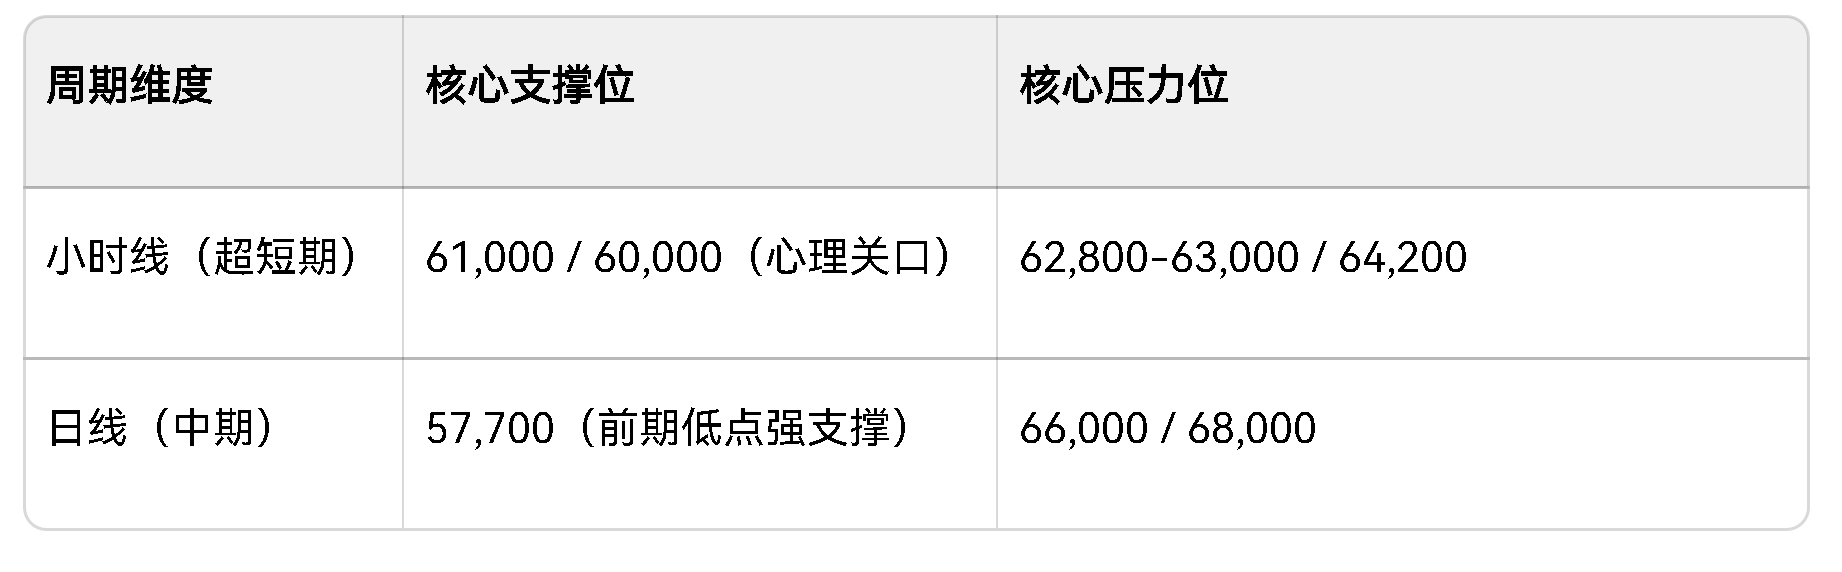
- Daily level: MACD remains in negative territory, and only 1 of the 12 moving averages is giving a bullish signal, indicating an overall bearish trend; price rebounded to around $64,000 but met strong selling pressure, with volume not expanding effectively and rebound momentum insufficient.
- Hourly level: showing a weak structure of “lower highs and shrinking volume”; bulls failed to reclaim the 63,000 psychological level, and bears currently hold the upper hand in the short term.
III. Outlook
Next 24 hours (very short term): weak consolidation with a bearish bias, driven by geopolitics
- Core trading range: $60,800 - $63,000
- Trend assessment: News around the U.S.-Iran conflict is still unfolding, and combined with the negative spillover from overnight weakness in U.S. stocks, intraday action will likely continue to be weak and range-bound, with limited rebound strength. If news of escalation emerges overnight, prices may quickly test the $60,000 psychological level; if no new negative developments appear, they will likely consolidate narrowly around $61,500.
IV. Trading recommendations and risk-control strategy
1. Short-term trading (intraday)
- If price rebounds to the $62,800-$63,200 range, consider a small short position, with a stop-loss above $64,300 and a target of $61,000-$60,500;
- If price quickly dips to around $60,000 and shows signs of stabilization (lower volume, long lower wick), a small long trade can be considered for a rebound, with a stop-loss at $59,500; move fast in and out, and do not linger.
- Position suggestion: no single position should exceed 5% of total capital, and leverage should be kept within 2x.
2. Core risk-control reminders
- Geopolitically driven price swings can be extremely large; avoid fully invested, high-leverage trading, as liquidity may dry up quickly during extreme moves;
- Closely monitor crude oil prices and the U.S. dollar index; if crude oil breaks above $80 and the dollar index breaks above 102, risk exposure should be reduced in a timely manner;
- All forecasts are based on currently known information; sudden policy or geopolitical events may quickly change the trend, so strategies need to be adjusted dynamically.
