

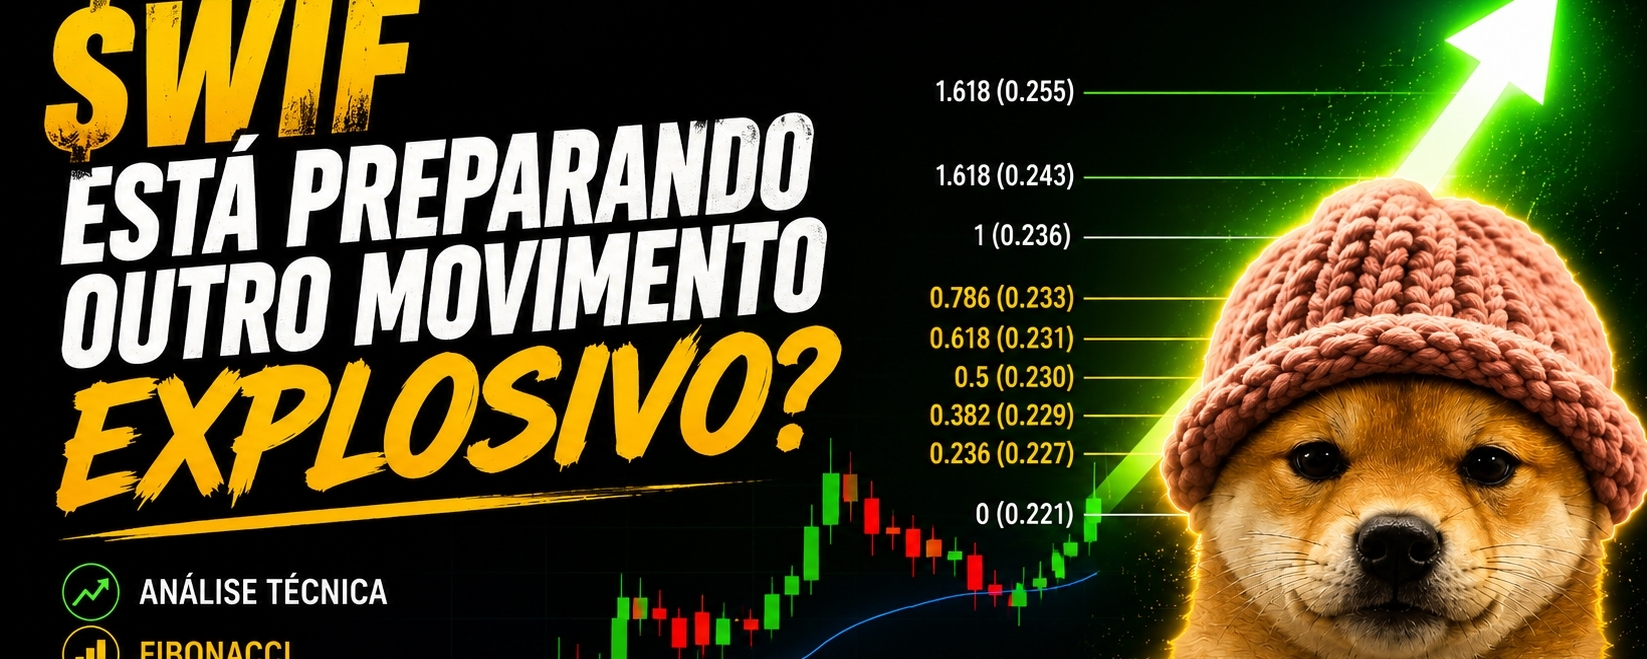

Based on the classic reading from Flávio Lemos — trend, volume, Fibonacci, and price action — $WIF is showing a bullish continuation structure, but is entering a critical decision zone.
🟢 Daily Timeframe (1D)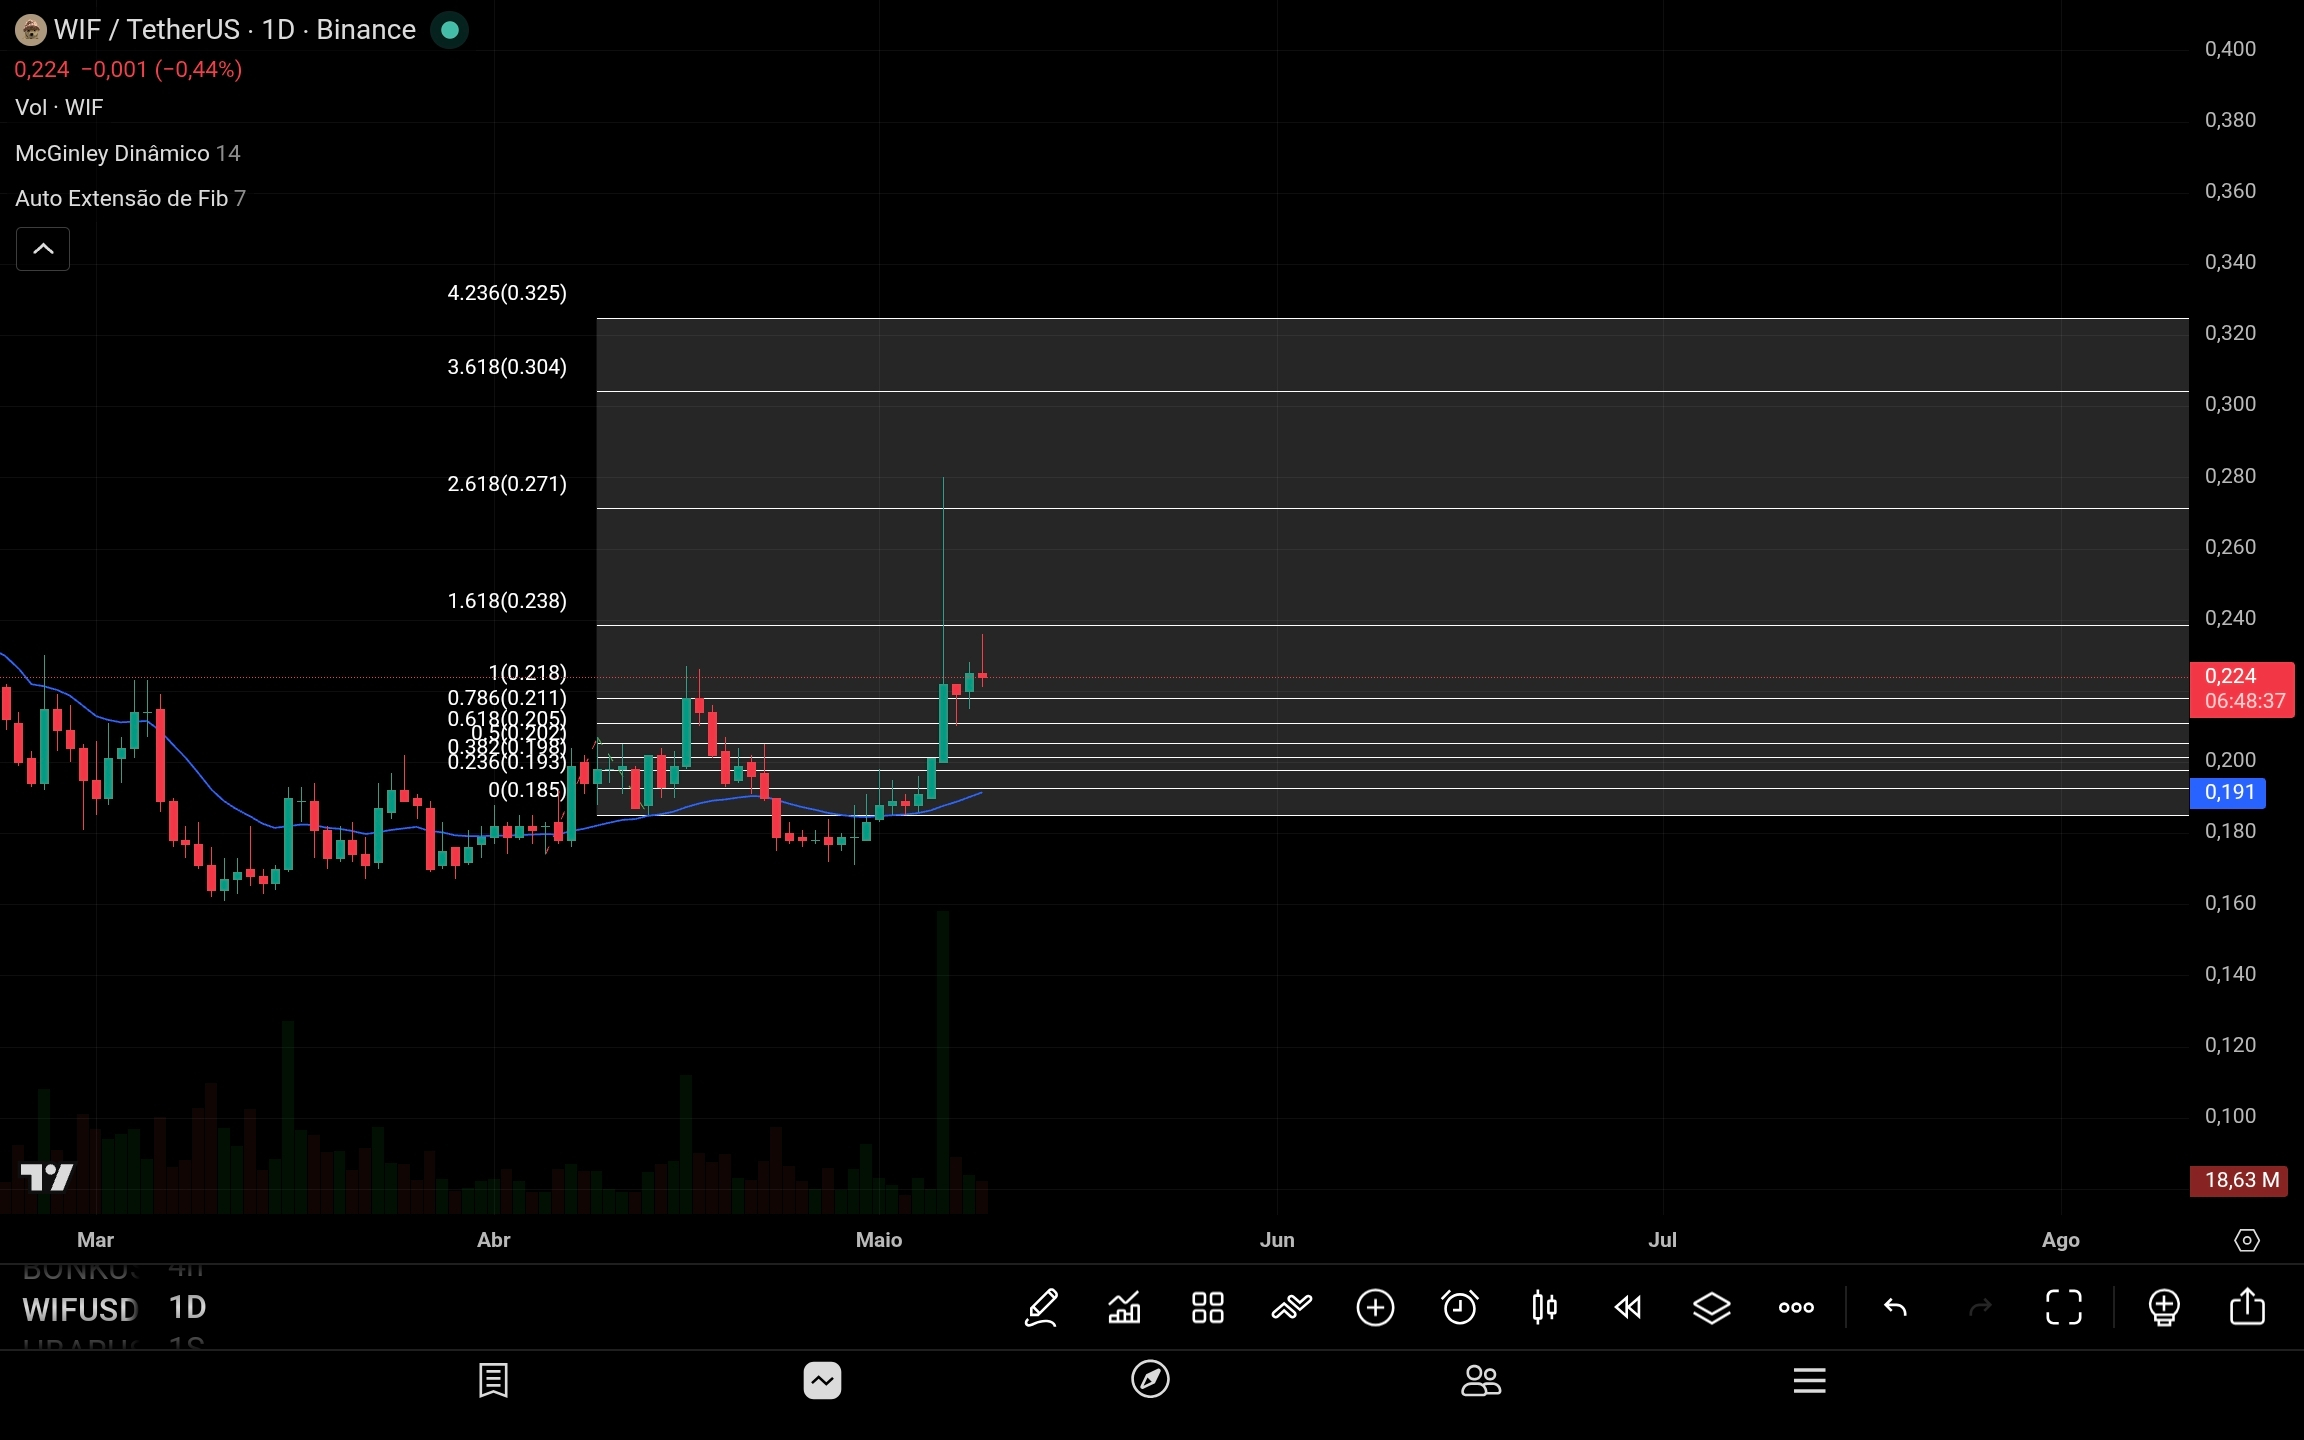
The daily chart is the most critical here.
It shows:
strong breakout of the previous structure;
significant volume increase;
impulsive candles;
clear recovery above the dynamic average.
This usually indicates:
👉 aggressive buyer entry.
The most important detail:
the price left the accumulation area near 0.18/0.19 and is now trying to turn that area into structural support.
🔥 Daily Fibonacci
The price is now working near:
0.211
0.218
This region is important because:
turned into psychological resistance;
now the market tries to confirm as support.
If it consolidates above this:
the chart starts to open up space to target:
0.238
0.271
0.304
And this directly relates to the idea in the book:
strong trends usually continue until clear reversal signals.
⚡ 5-Minute timeframe (5m)
In the short term:
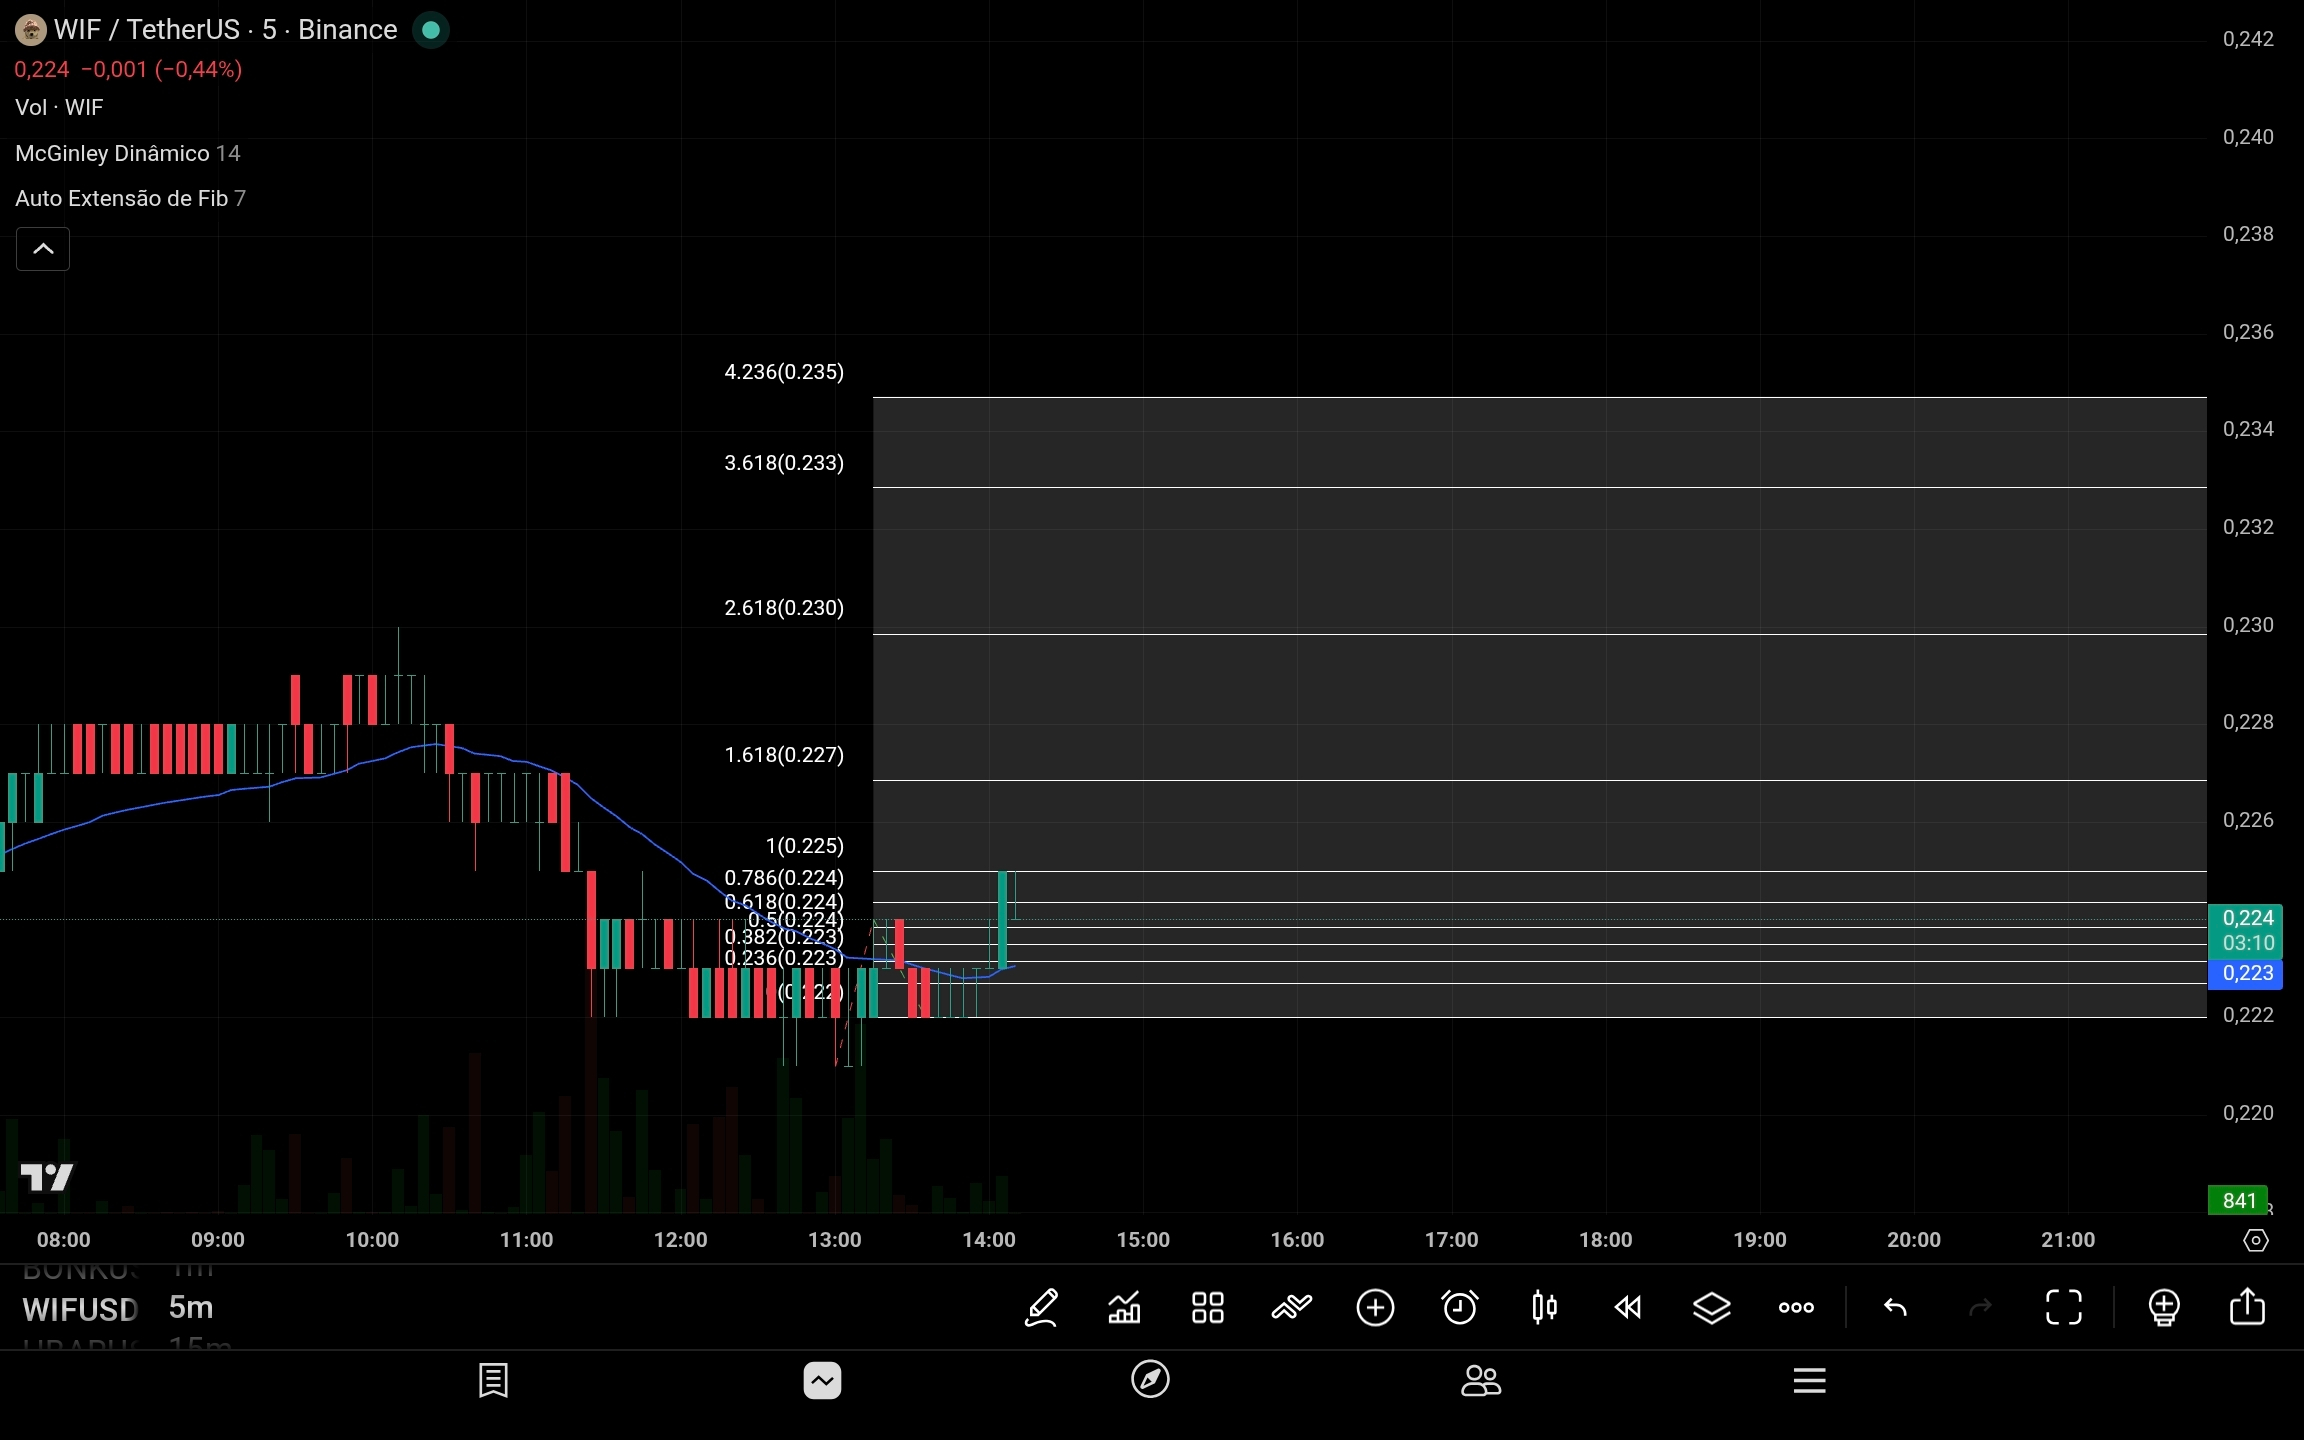
the market is ranging after the impulse.
This is healthy.
The price:
lost momentary strength;
but hasn't lost structure yet.
The most important:
👉 buyers continue defending 0.223.
📍 Decisive region now

Resistance:
0.224
0.225
0.227
Support:
0.223
0.221
0.218
🧠 Market psychological reading
The current behavior seems classic of:
short take profit;
selling absorption;
preparing for new expansion.
And meme coins usually:
trading on emotion;
liquidity;
FOMO.
So if it breaks:
0.227 with volume…
the movement can accelerate very quickly.
🚨 What would invalidate strength?
Losing:
0.221
dynamic average;
buying volume;
then the market will likely:
enter a larger correction;
look for lower regions;
cooling off momentum.
📊 Objective summary
Larger trend:
🟢 Bullish.
Short term:
🟡 Consolidation after impulse.
Structure:
🟢 Still strong.
Key point:
🔥 Breakout of 0.227.
Possible targets:
0.238
0.271
0.304
Risk:
⚠️ losing 0.221 weakens the scenario.