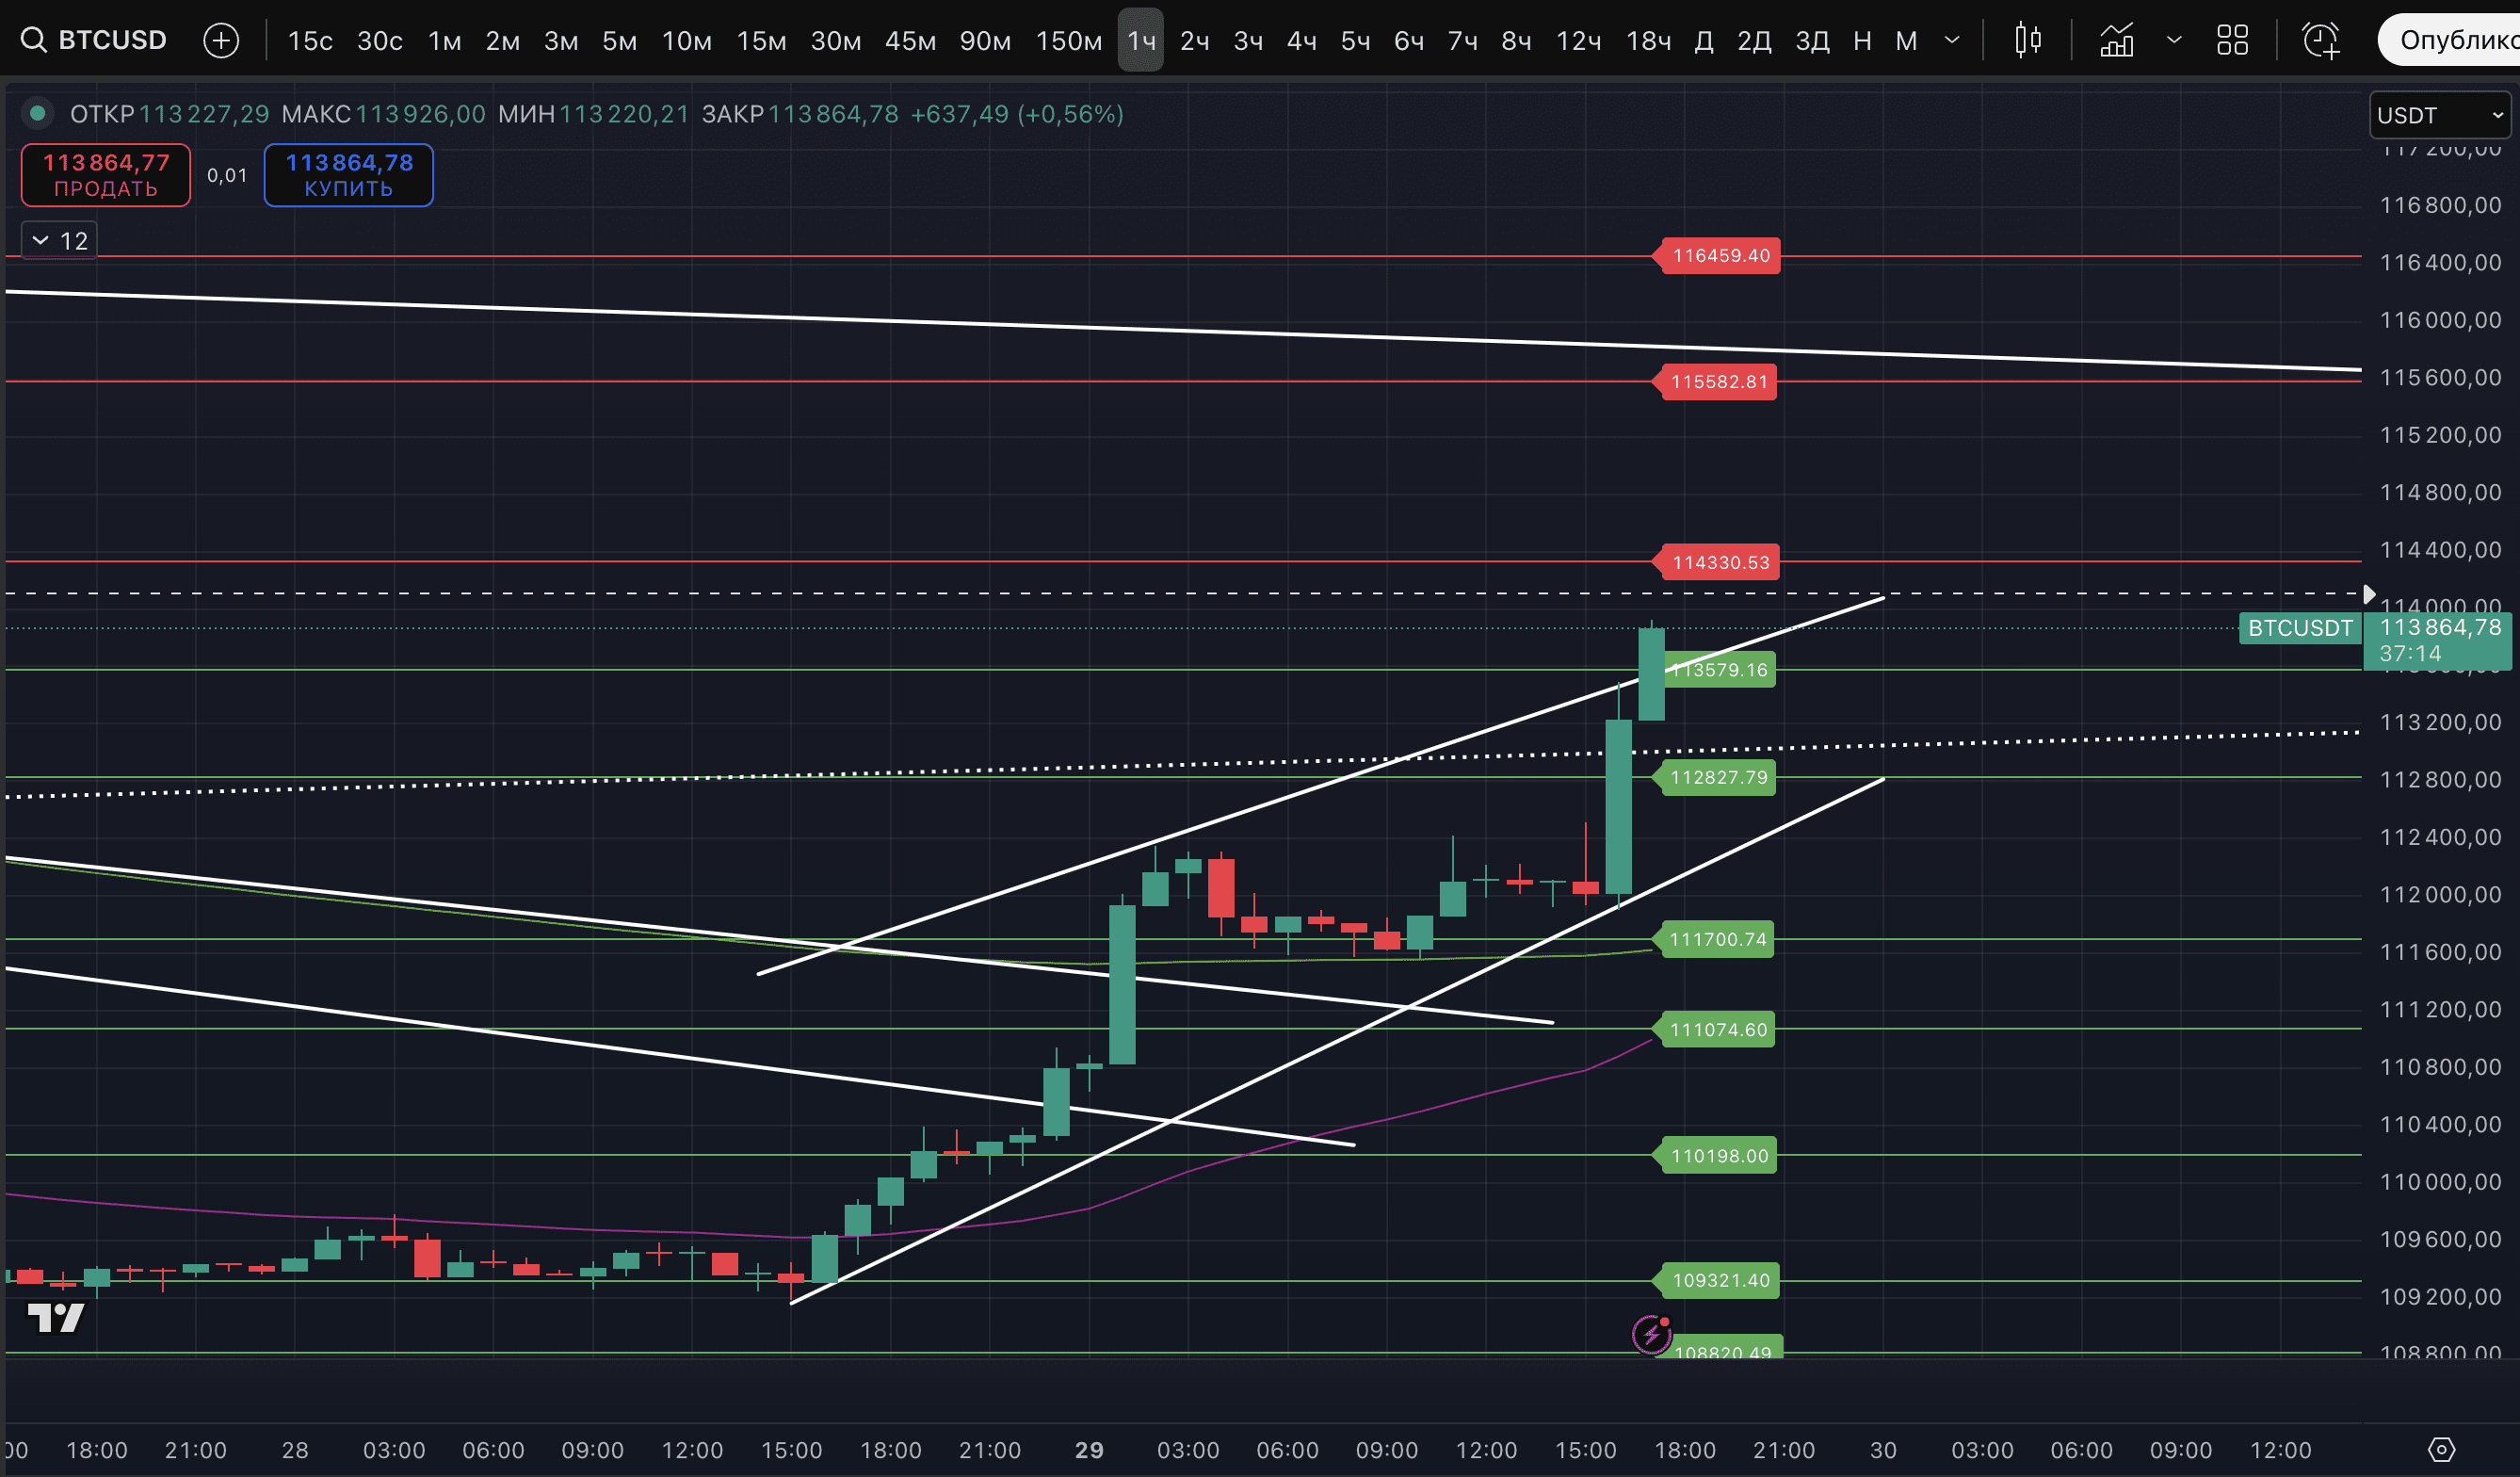
Regarding BTC, since last night we have been looking for an entry to short, but the price is already above 113,900$ and we are still "on the fence". Let's consider the current picture.
Buyers are still holding strong, but the arguments for a correction are piling up. At the very least, for a correction of the current pump. And possibly for a renewal of the low on September 1 (107,255$). Despite today's active growth, it is worth considering such a possibility. Although the growth is certainly impressive, it breaks reversal signals that have been present since last night.
Right now, for further growth, the marks of potential highs are primarily concerning, which are present on the 3-hour timeframe (broken), and also a Strong signal (!) on the 4- and 5-hour timeframes (one of them is in the process of formation). At the same time, overnight, the Strong signal of a potential high on the hourly and even 2-hour timeframes - did not materialize and broke.
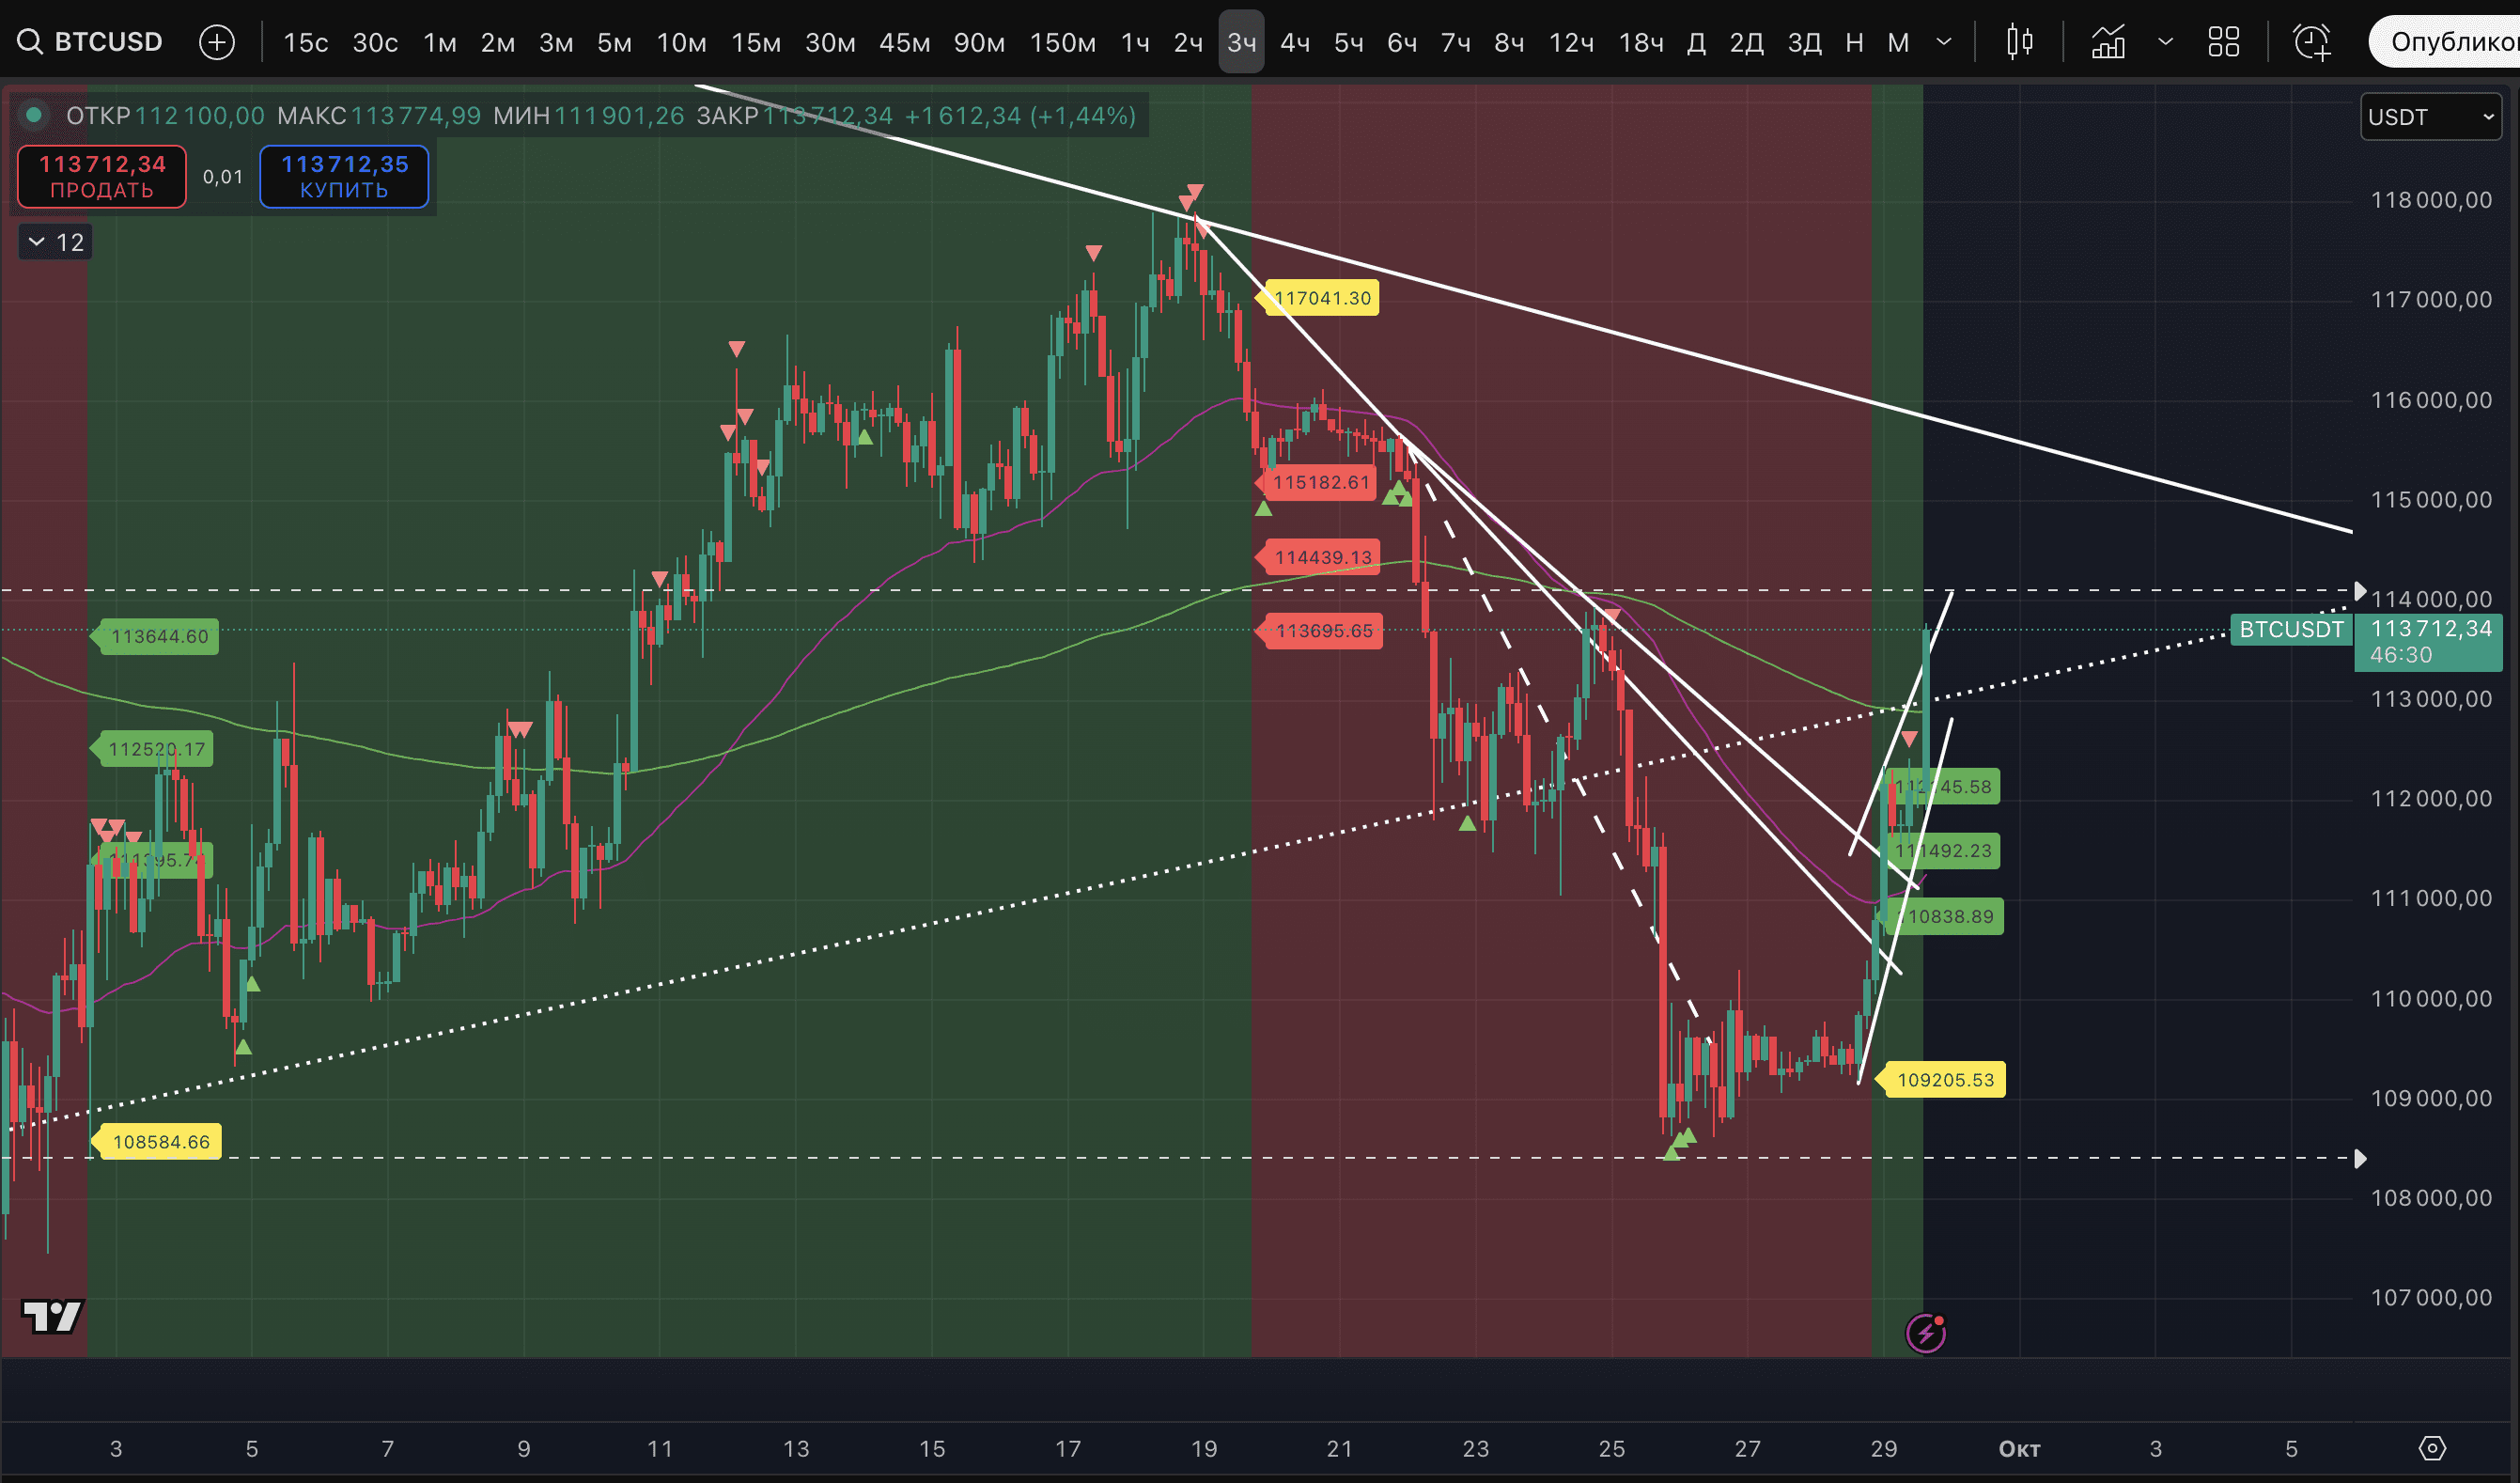
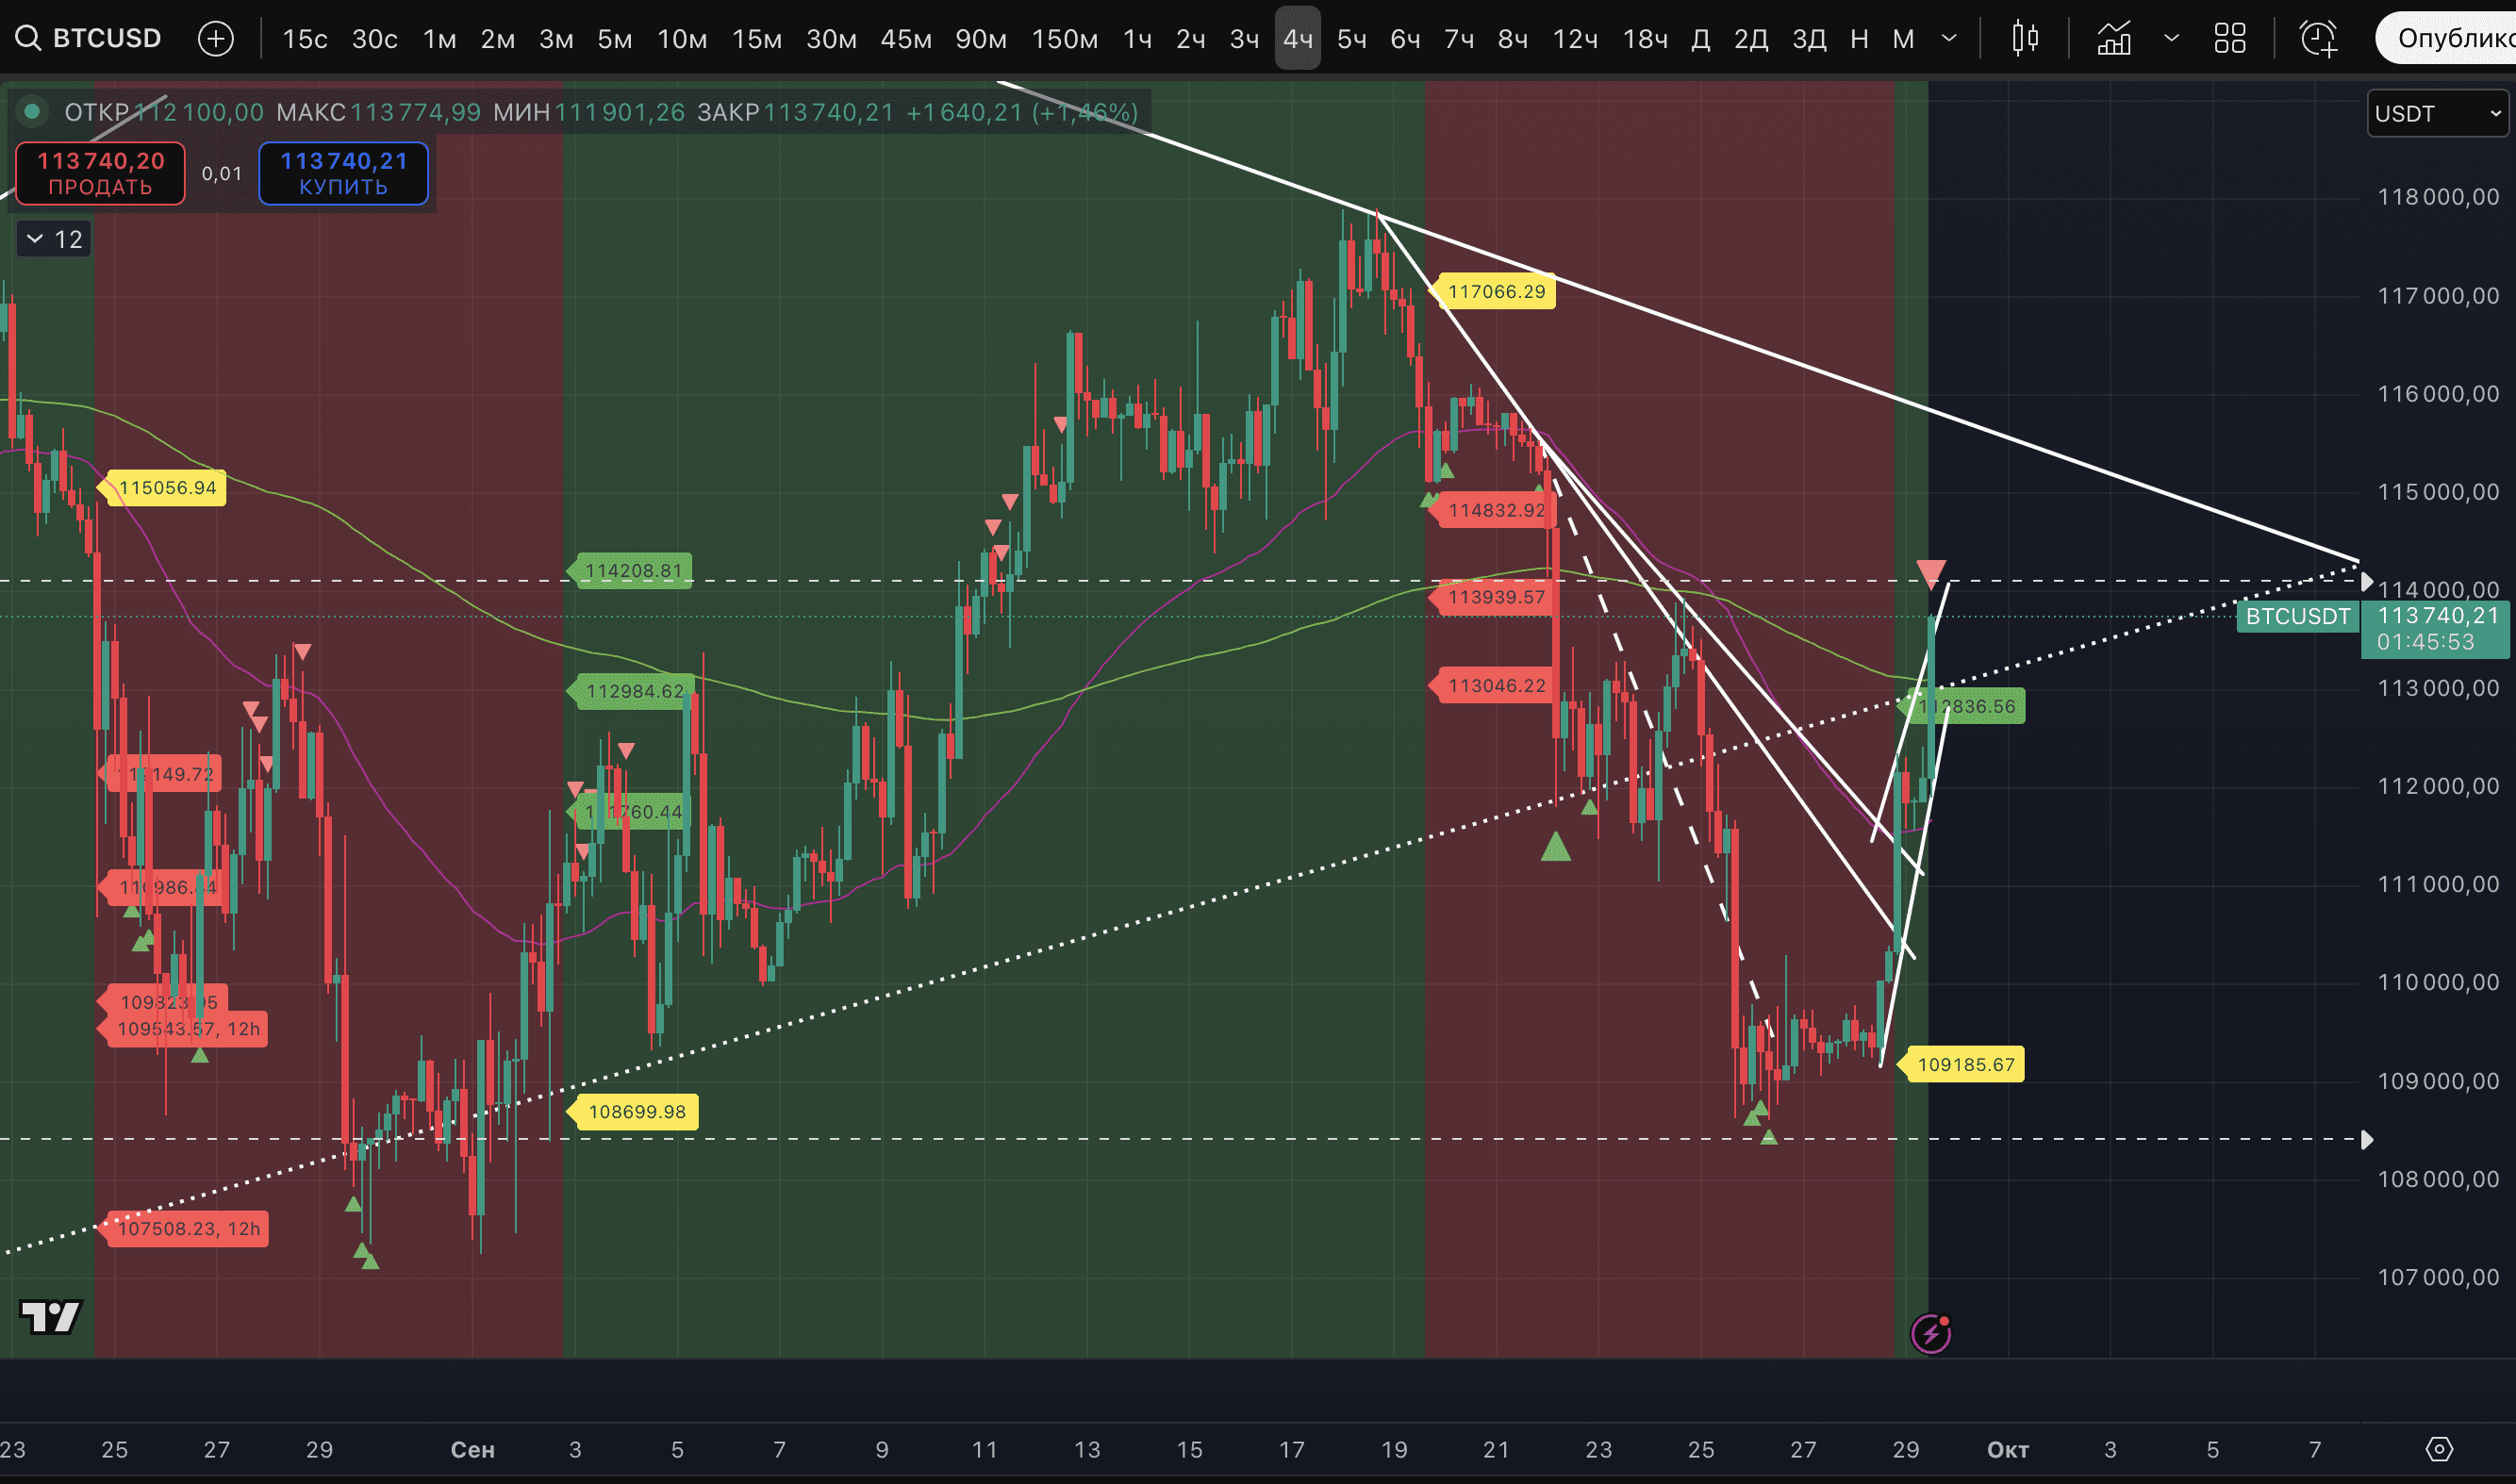
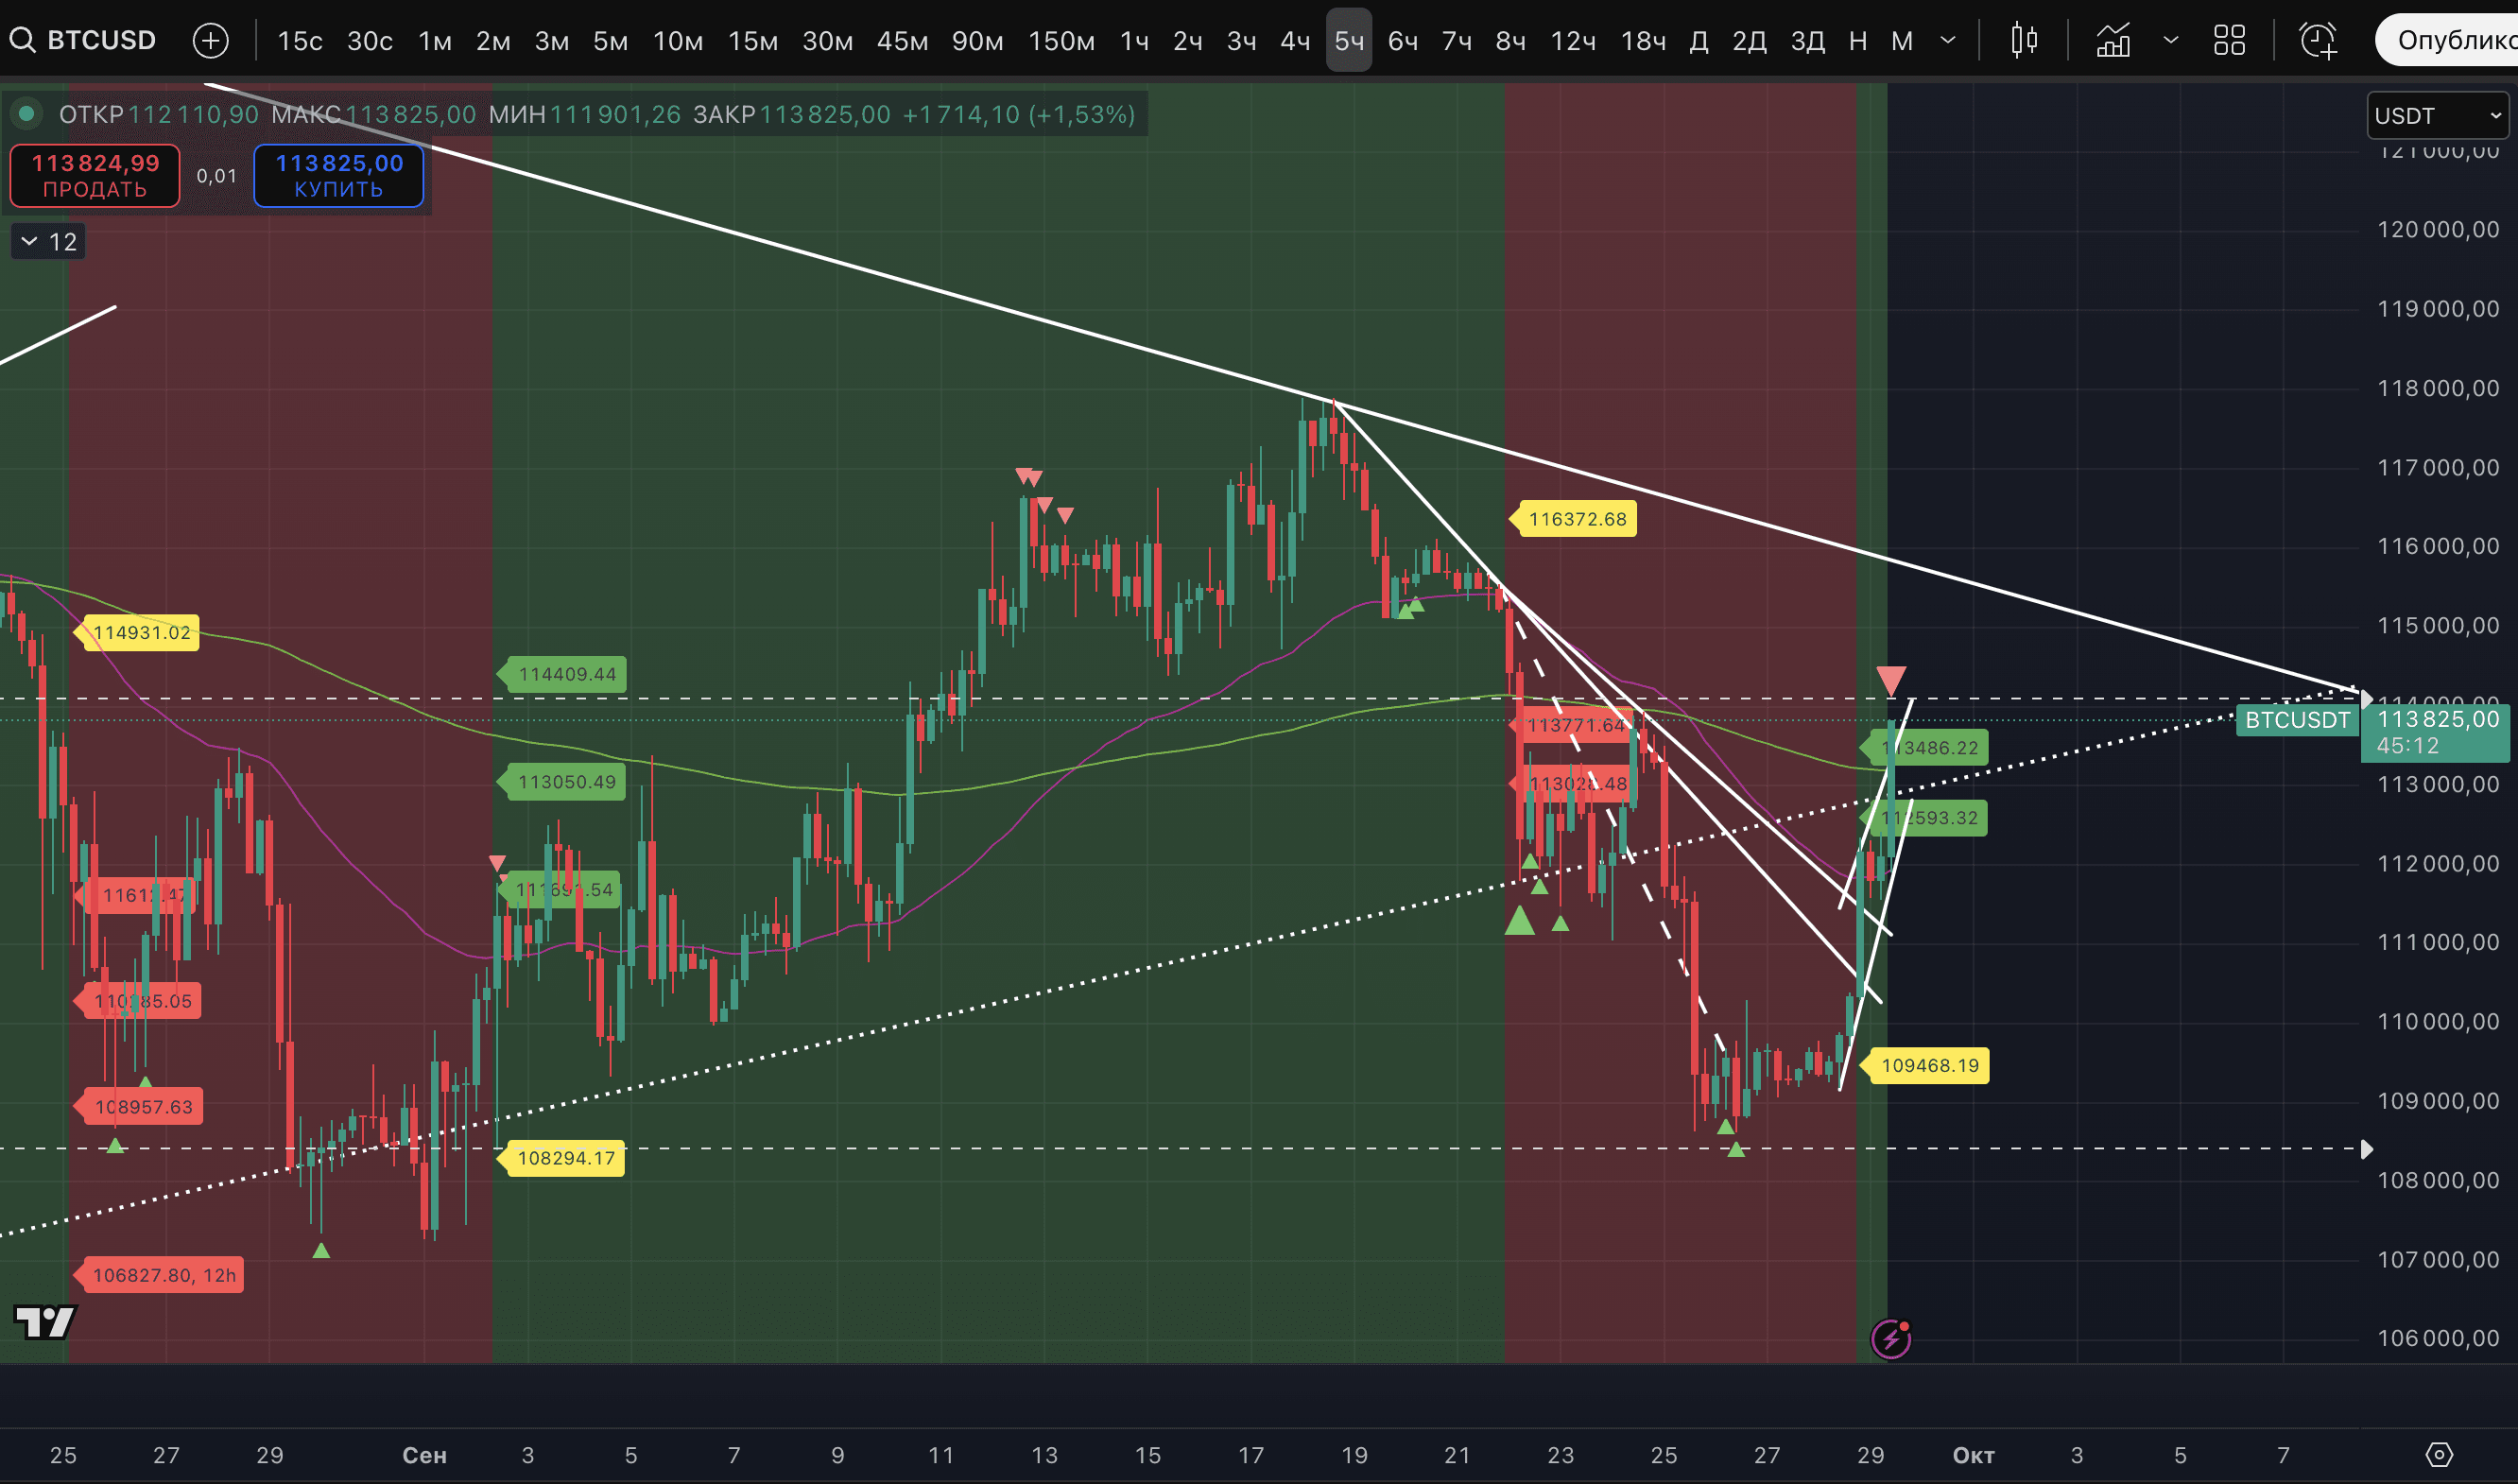
These marks are especially important considering that the price has reached key resistance according to EMA - EMA 50 of the daily timeframe at 113 295$. As long as daily candles close below this moving average and the price is in a stable downtrend on the daily timeframe - all this growth for us is just a bounce, not a reversal. Strong, impulsive, but a bounce.
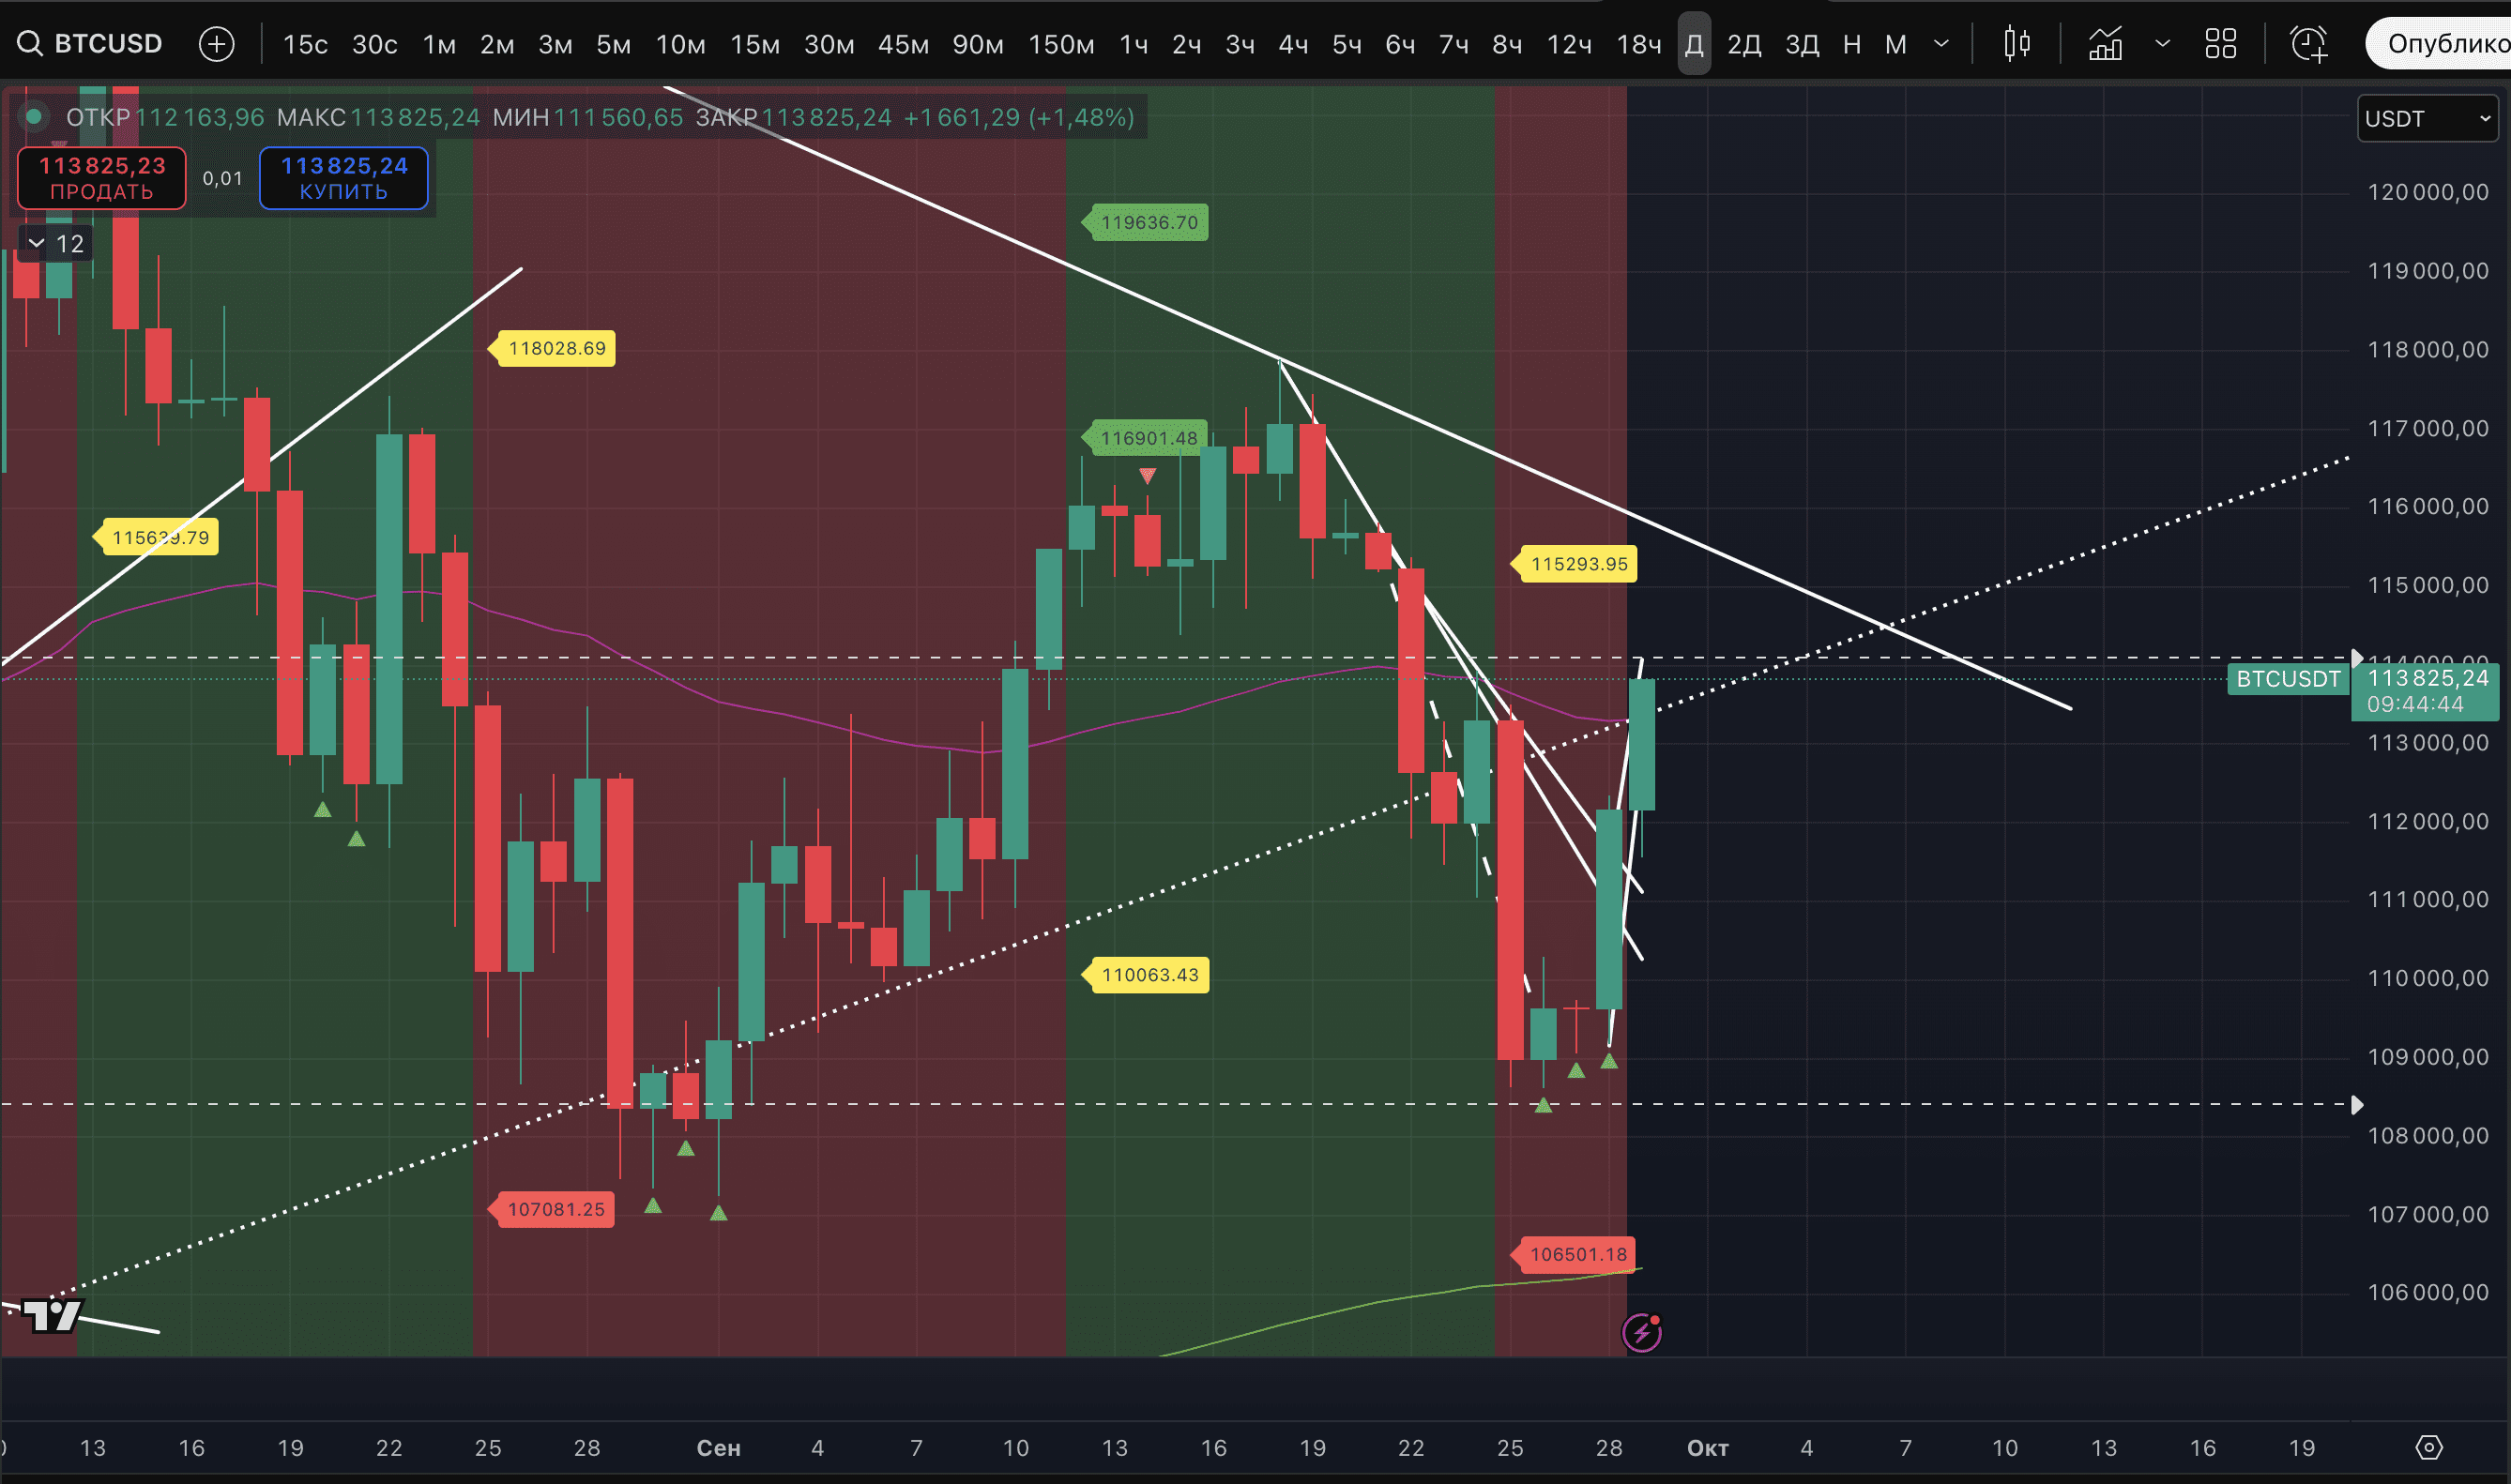
And the longer the no-pullback growth continues (after closing our long position yesterday in the range of 110 841-110 865$ - the price has increased more than during the entire position) - the greater the likelihood of impulse exhaustion. The question is when.
Both at night and during the day, we closely monitor the asset's price and, in particular, track the situation on the 5-minute timeframe. To filter out the likelihood of a reversal. So far, there have still been no convincing signals for a reversal.
There was an idea with a 'Bearish Wedge', but it was broken by the price exceeding 112 500$.
Currently, the price is testing the indicated EMA 50 of the daily timeframe and on the chart - Strong signal of a potential high on the 5- and 10-minute timeframes, 4- and 5-hour timeframes.
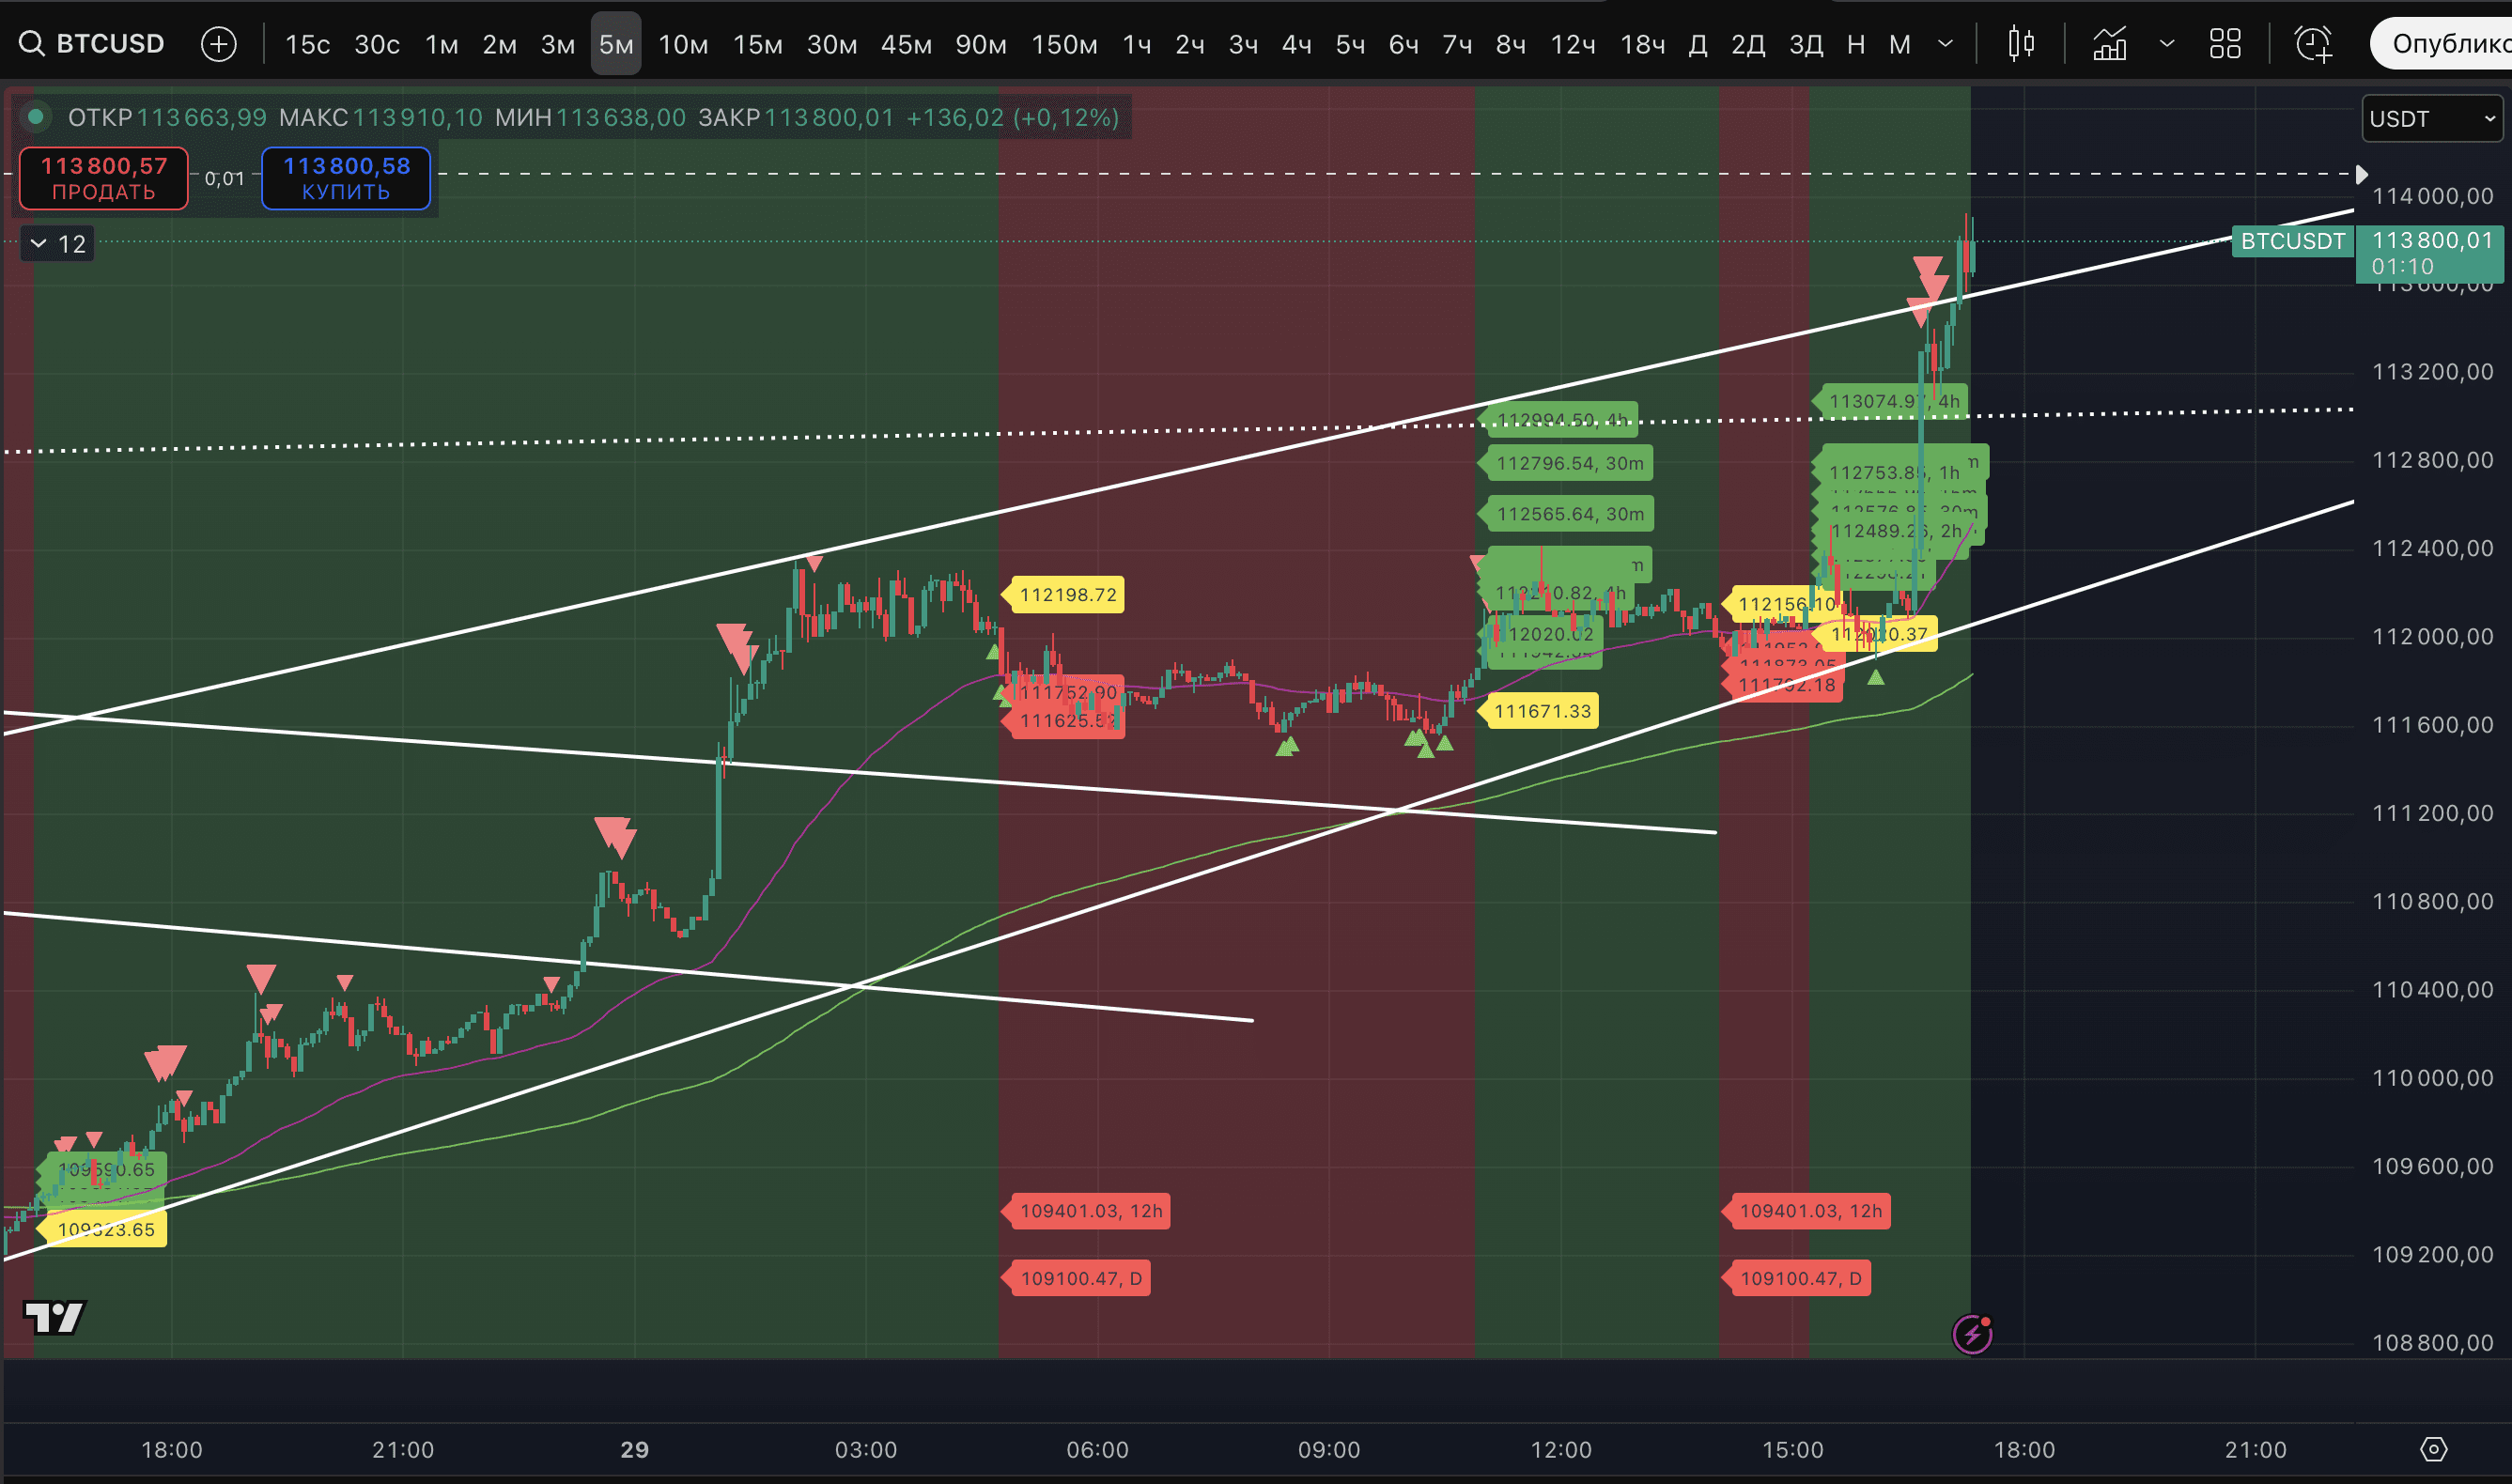
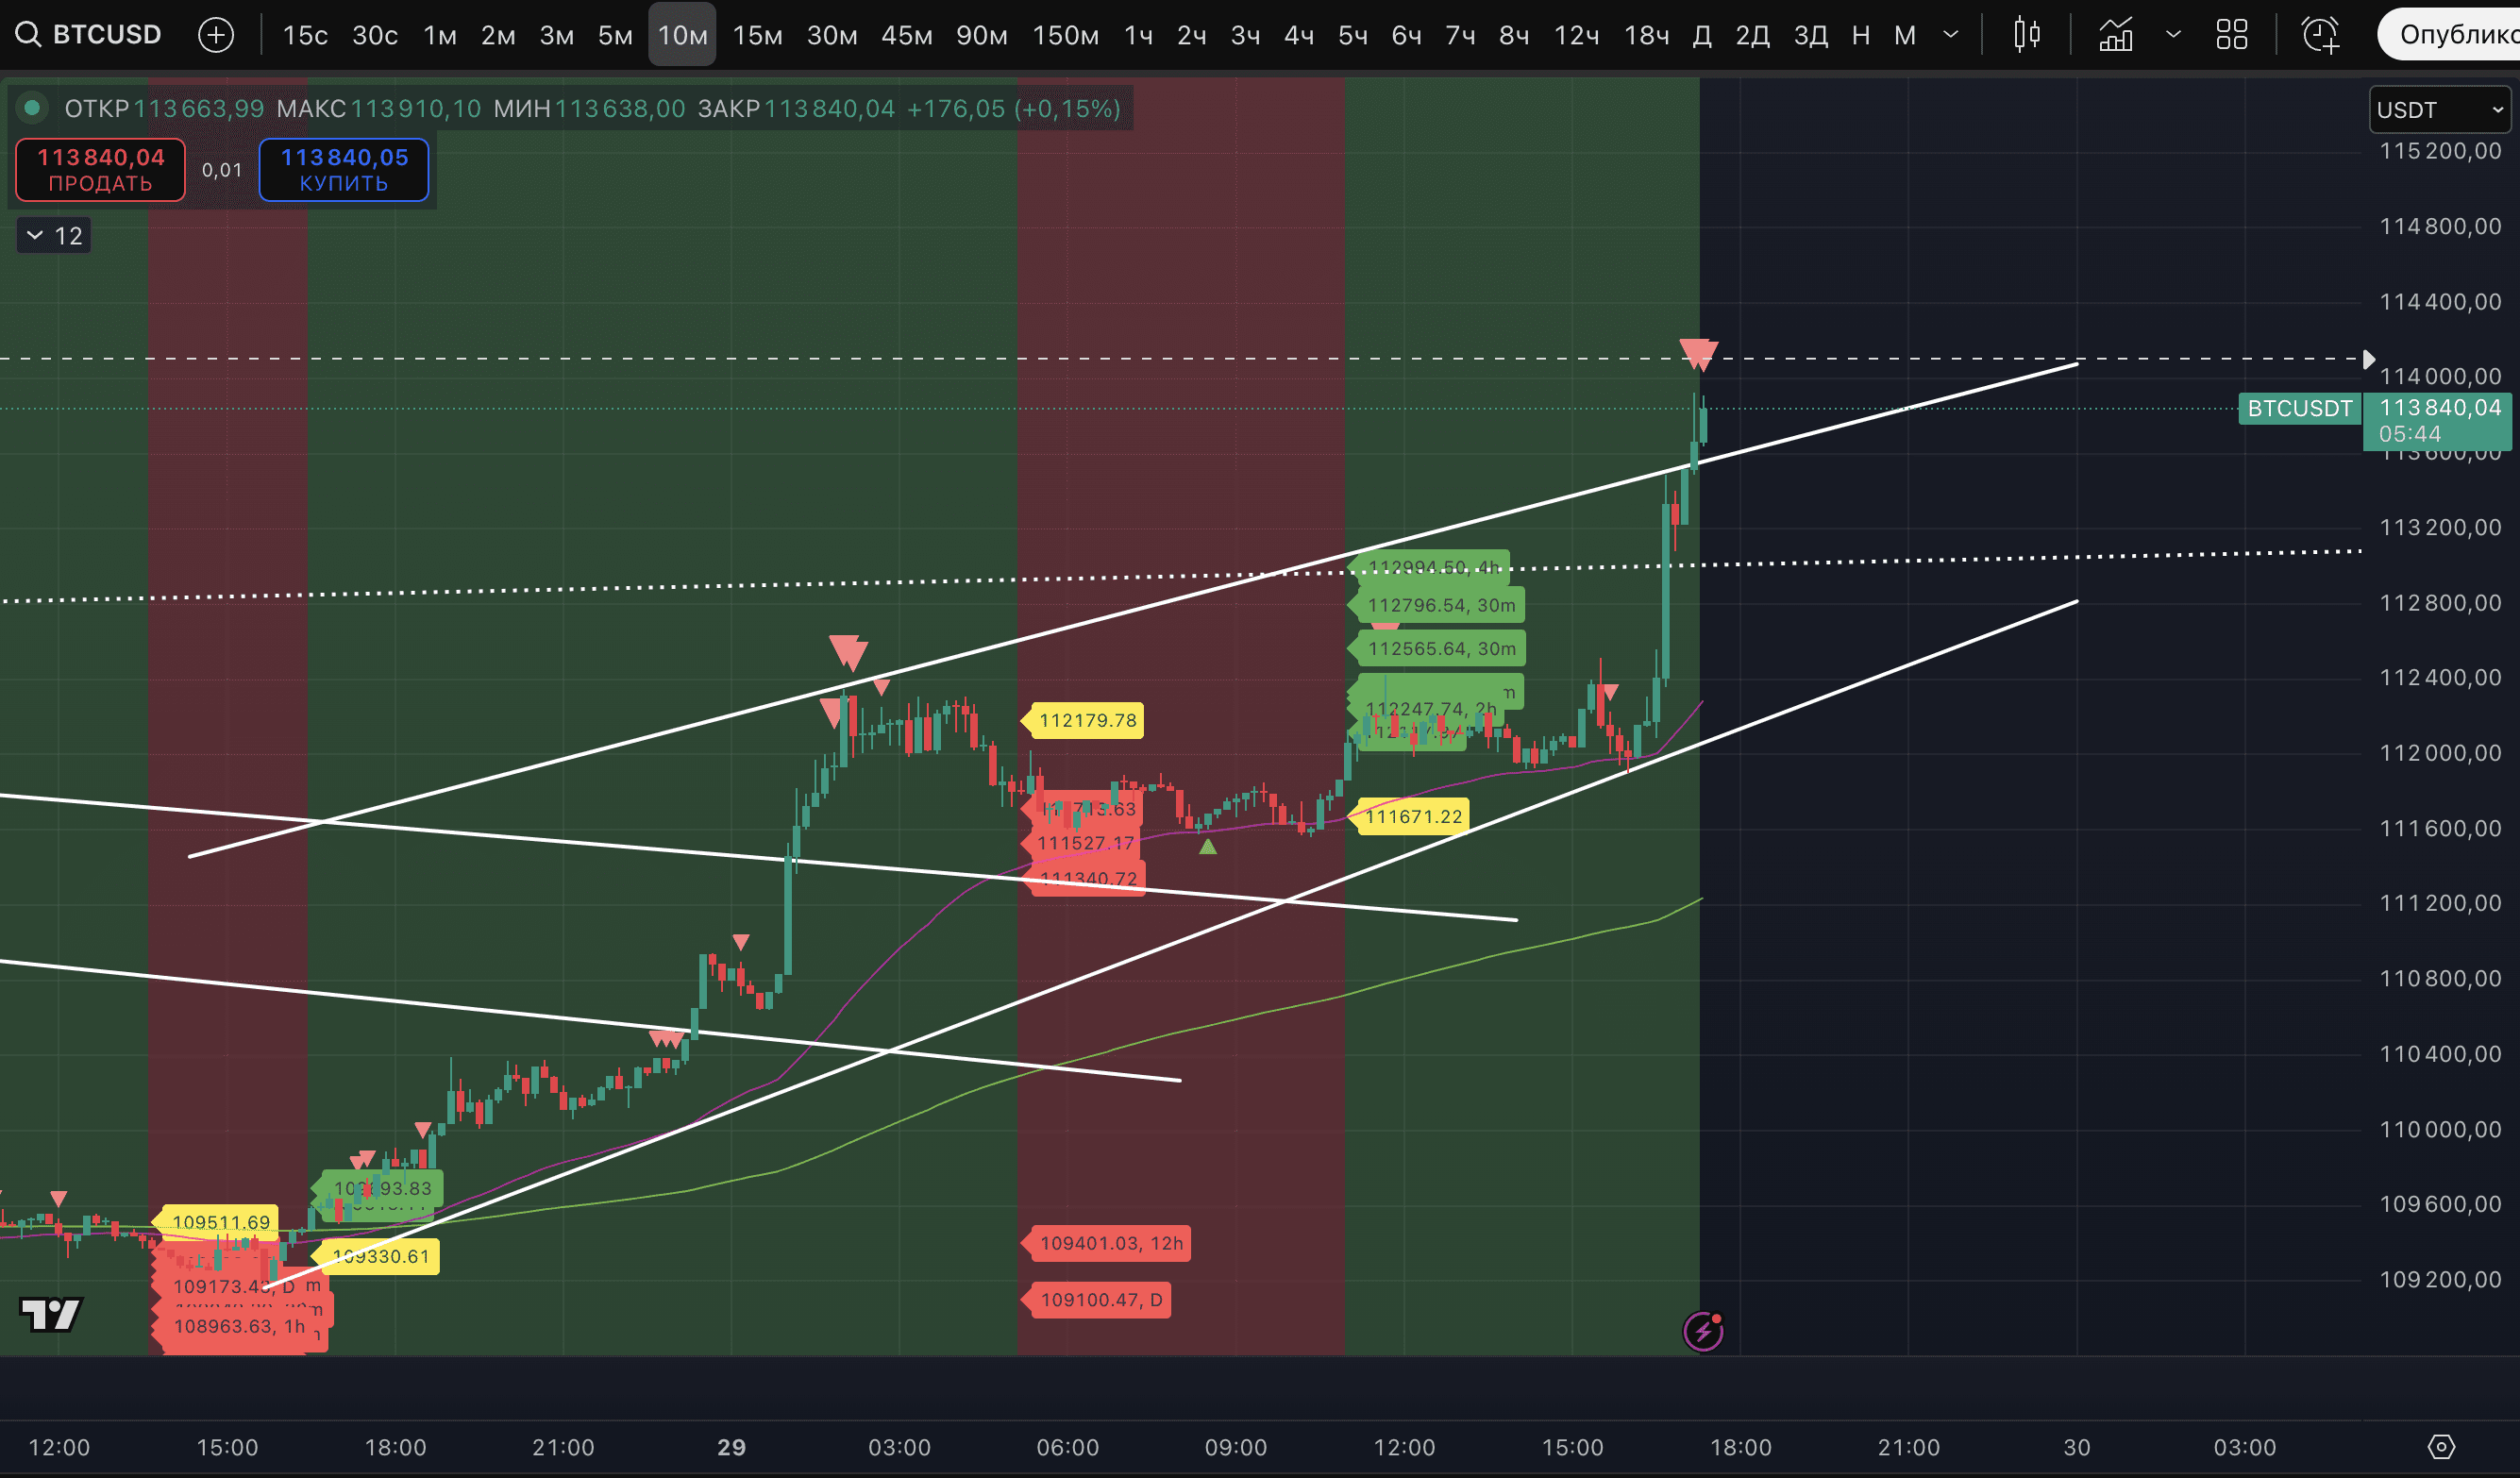
The combination from which a decline may well begin. But again - considering the strength of the trend, we need to see confirmation of a reversal. One assumption about the end of growth is not enough. There is a downtrend at least on the 5-minute timeframe and a stop above the high - a possible option.
What could be the target for the decline? Ideally, I would like to see that this decline on the Chicago Mercantile Exchange will close the gap 109 915-111 355$. And then - continuation of growth. But we will act, as always, according to circumstances.
Is it possible that there won't be a correction, and the price will go to ATH without a pullback? It is hard to believe that we won't collect liquidity below the low of September 1 (107 255$). Although it is never worth categorically dismissing.
Downtrends on the daily and 2-day timeframes are also, we emphasize, relevant. While they are in effect, we are working with the hypothesis of a powerful rebound that could become a bull trap. And we are ready for the short option.
In a separate screenshot, we show important horizontal levels. After breaking 113 579$, the next target is 114 330$. Further - only 115 582$.