NOBODY SEES THE CHART $BTC / $PAXG
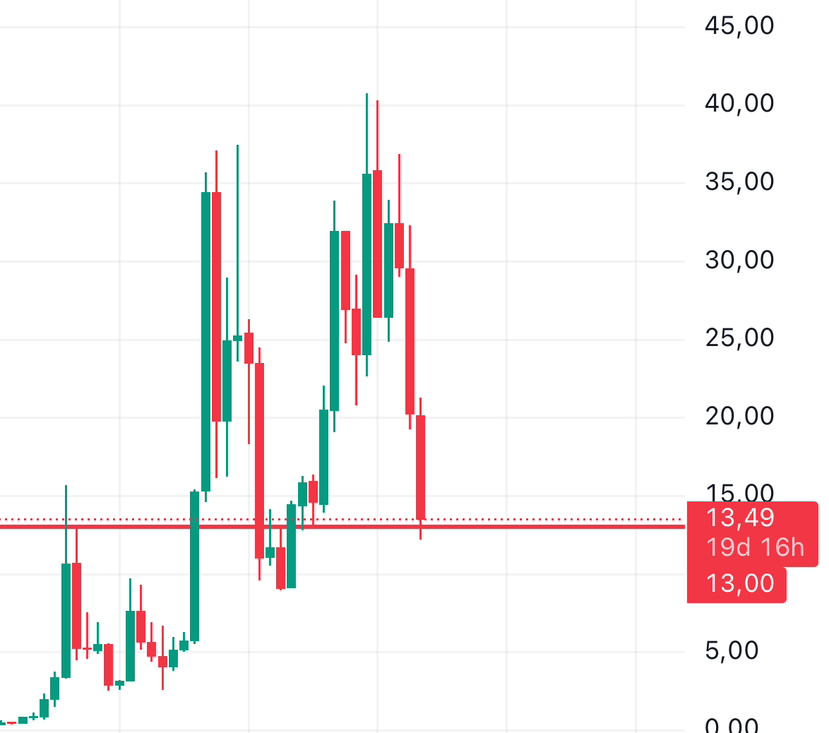
On the Bitcoin/Gold chart, we see the first reaction from a strong level: 13, which I have repeatedly noted in reviews as a good place for a 'technical bounce', meaning that, at least temporarily, the strength of Bitcoin against gold and stocks, as they say: either now or not for a long time...
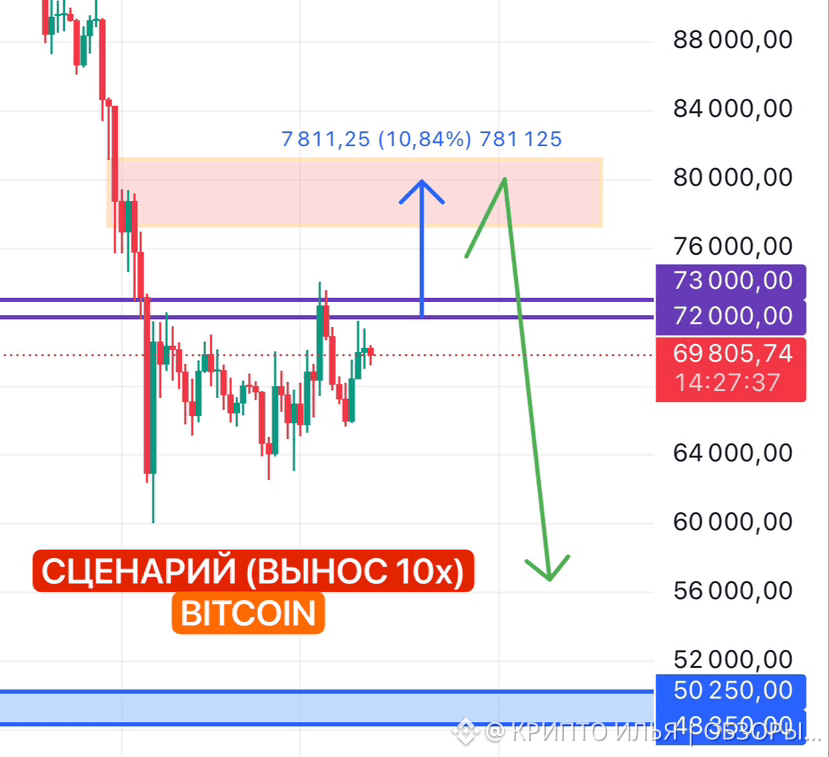
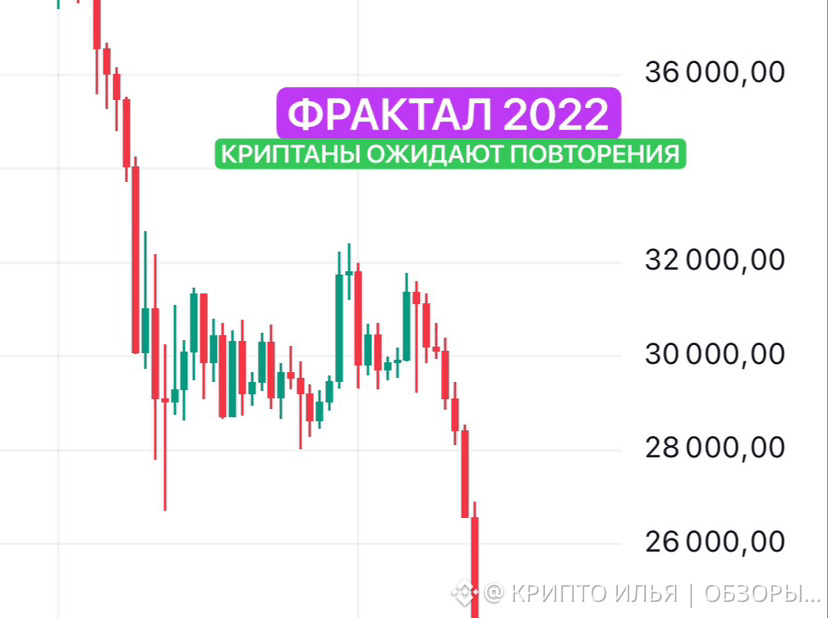
⭐Locally, the movements are extremely unreadable; the price is chopping in both directions for scalpers without any logic (so far I don't see opportunities). I believe the next downward movement in the market is only possible synchronously with a strong correction in the stock market (this will be the time for large purchases). Until it begins, there is time for a bounce and to take out the short sellers who are expecting a perfect repetition of the '2022 fractal' (screens above)...
On the Bitcoin/Gold chart, we see the first reaction from a strong level: 13, which I have repeatedly noted in reviews as a good place for a 'technical bounce', meaning that, at least temporarily, the strength of Bitcoin against gold and stocks, as they say: either now or not for a long time...
⭐Locally, the movements are extremely unreadable; the price is chopping in both directions for scalpers without any logic (so far I don't see opportunities). I believe the next downward movement in the market is only possible synchronously with a strong correction in the stock market (this will be the time for large purchases). Until it begins, there is time for a bounce and to take out the short sellers who are expecting a perfect repetition of the '2022 fractal' (screens above)...